warwick.ac.uk/lib-publications
Manuscript version: Author’s Accepted Manuscript
The version presented in WRAP is the author’s accepted manuscript and may differ from the
published version or Version of Record.
Persistent WRAP URL:
http://wrap.warwick.ac.uk/106725
How to cite:
Please refer to published version for the most recent bibliographic citation information.
If a published version is known of, the repository item page linked to above, will contain
details on accessing it.
Copyright and reuse:
The Warwick Research Archive Portal (WRAP) makes this work by researchers of the
University of Warwick available open access under the following conditions.
Copyright © and all moral rights to the version of the paper presented here belong to the
individual author(s) and/or other copyright owners. To the extent reasonable and
practicable the material made available in WRAP has been checked for eligibility before
being made available.
Copies of full items can be used for personal research or study, educational, or not-for-profit
purposes without prior permission or charge. Provided that the authors, title and full
bibliographic details are credited, a hyperlink and/or URL is given for the original metadata
page and the content is not changed in any way.
Publisher’s statement:
Please refer to the repository item page, publisher’s statement section, for further
information.
Motion Sickness and Human Performance – Exploring
the Impact of Driving Simulator User Trials
Joseph Smyth1,Stewart Birrell1, Alex Mouzakitis2 and Paul Jennings1
1 WMG at the University of Warwick, Coventry, United Kingdom 2Jaguar Land Rover, Coventry, United Kingdom 1{j.smyth.2, s.birrell, paul.jennings}@warwick.ac.uk
2{amouzak1}@jaguarlandrover.com
Abstract. To ensure transferability of driving simulator-based user trials (where motion sickness onset is likely) it is important to understand if motion sickness affects human performance and therefore user trial data validity. 51 participants had their task performance ability measured in six defined categories (including physical, cognitive, visual and the intersections of each) both before and after a driving simulator exposure. Their motion sickness state was compared to their change in task completion scores across the six areas. Findings revealed that mo-tion sickness had a significant effect on cognitive performance, physical perfor-mance, physical-visual performance and physical-cognitive performance. There was no gender effect on motion sickness severity, but it did effect participant dropout, where female nausea was a significant effector. Age had no effect on motion sickness onset and other findings are also discussed. Conclusions from this research aid in the understanding of simulator-based user trial data validity.
Keywords: Human Factors · Motion Sickness – Comfort - Safety –– Vehicle Simulator – Human Performance
1
Introduction
Motion sickness (MS) is an ‘umbrella’ term, covering many types of motion (or per-ceived motion) induced ‘sicknesses’ such as ‘car sickness’, ‘seasickness’, ‘virtual real-ity sickness’ and ‘simulator sickness’. MS research has been considerably under-re-searched over the past 20 years, however with the development of technologies such as virtual reality devices, the increasing use of driving simulators, and the push to develop self-driving vehicles the demand for MS research is again of relevance.
Hence, the requirement to grade MS levels to understand the extent of the sensation. There are currently two main theories that suggest the causes for MS.
1.1 Sensory Conflict
The theory of sensory conflict explains that “mismatches between (or within) the visual, vestibular, and somatosensory inputs” cause MS [1]. This essentially means that if movement is sensed (for example) within the inner ear which does not correlate to the motion that is seen by the eye, then there is a conflict of senses and MS prevails. This conflict can arise if the human eye sees movement around it, but the inner ear senses no motion, or vice-versa. Sensory conflict can also arise through more acute mismatches. This theory is often favoured in explaining MS, for reasons as shown by [2].
1.2 Postural Instability
The central hypothesis of postural instability theory is that MS is caused by loss of pos-tural control [2] . As such, an underlying contributor to this theory is pospos-tural sway – where the human body is understood to be in constant movement through small, multi-axial swaying motions. These motions that can be exhibited in all states, including sit-ting, are thought to help the brain predict motion through comparing expected sway against any immediate effects/variations. The postural instability theory is more recently being considered as less of a cause of MS, but perhaps more of a precursor to MS. Where studies have shown postural instability may not necessarily cause MS, but does precede subjective MS symptoms [3] [4].
2. Motion Sickness and Future Technologies
With an understanding of the two theories presented above it is possible to understand why people may become motion sick in certain situations. Historically it has been com-mon to hear complaints from those attempting to read a book whilst being a passenger in a car, or when traveling inside a boat with limited views of the horizon. Incidentally, in both these examples the cause of MS is likely due to the mismatch of the static visual environment and the physical movement sensed by the inner ear. However, with the development of future automotive technologies such as vehicle simulators there is growing concern for other forms of MS and potential impacts. Although vehicle simu-lators have been around for many years, it is the recent popularization of these which brings the subject to relevance. With the rapid development of technologies (such as self-driving vehicles) and the improvement in simulator capability and design, more and more research is being conducted within simulated environments.
2.1 Motion Sickness in Vehicle Simulators – Simulation Sickness
simulator is referred to as ‘simulation sickness’ - a form of MS. It is not uncommon to see around 25% of participants not able to complete a simulator study due to MS onset. A meta-study of such MS looking at multiple user trials [5], reported the highest drop-out rate in one trial as 71% (pp. 259). Where the mean drop-drop-out percentage was 14% between the 9 user trials this paper reviewed.
2.2 Impact of Motion Sickness on Human Performance
It is understood that a considerable percentage of the population will likely become motion sick (or simulator sick) in vehicle simulators. There are two main areas of con-cern considering the impact of MS. The most immediate concon-cern is in relation to com-fort and wellbeing of participants in simulator studies. However, limited consideration has been given to understand to what extent human performance is affected by MS.
Considering seasickness, (another form of MS) one study looked at cognitive func-tion and found that “5% of their users did not complete a task when not feeling sick at all” (i.e., in a baseline condition), however “this increased to about 60%’ when sub-jected to motion primed sickness” [6]. In 2005 NASA sponsored a project with the aim of increasing task performance ability in a commonly MS prone environment – space travel (where MS in this state is commonly referred to as ‘space motion sickness’). In this study [7] they employed a virtual reality training period aimed at reducing MS. The results showed that training reduced nausea scores (a subscale of MS measurement) and also significantly increased task performance when compared to the control group. The task being measured was an industry/job specific “navigation and switch activation task” [7]. A separate US military project from 1995 also touched on this relationship between task performance and MS, where they advised that if a person reports MS whilst using their tank simulator they “should not be required to drive any (real-world) vehicle” [8] as they expected an impact on task performance ability. This recommen-dation was echoed by another report which concluded MS “could directly affect visuo-motor coordination” [9]. The recommendation that participants should not operate heavy machinery within two hours of completing a driving simulator study is consid-ered good practice and is frequently advised in most simulator trials.
2.3 Motion Sickness, Human Performance and Vehicle Simulator Use
One of the main objectives of any simulator-based study is to ensure that participants interact with the technology in the same way as they would in the ‘real-world’. How-ever, without knowing the impact of MS on human performance, this ‘transferability’ cannot yet be assured. The research objective was therefore set to understand to what extent does MS affect human performance?
3. Method
To answer the research question it was important to first consider what ‘human perfor-mance’ consists of, specifically, what is required of a driver. Figure 1 (below) shows the three key areas of performance in relation to driving: physical, cognitive and visual performance (and the intersections between each). Auditory performance was not con-sidered for this user trial, as this is not a requirement to drive a vehicle.
Fig.1 Task Performance Diagram
Considering the range of tasks a driver is expected to perform, and without being able to predict what interactions future vehicles may require, it was not possible to measure human performance with driving-specific tasks. Instead, the six areas above are likely to cover every human interaction instance at its core performance ability. For example route planning may fall within the cognitive performance section, pressing a button (requiring visual skill and physical dexterity) would fit in the physical-visual section, and interacting with an out-of-sign control may rely on just physical performance.
Six individual tests were selected, one to assess each intersection of the above human performance diagram. The tests were chosen based on a few criteria: they should be pre-validated and standardized tests, they should each take less than 1 minute to com-plete, they should have no learning affect (i.e., once familiar with the test, repeated exposures should not affect the scores) and they should represent the section they are assigned to test and be independent of others as much as possible. Through an extensive review of the literature, the pre-validated tests decided for each intersection included:
Test 1 - Visual performance: A visual acuity ETDRS LogMar test chart was used whereby participants would use only their dominant eye, standing at a set distance and read out the letters presented on the chart. They were scored on the total number of letters read.
Test 3 - Cognitive performance: A ‘Paced Visual Serial Addition Test’ (PVSAT) was used, which is a visual version of an n-back test (for n-back see [11]). Numbers were presented on a screen and participants had to add the current number to the previ-ously shown number and give the answer verbally. A 200pt font size with black text on a white background was used to isolate cognitive performance by reducing any effect of visual performance. Participants were scored on the number of correct answers.
Test 4 – Visual-cognitive performance: A mental rotation test was used [12] whereby a ‘target’ 3D shape was presented on paper to the participant with four other shapes, their task was to identify which two of the shapes matched the target shape, despite being rotated in a different plane. Participants were scored on completion time and the number of correct answers (i.e., if they gave the two correct shapes per question).
Test 5 - Physical-visual performance: The Perdue Pegboard (see [13]) was used which requires the physical dexterity and visual skill of locating pins in small holes. Participants were tested with their dominant and non-dominant hand independently and were scored on the number of pins they put in the holes in the time given (60 seconds). Test 6 – Physical-cognitive performance: A reaction time test was used whereby a large traffic light was displayed on the screen, when the bottom green light illuminated (within a random length of time between 1 and 6 seconds) the participants had to press a physical button. This test depended on cognitive processing speed and the physical response to press the button. Participants were timed for five consecutive repetitions and their score was derived from the average of the five measurements.
Participants completed a demographic questionnaire and the Simulation Sickness Ques-tionnaire (SSQ) [14] to give a baseline result of MS and to counter any pre-existing conditions such as fatigue. They were then guided through all six tests as a learning activity (familiarization run) where the tests were explained and no scores were taken. After familiarization, the tests were given again (in a randomized order) and scores were taken as their baseline results. Participants were then introduced to the driving simulator (the 3xD simulator at the University of Warwick [15]) and were read a pre-prescribed script on the upcoming driving scenario. The participants were asked to drive along a pre-set route following automated voice-command directions. The route takes around 30 minutes to complete in its entirety including 5-minutes of a familiarization route at the beginning, followed by a mixture of country, town, and motorway roads.
Throughout the driving participants were asked (via a two-way intercom system) to rate their MS once per minute as per the Fast Motion Sickness Questionnaire (FMS) [16], where a rating out of 20 was noted. After the driving scenario participants com-pleted the six tests once again and scores were taken to give a comparative measure. Participants filled out another SSQ considering their MS feelings whilst completing the six tests. Participants who ended the driving scenario early due to MS were still able to complete the six tasks and SSQ again (as long as they were comfortable to do so). The six tests were given with the aim of completion within the first 6 minutes of the driving scenario ending, due to the potential for the effects of MS to wear off quickly for some participants. The results are to be analyzed looking at the change in MS score (i.e., delta SSQ) compared to the change of the six human performance scores (delta scores).
that are known to increase the likelihood of MS. When adhering to best practice guide-lines the 3xD simulator does not cause excessive MS. These best practices include lim-iting simulator exposure to around 15 minutes at a time, providing pre-cooled air vented into the drivers cabin (this was provided during the current study), completion of a familiarization run (also completed in this study), pre-screening participants for a pro-pensity for MS and avoiding complex junctions or higher speed tight sweeping bends. However, for this study we were specifically interested in the effect of MS on perfor-mance, hence a longer duration of scenario was developed (30 minutes) which in the final 10 minutes exposed participants to increasingly complex turns and junctions. A prescreening questionnaire was completed and those who indicated responses which might indicate a propensity for MS were not excluded, but given a written and verbal warning that they might experience MS and given the opportunity to withdraw. To counter the effects of extended simulator exposure and, as we are exposing people to a scenario which we know might increase the likelihood of MS, continuous monitoring (through FMS and visually) of the participant was completed to ensure welfare. This study was approved through The University of Warwick BSREC (REGO-2017-2090).
4. Results
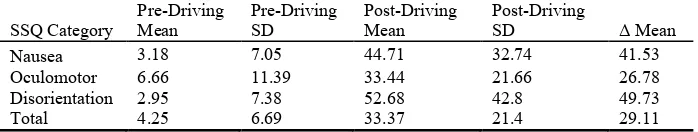
[image:7.595.125.474.516.582.2]51 participants took part in the user trial, including 27 males and 24 females. The min-imum participant age was 22 ± 4 years, with a maximum age of 49 ± 4 years, a mean age of 31 and a standard deviation of 10.13. 45% of participants ended the study early due to MS (N=23), including 26% of males (N=7) and 67% of females (N=16). These participants are referred to as ‘dropouts’. All dropouts still completed the post-driving SSQ and six tests. SSQ scores were collected and calculated to give a ‘total’ score and a score for the three subcategories (‘nausea’, ‘oculomotor’ and ‘disorientation’). An exploratory analysis was conducted (see Table 1), where scores were reported for ‘pre-driving (i.e., scores reported before the ‘pre-driving task) and ‘post-‘pre-driving’ (i.e., the scores reported directly after the driving task) including mean and standard deviation (SD):
Table 1 – Exploratory Analysis of the Subscales of the SSQ
Results indicated no gender effect on total post SSQ scores (F=2.046, p>0.05), although there was a significant gender effect on participant dropouts (F=11.411, p=0.001), as previously quantified. Considering the subcategories of the SSQ, there too was no gen-der effect on Oculomotor (F=0.356, p>0.05) or Disorientation (F=0.697, p>0.05) scores, however, there was a gender effect observed for Nausea scores (F=4.675, p<0.05) with females reporting higher Nausea. Similar findings were observed when looking at delta SSQ scores (i.e., change in SSQ scores). Results from the SSQ showed a significant difference in the mean scores for SSQ ‘total’, ‘nausea’ and ‘disorientation’
SSQ Category
Pre-Driving Mean
Pre-Driving SD
Post-Driving Mean
Post-Driving
between participants who completed the driving scenario and those who dropped out (Total F=14.135, p<0.001), (Nausea F=19.624, p<0.001) and (Disorientation F=15.556, p<0.001). However, ‘oculomotor’ mean scores between participants who completed the driving scenario and those who dropped out were non-significant (F=1.570, p>0.05). No age effect was observed on total post SSQ scores (F=0.539, p>0.05) with similar findings for the three subcategories also.
The two methods used to measure MS (SSQ and FMS) were found to have a signif-icant correlation when looking at participants who completed the driving task (n=28) (Pearson’s correlation = 0.620, p<0.001). Not all dropouts were able to give a final FMS score, so a correlation test for the total sample was not possible.
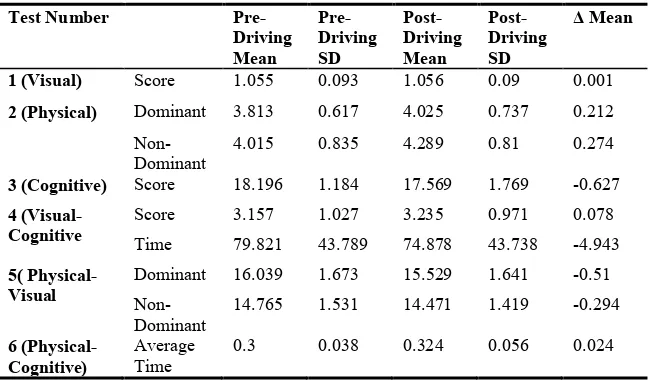
[image:8.595.126.451.330.521.2]An exploratory analysis of the six human performance tests (each denoted by a num-ber1-6) was conducted, again looking at the scores given ‘pre’ driving task and the scores recorded ‘post’ driving task (i.e., delta sores or ‘Δ’) where in tests 2 and 5 scores were taken for dominant and non-dominant hands independently (see Table 2 below).
Table 2 – Exploratory Analysis of Pre and Post Driving Results
Test Number
Pre-Driving Mean
Pre-Driving SD
Post-Driving Mean
Post-Driving SD
Δ Mean
1 (Visual) Score 1.055 0.093 1.056 0.09 0.001
2 (Physical) Dominant 3.813 0.617 4.025 0.737 0.212
Non-Dominant 4.015 0.835 4.289 0.81 0.274
3 (Cognitive) Score 18.196 1.184 17.569 1.769 -0.627
4 (Visual-Cognitive
Score 3.157 1.027 3.235 0.971 0.078 Time 79.821 43.789 74.878 43.738 -4.943
5( Physical-Visual
Dominant 16.039 1.673 15.529 1.641 -0.51
Non-Dominant 14.765 1.531 14.471 1.419 -0.294
6 (Physical-Cognitive)
Average
Time 0.3 0.038 0.324 0.056 0.024
Looking at delta mean scores, test 1 showed a positive change meaning an improved performance. Test 2 shows a positive change which relates to an increased time, indi-cating a poorer performance. Test 3 shows a negative score, which indicates a poorer performance. Test 4 shows an increased score and decreased time which indicates an improved performance in both areas. Test 5 shows decreased scores which indicates a poorer performance. Test 6 shows an increased time, and thus a poorer performance.
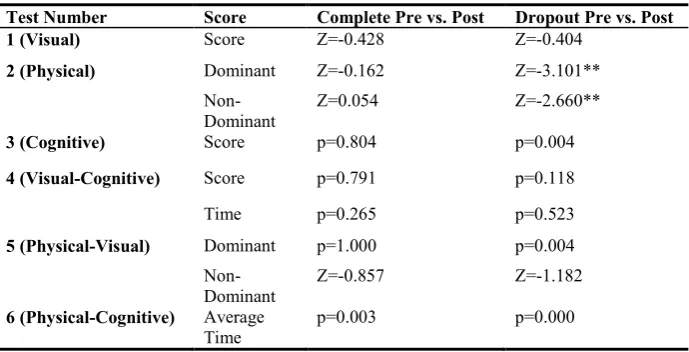
Table 3 – Analysis of Dropouts and Complete Scores (where ** indicates 99% confidence)
Test Number Score Complete Pre vs. Post Dropout Pre vs. Post
1 (Visual) Score Z=-0.428 Z=-0.404
2 (Physical) Dominant Z=-0.162 Z=-3.101**
Non- Dominant
Z=0.054 Z=-2.660**
3 (Cognitive) Score p=0.804 p=0.004
4 (Visual-Cognitive) Score p=0.791 p=0.118 Time p=0.265 p=0.523
5 (Physical-Visual) Dominant p=1.000 p=0.004 Non-
Dominant
Z=-0.857 Z=-1.182
6 (Physical-Cognitive) Average Time
p=0.003 p=0.000
5. Discussion
[image:9.595.127.472.169.345.2]Not all dropout participants were able to give a final FMS score, as some expressed a desire to exit the simulator immediately. All those who completed the driving task (N=28) were able to give a final FMS score however. Comparing this final FMS score to the SSQ total score, correlation was observed (r=0.620). This bodes well for the use of the FMS in future studies, in that it may be an effective way of tracking subjective MS in ‘real-time’. The creators of the FMS previously showed a Persons correlation of (r= 0.785), so it is beneficial for the continued use of this scale that this study has found a similarly positive result.
The main objective of this user trial was to see to what extent MS affects human performance. To analyse this the results were split into two groups – those who com-pleted the driving scenario (N=28) and those who dropped out (N=23). All those who dropped out cited MS as the sole reason for ending the study early, therefore we can assume those who dropped out were significantly affected by MS. We had to make the assumption therefore that those who completed the driving scenario were less affected by MS. Using these two groups it was possible to explore the data for differences in task completion score between those who were severely motion sick, compared to those who were not. Each area of performance has been broken down into the original sub-categories of human performance for exploration.
5.1 Discussion of Individual Tests
Test 1 – Visual Performance (LogMar Visual Acuity). No significant effect of MS
on visual performance was observed in this study (despite a small increase in delta scores, indicating improved overall scores), although lighting was a variable that could not be controlled and may have interfered with results. The lighting in the simulator was significantly darker than the lighting in the control room, where participants came from the darker simulator (where the participants are dark-adapted), into the brighter control room to take the visual acuity test. Anecdotally, a few participants noted they felt more ‘alert’ when coming back to the control room due to the change in lighting conditions. At this stage, it is not possible to make any conclusions on the effect of MS on visual acuity. It is recommended this area is explored again in a controlled study. Further, the visual acuity test only looks at one area of human performance, other measures such as depth perception would also be interesting to explore.
Test 2 – Physical Test (Card Turning). Looking at the group average change of all
Test 3 – Cognitive Test (N-Back). Looking at the group average change of all partic-ipants (pre to post driving) as given in Table 2, it is shown that people performed worse at the n-back test after the driving than before (on average) – as shown by a negative delta score, although this group difference was not significant. Table 3 however con-firms that indeed MS does have a significant effect on cognitive performance as drop-outs performed significantly worse on the cognitive test after driving than before. This confirms the previous findings that cognitive performance is affected by MS [6]. How-ever, there was no significant difference in the group of people who completed the driv-ing study, which confirms that the use of the drivdriv-ing simulator alone does not affect cognitive performance.
Test 4 – Visual Cognitive Test (Mental Rotation). This test revealed perhaps the most surprising results, where it was found that on average, after driving in the simulator people scored higher on the mental rotation test and completed the test quicker (as shown in Table 2). This indicated that the driving simulator (with or without MS) may improve spatial ability. However, there were no significant differences found in scores or times as indicated in Table 3. This is an area which should be explored further as this experiment could not isolate the impact of simulator exposure (and the potential to train spatial skills through use), and motion sickness.
Test 5 – Visual Physical Test (Perdue Pegboard). Table 2 shows an average decrease
in scores given by the Perdue Pegboard test for both dominant and non-dominant hands, interestingly however there does not appear to be a significant difference in pre to post scores in those who dropped out (i.e., those with the highest MS) in their non-dominant hand, although there is a significant difference in their dominant hand. This was some-what of a surprise to know that MS appears to affect the dominant hand and not the non-dominant hand. As the results in Table 3 show, people who used the simulator and did not drop-out had no significant affect to their scores – indicating that simulator use for non-motion sick participants has no direct effect on visual-physical skills.
Test 6 – Cognitive Physical test (Reaction Time). Table 2 indicates a small increase in time taken for the reaction speed test when looking at the entire group average. Look-ing then at Table 3 it is shown there is a significant difference for both groups in reaction time scores. The difference is greater for those who dropped out (i.e., were more motion sick), but it is interesting to find that use of a driving simulator regardless of MS state can alter cognitive-physical skills – in this instance reaction time.
6. Conclusion
The user trial provided some interesting results and for the first time it has been possible to consider how MS affects all areas of driver task completion. In this study, a simulator – and therefore simulation sickness was used as a type of MS so without further study of other types of MS, transferability cannot be assured. It was beneficial to note that there was minimal impact on performance for participants who completed the driving scenario (and therefore were less motion sick), where only the cognitive-physical test reported a significant negative effect. Other than that, simulator use did not seem to affect human performance in any other category; this finding can help validate simula-tor-based user trial results in that if participants are not strongly affected by MS their performance is not changed, so the trial results can be considered valid. A follow up study to consider why simulator use affected the cognitive-physical performance is rec-ommended. Given the uncontrollable variable of light/darkness adaptation, it is not pos-sible to conclude how MS affects visual performance. Otherwise, this research project has shown that MS significantly affects cognitive performance, physical performance, physical-visual performance and physical-cognitive performance. A further study to understand how the scale of the impact may change in accordance to the scale of MS severity is recommended. Other interesting findings included that the oculomotor sub-scale was the only SSQ measurement that had no effect on participant dropout and the category is perhaps less impactful on overall wellness. The finding that MS affected visual-physical performance only in the dominant hand is an interesting finding to con-sider for future HMI (human machine interface) design research.
References
[1] J. T. Reason and J. J. Brand, Motion Sickness, New York: NY: Academic Press, 1975.
[2] L. A. Warwick-Evans, N. Symons, T. Fitch and L. Burrows, "Evaluating Sensory Conflict and Postural Instability. Theories of Motion Sickness," Brain Research Bulletin, vol. 47, no. 5, pp. 465-469, 1998.
[3] T. A. Stoffregen, L. J. Hettinger, M. W. Hass, M. M. Roe and L. J. Smart, "Postrual Instability and Motion Sickness in a Fixed Base Flight Simulator," Human Factors: the Journal of the Human Factors and Ergonomics Society, vol. 42, no. 3, pp. 458-469, 2000.
[4] T. A. Stoffergen and L. J. Smart Jr., "Postural Instability Precedes Motion Sickness," Brain Research Bulletin, vol. 47, no. 5, pp. 437-448, 1998.
[5] S. A. Balk, M. A. Bertola and V. W. Inman, "Simulator Sickness Questionnaire: Twenty Years Later," in Driving Assessment Conference, 2013.
[6] J. E. Bos, "How Motions Make People Sick Such That They Perform Less: A Model Based Approach," in Symposium on Habitability of Compact and Transport Sehicles: Noise Vibration and Motion, Prague, Czech Republic, 2004.
[7] K. J. Stroud, D. l. Harm and D. M. Klaus , "Preflight Virtual Reality Training As A Countermeasure For Space Motion Sickness And Disorientation," Aviation, Space, and Environmental Medicine, vol. 76, no. 4, pp. 352-356, April 2005.
[9] K. M. Stanney,, R. S. Kennedy, J. M. Drexler and D. L. Harm, "Motion Sickness And Proprioceptive Aftereffects Following," Applied Ergonomics, vol. 30, pp. 27-38, 1999.
[10] J. Raad, "Rehab Measures: Jebsen Hand Function Test," 17 08 2012. [Online]. Available: http://www.rehabmeasures.org/Lists/RehabMeasures/DispForm.aspx?ID=1025.
[Accessed 03 10 2016].
[11] M. J. Kane, A. R. Conway, T. K. Miura and G. . J. Coleflesh, "Working Memory, Attention Control, and the N-Back Task: A Question of Construct Validity.," Journal of Experimental Psychology: Learning, Memory, and Cognition, vol. 33, no. 3, pp. 615-622, May 2007.
[12] M. Peters, B. Laeng, K. Latham, M. Jackson, R. Zaiyouna and C. Richardson, "A Redrawn Vandenberg and Kuse Mental Rotations Test: Differnt Version and Factors That Affect Performance," Brain and Cognition, vol. 28, pp. 39-58, 1995.
[13] J. Radd, "Rehab measures: Perdue Pegboard Test," 28 08 2014. [Online]. Available: http://www.rehabmeasures.org/Lists/RehabMeasures/DispForm.aspx?ID=1144.
[Accessed 03 10 2016].
[14] R. S. Kennedy, N. E. Lane, N. E. Berbaum and M. G. Lilienthal, "Simulator Sickness Questionnaire: An enhanced method for quantifying simulator sickness," International Journal of, pp. 203-220, 1993.
[15] The University of Warwick, WMG, "Drive-in, Driver-in-the-loop, multi-axis driving simulator (3xD)," 12 September 2016. [Online]. Available: https://warwick.ac.uk/fac/sci/wmg/research/naic/facilities/. [Accessed 20 Febuary 2018].
[16] B. Keshavarz and H. Hecht , "Validating an Efficient Method to Quantify Motion Sickness," Human Factors: The Journal of the Human Factors and Ergonomics Society ,
vol. 53 , pp. 415-426, 11 April 2011.
[17] E. Dov and Z. Yaakov, "Seasickness as a Self-Fulfilling Prophecy: Raising Self-Efficacy to boost Performance at Sea," Journal of Applied Psychology,, vol. 80, no. 5, pp. 628-635, 1995.
[18] B. Schouten, N. F. Troje, A. Brooks, R. Van Der Zwan and K. Verfaillie, "The facing bias in biological motion perception: Effects of stimulus gender and observer sex," Attention, Perception, & Psychophysics, vol. 72, no. 5, pp. 1256-1260, July 2010.
[19] D. W. Collins and D. Kimura, "A Large Sex Difference on a Two-Dimensional Mental Rotation Task," Behavioral Neuroscience, vol. 111, no. 4, pp. 845-849, 1997.
[20] J. F. Golding, "Motion Sickness Suceptibility," Autonomic Neuroscience, vol. 129, no. 1-2, pp. 67-76, 30 October 2006.
[21] M. Turner, "Motion Sickness in Public Road Transport: Passenger Behaviour and Susceptibility," Ergonomics, vol. 42, no. 3, pp. 444-461 , 1999.
[22] Oculus VR, "Oculus Rift Overview," 2017. [Online]. Available: https://www.oculus.com/rift/. [Accessed 24 07 2017].
[23] L. Warwick-Evans, N. Symons, T. Fitch and L. Burrows, "Evaluating Sensory Conflict and Postural Instability. Theories of Motion Sickness," Brain Research Bulletin, vol. 47, no. 5, pp. 465-469, 15 November 1998.
[24] J. L. Smart Jr and T. A. Stoffregen, "Postural Instability Precedes Motion Sickness," Brain Research Bulletin, vol. 47, no. 5, pp. 437-448, 1998.