© 2019, IRJET | Impact Factor value: 7.34 | ISO 9001:2008 Certified Journal
| Page 620
Disproportionate Collapse in Building Structure
Lingadevaru D C
1, Dr. Rajeeva S V
21
P.G. Student, Civil Engineering Department, Sri Jagadguru Balagangadharanatha Institute of Technology,
Bengaluru - 560060, Karnataka, India
2
Professor, Civil Engineering Department, Sri Jagadguru Balagangadharanatha Institute of Technology,
Bengaluru - 560060, Karnataka, India
---***---Abstract -
The progressive collapse of building structures isinitiated when one or more vertical load carrying members are removed. In the present dissertation work is carried out on reinforced concrete six story framed structure, to study the collapse , typical columns are removed one at a time and analyzed. Here many such columns are removed one at a time and the demand capacity ratio is evaluated as per general service administration (GSA) guidelines. The pushover curve and performance of the structure are studied using non-linear static analysis. Also estimate the different results such as story displacement, story shear, story drifts and ductility ratios for different cases of analysis are calculated. The DCR values for all the columns are safe after eliminating the critical column. The DCR values for the flexure and shear in beams are unsafe, since the values are exceeding 2. The story displacement is gradually increasing from lower story to higher story. Maximum story displacement is shown in model 2 (corner column removed) in both the directions. The story shear goes on decreasing from story 1 to story 6 in both the directions for all the cases of structure. The storydrifts increases as the story height increases up to certain story and then decreases for all the cases of structure in both the directions. Ductility ratio is maximum for the model without eliminating the column.
Key Words: Progressive Collapse, DCR ratio, GSA, ETABS,
Nonlinear static Analysis.
1. INTRODUCTION
The progressive collapse is a consequence of a local failure of a structural component that leads to the entire failure of the structure or to a significant part of it. The term “Progressive collapse” is described as the condition where load failure of the major structural component leading to the failure of the adjacent members, which in turn leads to additional collapse. Progressive collapse is also known as disproportionate collapse. The failure of a primary vertical support might occur due to extreme loadings such as bomb explosion in a terrorist attack, gas explosion and huge impact of a car in the parking area.
The robustness of the structure is the ability of the structure to withstand local damages that may arise due events like fire, explosions, impact or the consequences of human error, without being damaged to an extent disproportionate to the original cause.
In general, buildings are designed to resist the normal anticipated loads like gravity, occupancy, wind and seismic. However, some structures occasionally are being exposed to unforeseen loads due to natural, man-made, intentional or unintentional reasons. These unexpected loads induce progressive collapse event.
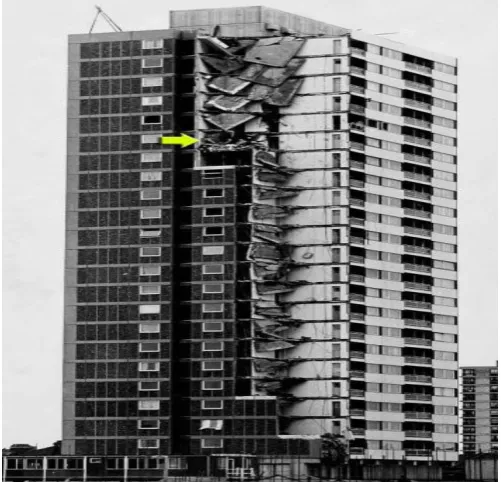
[image:1.595.308.559.487.728.2]The collapse of the Ronan Point apartment could be considered as the first well-known and the most publicized example of progressive collapse. The Ronan Point tower was a multi-story residential building consisted of 22 stories located in Newham, East London, United Kingdom constructed between July, 1966 and March, 1968. The overall dimensions of the plan were 24.4m by 18.3m and the total height of the apartment was 64m. It was easy to be built since the structural flat plate floor system contained precast concrete for the walls, floors and staircases. The walls and floors were bolted together and the connections were filled with dry packed mortar. This means that the floors did not have a high potential to withstand bending, especially if over hanged, so that each floor was supported directly by the walls in the lower story.
© 2019, IRJET | Impact Factor value: 7.34 | ISO 9001:2008 Certified Journal
| Page 621
1.1
GSA Guidelines
General Service Administration (GSA) investigation includes elimination of one column at a point in time from the story 1 above the ground floor. GSA provides criterion for column removal for static analysis case. According to that a column is removed below for representative structures.
1. Corner column of the building.
2. Outer middle column of the building in longer direction.
3. Outer middle column of the building in shorter direction.
4. Interior (Centre) column of the building.
1.2
Objectives
1. To evaluate the progressive collapse potential of an existing Reinforced Concrete structure using Non-linear static analysis.
2. To assess the Demand Capacity Ratios for flexure, shear and axial forces of the member forces. 3. To study the Pushover Curve and its Performance
point.
4. To estimate the different results such as story displacement, story shear and story drifts from the pushover analysis.
1.3
Methodology
1. ETABS software is used for the modelling & analysis of the structure.
2. Non-linear static analysis is carried out as per General Service Administration (GSA) guidelines. 3. The sudden column loss technique will be used for
simulating the abnormal loading event that causes localized structural failure
4. The demand capacity ratio for flexure, shear and axial forces at all storeys is calculated for different cases of column failure.
5. Story displacement, story shear, story drifts and the ductility ratio are estimated from the pushover analysis.
2. MODELING OF STRUCTURE
A typical six storey reinforced concrete framed structure is considered for the study. Typical floor height is 3.2 m and it is 1.5m for the bottom story.
Table -1: General building details considered
Number of story’s G+5
Building type RC framed
Seismic Zone Zone V
Soil type Medium soil (type 2)
Story height 3.2
Response reduction factor 3
Importance factor 1
Table -2: Structural members of buildings
Thickness of slab 125mm
Beam size 300X450mm
Column size 300X450mm
Table -3: Material properties of building
Grade of concrete M30
Grade of steel Fe415
Density of concrete 25 kN/m³
Young’s modulus of concrete 273386.13 MPa
[image:2.595.310.560.433.734.2]Poisons ratio of concrete 0.2
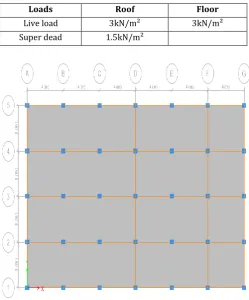
Table -4: Assumed load intensities
Loads Roof Floor
Live load 3kN/m² 3kN/m²
Super dead 1.5kN/m²
© 2019, IRJET | Impact Factor value: 7.34 | ISO 9001:2008 Certified Journal
| Page 622
Fig -3: 3D view of building considered2.1 Analysis of structure
Nonlinear static analysis is carried out as per General Service Administration (GSA) guidelines. A nonlinear analysis is an analysis where a nonlinear relation holds between applied forces and displacements. Incremental application of loads until the maximum loads attained. Gravity loads are not applied in one step. Nonlinear static analysis is also known as pushover analysis.
The sudden column loss technique will be used for simulating the abnormal loading event that causes localized structural failure, and which could give rise to progressive collapse. The building considered for the study is an existing 6 storey reinforced concrete framed structure serving the purpose of residential quarters. Linear and non-linear static analysis is carried out using ETABS 16 conferring to the U.S. General Services Administration (GSA) guidelines.
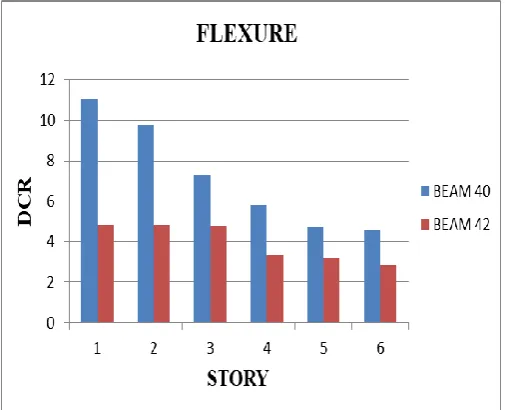
Demand capacity ratio for flexture at all storeys is calculated for different cases of column failure. The columns 35, 32, 21and 18 are eliminated one at a time and evaluated. From the analysis results, the demand at critical positions is obtained and from the original seismically designed section the capacity of the member is determined. The DCR in each structural member is carried out. If the DCR of the member go beyond the acceptance conditions, the member isconsidered failed. The DCR value is calculated for flexture, axial and shear is calculated.
2.2 Analysis Loading
For static analysis purposes the following vertical load shall be applied downward to the structure under investigation: Load = 2(DL + 0.25LL)
Where,
DL = dead load and LL = live load
2.2 Acceptance Criteria
Acceptance criteria for the primary and secondary structural components shall be determined as:
DCR = QUD/QCE
QUD = Acting force (demand) determined in component or connection/joint (moment, axial force, shear, and possible combined forces)
QCE = Expected ultimate, un-factored capacity of the component and/or connection/joint (moment, axial force, shear and possible combined forces)
Using the DCR criteria of the linear elastic approach, structural elements and connections that have DCR values that exceed the following allowable values are considered to be severely damaged or collapsed.
The allowable DCR values for major and minor structural components are:
DCR < 2.0 for typical structural arrangements DCR < 1.5 for atypical structural arrangements
3. RESULTS
3.1 Demand - Capacity Ratio
After getting all the DCR values for all cases of column removal, for all cases graph is plotted DCR vs Story’s
[image:3.595.308.561.477.682.2]© 2019, IRJET | Impact Factor value: 7.34 | ISO 9001:2008 Certified Journal
| Page 623
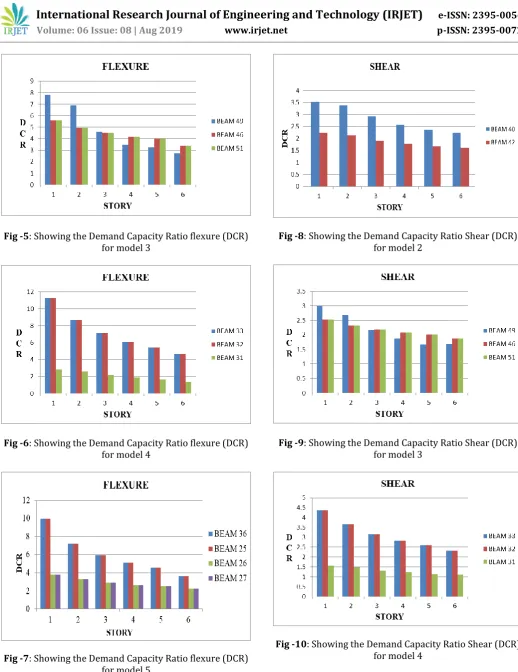
Fig -5: Showing the Demand Capacity Ratio flexure (DCR) [image:4.595.35.554.41.714.2]for model 3
Fig -6: Showing the Demand Capacity Ratio flexure (DCR) for model 4
[image:4.595.34.567.47.264.2]Fig -7: Showing the Demand Capacity Ratio flexure (DCR) for model 5
Fig -8: Showing the Demand Capacity Ratio Shear (DCR) for model 2
Fig -9: Showing the Demand Capacity Ratio Shear (DCR) for model 3
© 2019, IRJET | Impact Factor value: 7.34 | ISO 9001:2008 Certified Journal
| Page 624
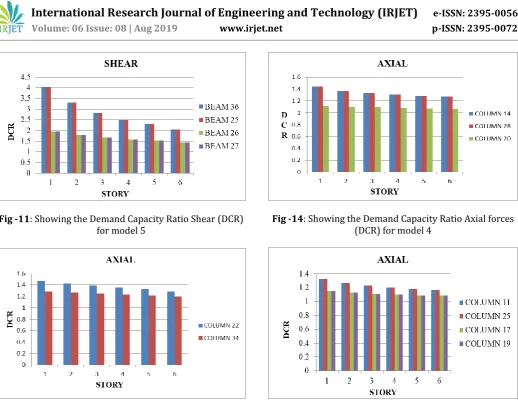
Fig -11: Showing the Demand Capacity Ratio Shear (DCR)for model 5
[image:5.595.37.562.47.249.2]Fig -12: Showing the Demand Capacity Ratio Axial forces (DCR) for model 2
Fig -13: Showing the Demand Capacity Ratio Axial forces (DCR) for model 3
[image:5.595.35.285.487.641.2]Fig -14: Showing the Demand Capacity Ratio Axial forces (DCR) for model 4
Fig -15: Showing the Demand Capacity Ratio Axial forces (DCR) for model 5
3.2 Pushover Curves
[image:5.595.309.562.511.671.2]© 2019, IRJET | Impact Factor value: 7.34 | ISO 9001:2008 Certified Journal
| Page 625
Fig -17: Showing the performance point along X directionfor model 2
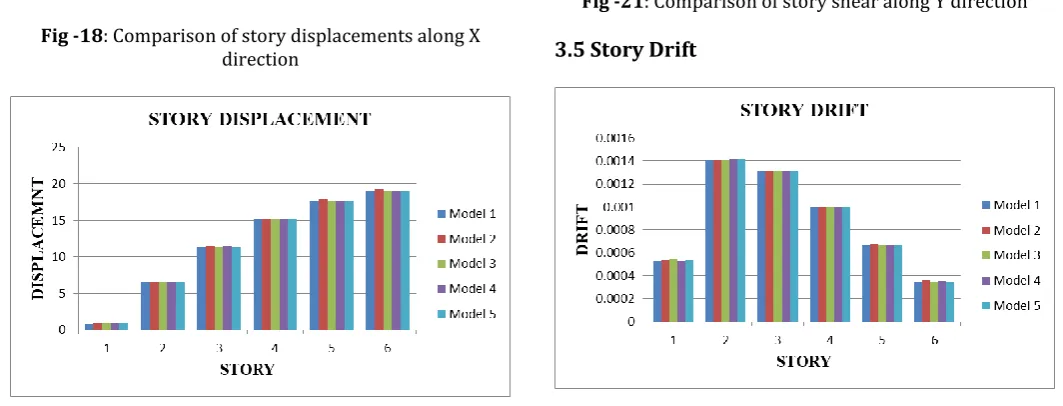
[image:6.595.39.536.46.259.2]3.3 Story displacement
Fig -18: Comparison of story displacements along X direction
Fig -19: Comparison of story displacements along Y direction
[image:6.595.308.561.306.458.2]3.4 Story shear
Fig -20: Comparison of story shear along X direction
Fig -21: Comparison of story shear along Y direction
3.5 Story Drift
[image:6.595.34.293.317.475.2] [image:6.595.31.563.478.681.2]© 2019, IRJET | Impact Factor value: 7.34 | ISO 9001:2008 Certified Journal
| Page 626
Fig -23: Comparison story drift along Y direction4. CONCLUSIONS
1. The DCR values are not within limits for flexure and in shear for column removed from corner of the building (C35), whereas the beams fails in flexure and shear for removal of outer middle column in longer and shorter direction of the building (C32&C21) and also for the removal of centre column of building (C18). The DCR values in axial are safe for the condition of middle, corner and Centre columns removed.
2. The performance point is found and pushover curve is plotted for displacement and base shear for different column removal conditions in X direction. 3. The story displacement is gradually increasing from
lower story to higher story. Maximum story displacement is shown in model 2 (corner column removed) in both the directions.
4.
The story shear goes on decreasing from story 1 to story 6 for all the models in both the directions. Maximum story shear was shownin
model 1 (without removal of column) when compared with all the other models.5. The story drifts increases as the story height increases up to certain story and then decreases for all the cases of structure in both the directions. Story drift is slightly high in Y direction compare to X direction.
REFERENCES
[1] Rakshith K G and Radhakrishna (2013),“Progressive
collapse analysis of reinforced concrete framed structure”, IJRET: International Journal of Research in Engineering and Technology ISSN: 2319-1163,PP:36-40.
[2] Raghavendra C and Mr. Pradeep A R (2014),“Progressive
Collapse Analysis of Reinforced Concrete Framed Structure”, ISSN 2348-7607 (Online) Vol. 2, Issue 1, PP:143-149.
[3] Syed Asaad Mohiuddin Bukhari, Shivaraju G D and Ashfaque Ahmed Khan (2015), “Analysis of progressive
collapse in RC frame structure for different seismic zones”, International Journal of Engineering Sciences & Research Technology, ISSN: 2277-9655,PP:699-707.
[4] Pavithra B.R and Manjula K (2016),“Comparative
Analysis of RC Structures Progressive Collapse for Different Seismic Zones”, IJEDR | Volume 4, Issue 2 | ISSN: 2321-9939,PP:1530-1535.
[5] Mir Sana Fatema and Prof. A.A. Hamane (2016), “Progressive Collapse of Reinforced Concrete Building”, IOSR Journal of Mechanical and Civil Engineering (IOSR-JMCE) e-ISSN: 2278-1684,p-ISSN: 2320-334X, Volume 13, Issue 6 Ver. III PP: 44-52.
[6] Sonu Mangla, Dr. Shailendra Kumar Tiwary, Rishabh Sharma and Mohd. Tauseef Husain(2018),“Progressive Collapse Behaviour of Reinforced Concrete Building Based on Non-Linear Static Analysis”, International Research Journal of Engineering and Technology (IRJET), volume: 05 Issue: 05,PP: 2999-3002
.
[7] Yash Jain and Dr. V.D. Patil (2018),“Assessment of Progressive Collapse for a Multi-Storey RC Framed Structure using Linear Static Analysis Technique”, International Journal of Engineering Trends and Technology (IJETT) – Volume 60,PP:192-198.
[8] IS 456: 2000, “Indian Standard Code for Plain and Reinforced Concrete”, Bureau of Indian Standards, New Delhi.
[9] IS 875(part 1): 1987, “Indian Standard Code of practice
for design loads (other than Earthquake for building and structures): Dead loads, Bureau of Indian Standards, New Delhi.
[10] IS 1893(Part 1):2002, “Indian Standard Criteria for Earthquake Resistance Design of Structures”, New Delhi, India.
[11] General Services Administration (GSA),“Progressive