PERFORMANCE PARAMETERS STUDY OF BI
DYNAMOMETER TESTS
*Sameh M. Metwalley, Shawki A. Abouel
Faculty of Engineering, Helwan University,Cairo, Egypt
ARTICLE INFO ABSTRACT
Concerns regarding global climate change have caused the transportation sector to look for alternatives to petroleum as a fuel for vehicles of all types. Bi
being particularly efficient for urban traffic use. As these vehicles become more popular, there is a need for accurate vehicle performance test metho
measurements would be obtained by using single axis dynamometers. In this paper, a research work was intended to study the performance characteristics of a bi
compressed natu
vehicle performance. The performance test procedure was carried out on a newly registered gasoline/CNG bi
European standard driving cycle. The European driving cycle shows the characteristics of vehicles operating conditions for various speeds and acceleration ranges, but does not represent realistic speed-time history of a vehicle in actual traffic. As the drivin
assessment results using this driving cycle may not produce realistic results. The fuel injection system used is Multi
significant information c obtained.
INTRODUCTION
Energy efficiency evaluation of hybrid electric vehicles (HEVs) is important to classify the vehicles by efficiency performance or to confirm the efficiency level to clear the certain level such as the threshold level for green tax. Basic fuel consumption test method for HEVs has been established as ISO standards (ISO 23274). In the last few years, 4WD HEVs have been developed and are becoming popular among heavy weight passenger vehicles such as SUVs. As for the vehicles in this category, HEVs with an electric 4
system should be accepted due to its high efficiency and high traction performance on the low coefficient of adhesion (µ) roads. Basically, a fuel consumption test of 4WD HEVs should be conducted on double axes chassis dynamometer. But, single axis chassis dynamometers are commonly used for the test, due to the two main problems lying on double axes chassis dynamometer application. First problem is high cost and non popularity of double axes chassis dynamometer. It is common to evaluate 4WD ICEVs on a sing dynamometer by modifying the 4WD system to 2WD system. The second one is the difficulty in double axes chassis dynamometer applications. Although double axes chassis dynamometer has various factors that generate load or mechanical loss errors anew, no clear method is determined for the test on the double axes chassis dynamometer.
*Corresponding author: [email protected]
ISSN:
0975-833X
International Journal of Current Research Vol.
Article History:
Received 1st
February, 2011 Received in revised form 5th
March, 2011 Accepted 9th
May, 2011 Published online 2nd
June 2011 Key Words: Gasoline, CNG, Performance, Bi-fuel vehicle, Driving Cycles,
Multi-point injection system, Chassis Dynamometer.
RESEARCH ARTICLE
PERFORMANCE PARAMETERS STUDY OF BI-FUEL VEHICLE USING CHASSIS
DYNAMOMETER TESTS
Sameh M. Metwalley, Shawki A. Abouel-seoud and Abdelfattah M.
Faculty of Engineering, Helwan University,Cairo, Egypt
ABSTRACT
Concerns regarding global climate change have caused the transportation sector to look for alternatives to petroleum as a fuel for vehicles of all types. Bi-fuel vehicles have been recognized as being particularly efficient for urban traffic use. As these vehicles become more popular, there is a need for accurate vehicle performance test methods. Clearly the most accurate vehicle performance measurements would be obtained by using single axis dynamometers. In this paper, a research work was intended to study the performance characteristics of a bi-fuel vehicle, i.e. gasoline and compressed natural gas (CNG). Single axis dynamometers are commonly used for evaluating vehicle performance. The performance test procedure was carried out on a newly registered gasoline/CNG bi-fuel vehicle in Egypt market (Hyundai-star) and is now assessed from the pean standard driving cycle. The European driving cycle shows the characteristics of vehicles operating conditions for various speeds and acceleration ranges, but does not represent realistic time history of a vehicle in actual traffic. As the driving conditions are different, the assessment results using this driving cycle may not produce realistic results. The fuel injection system used is Multi-point (MP)-sequential injection. From the experimental results, it is seen that significant information can be for the bi-vehicle technology, consequently better design can be obtained.
© Copy Right, IJCR, 2011 Academic Journals
evaluation of hybrid electric vehicles (HEVs) is important to classify the vehicles by efficiency performance or to confirm the efficiency level to clear the certain level such as the threshold level for green tax. Basic Vs has been established as ISO standards (ISO 23274). In the last few years, 4WD HEVs have been developed and are becoming popular among heavy weight passenger vehicles such as SUVs. As for the vehicles in this category, HEVs with an electric 4-wheel drive system should be accepted due to its high efficiency and high traction performance on the low coefficient of adhesion (µ) Basically, a fuel consumption test of 4WD HEVs should be conducted on double axes chassis dynamometer. s dynamometers are commonly used for the test, due to the two main problems lying on double axes chassis dynamometer application. First problem is high cost and non popularity of double axes chassis dynamometer. It is common to evaluate 4WD ICEVs on a single axis dynamometer by modifying the 4WD system to 2WD system. The second one is the difficulty in double axes chassis dynamometer applications. Although double axes chassis dynamometer has various factors that generate load or no clear method is determined for the test on the double axes chassis dynamometer.
Because of high efficiency of HEVs resultant fuel consumption of the test is deeply affected by these load or loss errors generated in the test. So, the newly generated errors are very huge problems for fuel consumption test of HEVs. The above mentioned two problems were discussed: The first one is on the method to confirm the validity of the test result of 4WD HEV obtained on single axis chassis dynamometer (the HEV is modified to 2WD condition). It is proposed simple test method to check if the result
dynamometer is equal to the one on double axes chassis dynamometer or not. As this test can be conducted on a proving ground (no double axes chassis dynamometer is required) only by measuring battery current history (no fuel consumption (Shimizu et al., 2008; Shimizu
Automotive engine power and torque are significantly affected with effective tune-up. Current practice of vehicle engine tune-up relies on the experience of the automotive engineer. The vehicle engine tune-up is usually done by trial and-error method, and then the vehicle is run on the dynamometer to show the actual its engine output power and torque. Obviously the current practice costs a large amount of time and money, and may even fail to tune up t
engine optimally because a formal power & torque function of the engine has not been determined yet. With an emerging technique, Least Squares Support Vector Machines (LS SVM), the approximate power and torque functions of a
ternational Journal of Current Research Vol. 33, Issue, 6, pp.145-150, June, 2011
INTERNATIONAL
OF CURRENT RESEARCH
FUEL VEHICLE USING CHASSIS
Farahat
Concerns regarding global climate change have caused the transportation sector to look for fuel vehicles have been recognized as being particularly efficient for urban traffic use. As these vehicles become more popular, there is a ds. Clearly the most accurate vehicle performance measurements would be obtained by using single axis dynamometers. In this paper, a research work fuel vehicle, i.e. gasoline and ral gas (CNG). Single axis dynamometers are commonly used for evaluating vehicle performance. The performance test procedure was carried out on a newly registered star) and is now assessed from the pean standard driving cycle. The European driving cycle shows the characteristics of vehicles operating conditions for various speeds and acceleration ranges, but does not represent realistic g conditions are different, the assessment results using this driving cycle may not produce realistic results. The fuel injection sequential injection. From the experimental results, it is seen that vehicle technology, consequently better design can be
© Copy Right, IJCR, 2011 Academic Journals. All rights reserved
Because of high efficiency of HEVs resultant fuel consumption of the test is deeply affected by these load or loss errors generated in the test. So, the newly generated errors are very huge problems for fuel consumption test of HEVs. d two problems were discussed: The first one is on the method to confirm the validity of the test result of 4WD HEV obtained on single axis chassis dynamometer (the HEV is modified to 2WD condition). It is proposed simple test method to check if the result on single axis chassis dynamometer is equal to the one on double axes chassis dynamometer or not. As this test can be conducted on a proving ground (no double axes chassis dynamometer is required) only by measuring battery current history (no fuel
Shimizu et al., 1982).
Automotive engine power and torque are significantly up. Current practice of vehicle up relies on the experience of the automotive up is usually done by trial-error method, and then the vehicle is run on the dynamometer to show the actual its engine output power and torque. Obviously the current practice costs a large amount of time and money, and may even fail to tune up the vehicle engine optimally because a formal power & torque function of the engine has not been determined yet. With an emerging technique, Least Squares Support Vector Machines (LS-SVM), the approximate power and torque functions of a
vehicle engine can be determined by training the sample data acquired from the dynamometer. The number of dynamometer tests for a vehicle engine tune-up can therefore be reduced because the estimated vehicle engine power and torque functions can replace the dynamometer tests to a certain extent. Besides, Bayesian framework is also applied to infer the hyper-parameters used in LS-SVM so as to eliminate the work of cross-validation, and this leads to a significant reduction in training time. However, the construction, validation and accuracy of the functions were discussed. These study show that the predicted results are good agreement with the actual test results. To illustrate the significance of the LS-SVM methodology, the results were also compared with that regressed using a multilayer feed forward neural networks (Vong et al., 2006; Su et al., 2002).
Today’s automobile industry places improvement of low energy consumption, emissions and performance as one of the primary areas for progress. In context of the Kyoto Protocol, the significance of improvement in these areas is evident. The consequence of more stringent performance testing procedures is that there is increased pressure on vehicle testing facilities. Optimizing the productivity of these test facilities is, therefore, important. Two types of dynamometers are used for automotive testing applications: engine dynamometers and vehicle (or chassis) dynamometers. As the name suggests, the former type measures solely the engine characteristics and requires the engine to be removed from the vehicle to enable testing. The latter type (chassis dynamometers), where the driving wheels of the test vehicle are placed on a set of rollers. This method allows the real driving characteristics of the vehicle to be tested while maintaining a static position. Current methods of vehicle dynamometer emission testing require trained and qualified personnel to undertake prolonged periods of repetitive test cycles. Deviations caused by human error result in inconsistent measurements and require averaging of results over multiple tests. In the case of large deviation exceeding the speed tolerances, results are rendered useless, requiring further tests. Typical speed tolerances are ±3 km/h; this varies depending on the testing standard followed. Both the American Industry/Government Emissions Research (AIGER) and German car manufacturers state the merit of reducing variability emission testing by introducing robotic drivers. The accuracy of a robotic driver ensures the delivery of repeatable results; only single test runs are required, cutting the time of the testing procedure. Simultaneously this liberates the test driver from the menial testing process in a noisy and uncomfortable environment. Thus the time of personnel can be applied to more meaningful and effective work. Such a robot must be able to be retrofitted in the widest possible range of vehicles so that a single robot can perform tests on multiple vehicles consecutively. To achieve automated vehicle dynamometer testing the following objectives are set:
Follow chosen standard drive cycles to a degree where it will consistently produce results that do not invalidate the drive cycle standards.
Produce repeatable results allowing comparisonbetween specific vehicles and models. Function on a variety of vehicles (Namik et al., 2008; Chang Tuand Chang Tu, 2004)
The basic braking devices used by mechanical braking systems are wheel-tread brakes, axle-mounted disc brakes, and
wheel-mounted disc brakes. Generally high speed trains cannot use the wheel-tread brake system because it would damage the wheel tread except in emergency situations. Comparative studies of the wheel tread brake with composite brake blocks between under conditions with dry and wet and braking/traction control systems using the dynamometer tests for the high speed trains. Generally, brake system of railway vehicles has a crucial role for the safety as well as riding quality of passengers. And brake dynamometers are widely used to evaluate the performance of brake systems and test the brake parts under various environments (weight, velocity, brake force, wet-dry conditions). Especially, in the process of the brake stops, the friction coefficients between under dry and wet conditions must not deviate from each other by more than 15% under the same testing conditions. Experiments on the brake dynamometer for the high speed trains are shown to illustrate the comparative studies of the tread brake of dynamometer tests between under dry and wet conditions with initial vehicle speed at 200 [km/h] and 80 [km/h] considering the 920 [mm] wheel diameter, respectively (Kim and Hur, 2009; Kim, 2011).
In this paper, a research work was intended to study the performance parameters characteristics of a bi-fuel vehicle, i.e. gasoline and compressed natural gas (CNG). Single axis dynamometers are commonly used for evaluating vehicle performance. The performance test procedure was carried out on a newly registered gasoline/CNG bi-fuel vehicle in Egypt market (Hyundai-star) based on European standard driving cycle.
Dynamotor Facility
Performance comparisons are made on a flow SAXON chassis dynamometer in steady-state mode located in the Faculty of Engineering, Helwan University The SAXON, a passenger vehicle Chassis Dynamometer, allows operation of a wide range of power and speed modes and performs a critical role in testing equipment for this research. Fig. 1 presents a rendering of the chassis dynamometer and experimental equipment used during testing. The SAXON is capable of absorbing 550 horsepower from 460 mm diameter roll at a maximum test speed of 80 mph (Kim, 2011). Load is controlled during testing by a pneumatic valve that controls water flow into a water break absorber attached to the roll. A handheld controller can be set to monitor and change the water flow based on a variety of control parameters including wheel speed and percent flow. The dynamometer is installed in the Laboratory in a sub floor configuration. Steel plates covering the rolls and wheel channels must be removed and safely stored using a forklift before a vehicle can be loaded on the rolls. With the SAXON system power on, the vehicle chassis is centered and backed onto the rolls. The rolls must be in the locked configuration on the handheld controller to prevent them from spinning and ensure proper chassis alignment. In the final testing configuration, the wheels are located forward of the center of the rolls. The following three steps outline the procedure to obtain proper chassis positioning.
1. Back the vehicle onto the rolls such that the tire centers and roll centers are vertically aligned.
a strength and safety standpoint but also to minimize vibration during operation). Avoid crushing the brake lines that run on the axle housing when the chain becomes tight.
3. With approximately 300 mm of slack in the attached chain, allow the vehicle to roll forward until the rear tires stop forward of roll centers but clear of the floor with the chain taught.
Operation and preparation of the chassis dynamometer should only be performed with two or more persons present. The following checklist should be observed before running the vehicle for safety and quality of testing.
Front tire ratchet straps and the rear differential mount chain are securely attached and tightly bound.
Dynamometer rolls are clear of tools, equipment, hoses and cables, or anything that could become caught during operation.
Exhaust ducting is attached to tailpipe and exhaust fan is on.
Patton Industrial fan is positioned in front of vehicle to pull fresh air from open bay door and cool radiator.
Once the vehicle’s front tires are secured to the floor, avoid turning the steering wheel to prevent loosening the ratchet straps. Secondly, when the rolls are spinning, avoid touching the brake pedal or locking the rolls with the handheld controller until they have came to a complete stop.
EXPERIMENTAL SETUP
Bi- Fuel Vehicles
All vehicles examined in this study have been certified according to Euro-4 regulations. They are series production vehicles currently in use by different owners. All vehicles were less than seven years old and had mileage lower than 100,000 km. All the vehicles have been thoroughly checked for possible technical defects prior to the measurements. However, in this paper, the experimental work was carried out on specified vehicle to avoid vehicle-to-vehicle variation which results from different designs, operating conditions and
maintenance processes. According to the previously
mentioned plan of study, the on-road test mode is employed in
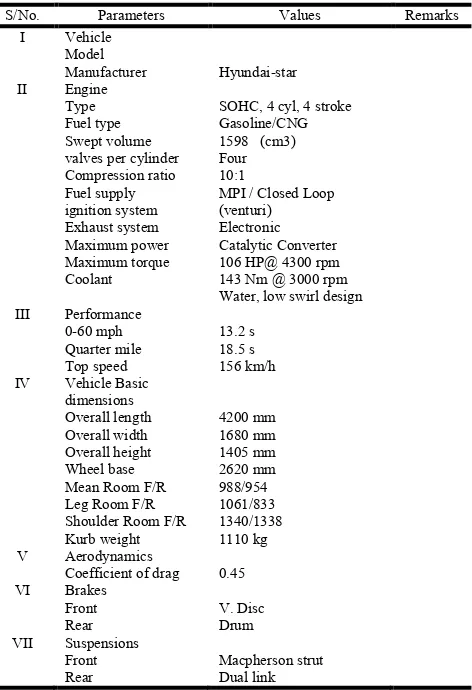
[image:3.612.156.465.58.192.2]the present experimental work. The fuel injection system used in this work is multi-point sequential. The vehicle used in the present study is selected to represent statistically the average of manufacturing year for most vehicles in Egypt during the period of study. The vehicle is Verna-star, 1600 cc. The engine is spark ignited four strokes, four cylinders in-line and water cooled. It is transversally mounted with front wheel drive technique. The vehicle is equipped with manually operated gear box mounted transversally and sharing the same oil sump of the engine. The gear box offers 4 forward speeds and single reversal speed. The technical data for the vehicle used are tabulated in Table 1.
Table 1. Technical data for vehicle used in the present experimental study
S/No. Parameters Values Remarks
I Vehicle
Model
Manufacturer Hyundai-star
II Engine
Type Fuel type Swept volume valves per cylinder Compression ratio Fuel supply ignition system Exhaust system Maximum power Maximum torque Coolant
SOHC, 4 cyl, 4 stroke Gasoline/CNG 1598 (cm3) Four 10:1
MPI / Closed Loop (venturi) Electronic Catalytic Converter 106 HP@ 4300 rpm 143 Nm @ 3000 rpm Water, low swirl design III Performance
0-60 mph Quarter mile Top speed
13.2 s 18.5 s 156 km/h IV Vehicle Basic
dimensions Overall length Overall width Overall height Wheel base Mean Room F/R Leg Room F/R Shoulder Room F/R Kurb weight
4200 mm 1680 mm 1405 mm 2620 mm 988/954 1061/833 1340/1338 1110 kg
V Aerodynamics
Coefficient of drag 0.45
VI Brakes
Front Rear
V. Disc Drum VII Suspensions
Front Rear
[image:3.612.314.550.390.735.2]Macpherson strut Dual link
European Driving Cycle (ECE-15)
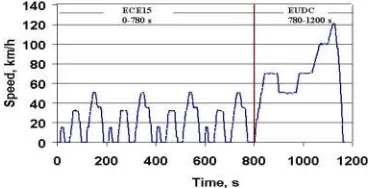
The experiments were conducted with commercial fuel (sulphur content less than 10 ppm) with the installed lubricating oil filter and commercial lubricating oil. The tests using the European driving cycle (Fig. 2) were started with cold engine after vehicle conditioning at 23 °C. There, the lubricating oil temperature was increased to a minimum of 80 °C by conditioning the vehicle on the chassis dynamometer prior to these tests. The investigation included one market-available bi-vehicle mentioned previously powered by gasoline or compressed natural gas (CNG). Its displacement is 1.6 l. In order to investigate the amounts of exhausted gas emissions and fuel consumption rates of vehicles traveling in Egypt, a generic driving characteristic or The driving cycle used for the assessment of the performance of newly registered automobile in Egypt is based upon the standard driving cycle of the European Community (called ECE-15 cycle) where the driving conditions are not the same. Furthermore, it is modal driving cycle which derived from various representative constant acceleration and speed driving modes contrast to the cycle that constructed from the real micro trips obtained from actual on-road driving data such as the US75 cycle and Melbourne peak cycle.
The European test driving cycle is based on Euro III and it is presented in Fig. 2. The driving cycle consists of two parts, ECE15 and EUDC, that correspond to urban and highway (extra-urban) driving conditions in that order. ECE15 test cycle simulates a 4.052 km urban trip at an average speed of 18.7 km/h and at a maximum speed of 60 km/h. Its duration is 780 seconds. The same part of the ECE15 driving cycle is repeated four times to obtain an adequate driving distance and temperature. The EUDC cycle instead illustrates the aggressive, high speed driving at a maximum speed of 120 km/h. Its duration is 400 seconds and 6.955 km at an average speed of 62.6 km/h.
RESULTS AND DISCUSSION
The vehicle engine is kept in its original configuration to be used as a bi-fuel engine. The CNG systems used for bi-fuel converted vehicles are adopted to be seamlessly switchable between gasoline and CNG, thus providing lower power and an excellent derivability to deliver CNG into the engine for clean and efficient operation.
Steady-State Mode
Figures 3 and 4 depict the relationship between vehicle engine power and torque and the vehicle engine speed when injected
by gasoline and CNG fuel – multi-point respectively. It is clearly seen that the engine torque increases as the vehicle engine speed increased up to 2750 rpm, where the maximum torque exists about 82 Nm for gasoline and about 78 Nm for CNG, and then decreased as the vehicle engine speed increased due to the occurrence of the mechanical losses. The same observation can be noticed for the corresponding vehicle engine power which reaches 31 kW for gasoline and 28 kW for CNG. Low engine power and torque for CNG fuel are affecting by the following factors:
i. Loses in volumetric efficiency, the power loss could be partly explained by the low density of natural gas. Because gaseous fuel occupies a larger volume per unit energy than a liquid fuel. The natural gas in the
mixture drawn into the cylinder displaces
approximately 8 to 10% of oxygen available for combustion. In other words, CNG in its gaseous state, decreases volumetric efficiency by the same amount and consequently reducing torque and power. ii. Low flame speed Natural gas, which has a very low
flame speed, which is much lower than gasoline. This affects the total combustion duration prolonged compared with gasoline. With the conventional valve timing setting for liquid fuel engines, it would be impossible for CNG operation to complete the whole combustion before the exhaust valve opens, even if the gas mixture was ignited earlier.
iii. Low compression ratio (CR), Current gas engine practice is mainly limited to simple conversion from gasoline engines. For gasoline engine, the CR is in the range of 8:1 to 9.5:1. On the other hand, the CNG with higher octane rating allows engine CR increase up to 15:1. Increasing the CR would partially increase ideal efficiency and the power output. Heywood (Su
et al., 2002) states,” For the important compression
ratio range of 9 to 11 the relative efficiency improvement is between 1-3% per unit compression ratio increase, depending on cylinder size and operating conditions.”
iv. Absence of fuel evaporation, when gasoline
evaporates (required before combustion), the energy required for the phase change decrease intake charge temperature and air partial pressure. The decrease in temperature offsets the decrease in air partial pressure and results in a positive increase to volumetric efficiency of about 2%. CNG does not evaporate before combustion, losing any potential gain from the heat vaporization. However, in this work, the average power and torque loss of CNG compared to gasoline is in the range of 3 to 19.7% and 1.6 to 21.6%, respectively.
Transient-state Mode
[image:4.612.91.275.339.433.2]Figures 5 and 6 depict the Hyundai-star 1600 cc vehicle road performance parameters in gasoline MP-injection and road performance parameters in CNG MP-injection at 143 Nm respectively. Power effort and speeds at the drive wheel are presented. Those were measured based on the European Driving Cycle (ECE-15). The value of the vehicle speeds and power are increased as the time is increased up to 65 s with
values of 130 km/h, 5200 rpm and 20 kW for gasoline phase, where the corresponding values of 48 s and 122 km/h,
4700 rpm and 18 kW for CNG phase (acceleration mode) and then decreased till reach 85 s for gasoline and 72 s for CNG phase (deceleration mode), where all values are nearly zero. In the same figures torque effort is shown, where their fluctuations are higher for gasoline than CNG. Moreover, the building period takes 5 s for gasoline and 10 s for CNG. In Figs. 7 and 8, the Hyundai-star 1600 cc vehicle road performance parameters in gasoline MP-injection and road performance parameters in CNG MP-injection at 60 km/h respectively. Power effort and speeds at the drive wheel are presented. Those were measured based on the European Driving Cycle (ECE-15). The value of the vehicle speeds and power are increased as the time is increased up to 20 s with values of 72 km/h, 2900 rpm and 29 kW for gasoline phase, where the corresponding values of 28 s and 78 km/h, 4700 rpm and 32 kW for CNG phase (acceleration mode) and then decreased and all fluctuated around till 60 s and kept nearly constant till reach 240 s (gasoline) and 175 s (CNG) except the case of rotational speed reaches 240 s, where all values are nearly zero. In the same figures torque effort is shown, where their fluctuations are higher for gasoline than CNG. Moreover, the building period takes 30 s with maximum value of 490 Nm for gasoline and 35 s with maximum value of 490 Nm 480 Nm for CNG. Vehicle road acceleration are presented in Figs. 9 and 10, where the distance (S) of 145 m can be gained in about 18 s for gasoline with the actual vehicle speed (Vact) is 60 km/h and 450 m can be gained in about 50 s for CNG with
the actual vehicle speed (Vact) is 60 km/h. Furthermore, high fluctuations occur in Vact for CNG than that for gasoline.
CONCLUSIONS
1. Hyundai-star vehicle was instrumented and operated with gasoline and natural gas and multi-point injection (MPI) system. Over a range of vehicle and engine speeds existing at steady and transient states conditions, the vehicle performance parameters are presented.
2. Based on steady-state condition mode in dynamometer tests, the average power and torque loss of CNG compared to gasoline is in the range of 3 to 19.7% and 1.6 to 21.6%, respectively. A reduction produced in the lower vehicle engine speed up to 2000 rpm, while it is nearly the same at higher vehicle engine speed.
3. In transient state condition mode in dynamometer tests, it is observed that the current bi-fuel (gasoline-CNG) tested has the potential to meet the standards with either of the two fuels and when works with CNG only it produces less performance parameters levels than the gasoline one . Furthermore, it is found that the vehicle road acceleration produced from the vehicle operated by CNG high fluctuations occur in Vact for CNG than that
for gasoline.
4. based on ECE-15 driving cycle, it is recommended that for more accurate dynamometer testing as well as more robust operation of the bi-fuel vehicle platform. These recommendations respond to lessons learned in data collection with the steady-state and transient state dynamometer modes and better understanding of performance parameters requirements.
5. In transient state, it is observed that the current bi-fuel vehicle (gasoline-CNG) tested has the potential to meet the standards with either of the two fuels and when works with CNG only it produces less performance parameters levels than the gasoline one . Furthermore, it is found that the vehicle road acceleration produced from the vehicle operated by CNG high fluctuations occur in Vact for CNG than that for gasoline.
REFERENCES
Chang Tu, and Chang Tu, M. 2004. Development of a
Real-Time Controller for an Engine Dynamometer".
Mechanical Engineering Project, School of Engineering, The University of Auckland.
Hecht Basch, R., Fash, J., Hasson, R., Dalka, T., McCune, R. and Kafold, R. 2000. Initial Dynamometer and Laboratory Evaluations of Thermally Sprayed Aluminum Brake
Discs,” In Brakes, International Conference on
Automotive Braking Technologies for the 21st Century, pp. 163-173.
Kim, M.S. and Hur, H.M. 2009. Braking/Traction Control Systems of a Scaled Railway Vehicle for the Active Steering Test bed” The 9th WSEAS International Conference on Robotics, Control and Manufacturing Technology (ROCOM '09), Hangzhou, China, May 20-22. Moriyama, A., Murase, I., Shimozono, A., and Takeuchi, T.
1991. A robotic driver on roller dynamometer with vehicle performance self learning algorithm" Proc. International Congress and Exposition (Detroit), February 25 – March 1.
Muller, K., and Leonhard, W. 1992. Computer Control of a Robotic Driver for Emission Tests" Proc. International
conference on Industrial Electronics, Control,
Instrumentation, and Automation (San Diego),Vol.3, pp.1506–1511, Nov 9-13.
Namik, H., Inamura, T., and Stol, K. 2008. Development of a Robotic Driver for Vehicle Dynamometer Testing" Mechanical Engineering Project, School of Engineering, The University of Auckland.
Shimizu, K. and Seimiya, S. 2004. Factors in Deteriorating Accuracy of Fuel Consumption Test for HEVs. Trans. of
Society of Automotive Engineers of Japan, Vol. 35, No.3,
pp. 97-103.
Sameh M. Metwalley is Associate Professor of Hybrid Vehicles and CNG Vehicle Technologies at Helwan University. He obtained the B.Sc., M.Sc. & PhD degrees in Automotive Engineering from Helwan University in 1988, 1996 & 2000 respectively. He has about 20 publications in the field of CNG & Hybrid vehicle systems. In addition his current research projects are focused on development of the vehicle noise and vibration from point of view of control and maintenance. Dr. Metwalley is Member of the Egyptian Society of Engineers.
Shimizu, K., Ikeya, C. and Miyagi, M. 1982. Some examination on vehicle restraint system on chassis dynamometer" Preprint of JSAE symposium 822, pp.417-424, 10.
Shimizu, K., Nihei, M., Ogata, I. 2003. Fuel Consumption Test Procedure for HEVs –Test Procedure to Ensure Resultant Accuracy in Actual Linear Regression Method" Proc. of EVS-20, Long Beach.
Shimizu, K-I., Nihei M., and Okamoto T. 2008. Fuel Consumption Test Method for 4WD HEVs – On a Necessity of Double Axis Chassis Dynamometer Test" The World Electric Vehicle Journal, Vol 2, Issue 4, 2008 WEV Journal, ISSN 2032-6653.
Su, S., Yan, Z., Yuan, G., Cao, Y. and Zhou, C. 2002. A
Method for Prediction In-Cylinder Compound
Combustion Emissions "Journal of Zhejiang University Science, 3(5), pp. 543-548.
Vong, C., Wong, P. and Li, Y.P. 2006. Prediction of Automotive Engine Power and Torque Using Least Squares Support Vector Machines and Bayesian Inference" Vong, Wong, and Li, Engineering Applications of Artificial Intelligence, vol.19(3), pp. 227-297.
Shawki A. Abouel-seoud is Professor of Vehicle Design and
Dynamics at Helwan University. He obtained the B.Sc. from Helwan University in 1969 and the Ph.D. degree in Mechanical Engineering from Birmingham University, U.K. in 1979. He has about 80 publications in the field of Vehicle Design and Dynamics. In addition, his current research projects are focused on development of the vehicle noise and vibration from point of view of control and
maintenance. Email: ([email protected])
Abdelfattah Mostafa Farahat is General Manager of Cairo