Dynamic Processes for Nanostructure Development in Cu after Severe Cryogenic
Rolling Deformation
Yinmin Wang
1, Tong Jiao
2and En Ma
1 1Department of Materials Science and Engineering, Johns Hopkins University, Baltimore, MD 21218, USA 2Department of Mechanical Engineering, Johns Hopkins University, Baltimore, MD 21218, USA
The dynamic grain refinement behavior upon severe plastic deformation has been systematically studied in commercial purity copper that was heavily cold rolled to large deformations at cryogenic temperatures. The low-temperature rolling allows the accumulation of extraordinarily high densities of dislocations in Cu, enabling an investigation of the various dynamic recrystallization phenomena upon further deformation. The eventual steady-state grain sizes achieved, as well as the dynamic recrystallization mechanisms, are studied using controlled deformation tests combined with transmission electron microscopy. The dominant mechanisms observed to contribute to grain refinement in Cu include the classical migration dynamic recrystallization process, the deformation twinning, as well as the continuous dynamic recrystallization via progressive lattice rotation upon deformation to extremely large strains. The strain rate and deformation temperature have strong effects on the operative mechanisms and the grain sizes achieved in the ultrafine and nanocrystalline regimes.
(Received April 7, 2003; Accepted June 18, 2003)
Keywords: cold rolling, severe plastic deformation, dynamic recrystallization, nanocrystalline and ultrafine-grained copper, grain refinement
1. Introduction
The processing of flaw-free bulk samples is a challenging first step in investigating the mechanical behavior of nano-structured materials. Several severe plastic deformation (SPD) processes have been developed over the past decade to produce bulk nanostructured materials without introducing porosity and impurities. Typical SPD processes that decom-pose the microstructure of bulk samples into nanostructures include equal channel angular pressing (ECAP) and high pressure torsion, performed at room temperature (RT) or elevated temperatures.1–4)The eventual grain size reached for a pure metal such as Cu is usually a few hundred nanometers, slightly beyond the 100 nm conventionally defined as the demarcation line of the nanocrystalline (nc) regime.1–5)
In addition to the large plastic strains provided by the SPD processes, there are other factors that are known to promote grain refinement down to the nc range. For alloys, solute atoms and precipitates can act as grain growth inhibitors. For metals, complex strain paths are helpful, as complicated dislocation configurations are involved in deformation. Also, high strain rates and low deformation temperatures suppress dynamic recovery and hence facilitate grain refinement mechanisms, as demonstrated for example in the process of ball milling.6)
In this work, we use cold rolling, a common, inexpensive industrial process, to impart large plastic strains to Cu. Such a simple processing route is usually not ideal for producing nanostructures in metals. Cold rolling of Cu at RT has been studied extensively before,7–19) with thickness reduction typically in the range of 0-15,000% (Von Mises equivalent
strain ¼0-5). At medium to high plastic strains
(1< <5), it is generally understood that multiple dis-locations interact, forming multifarious defects such as dislocation cells, cell blocks, microbands, twins and sub-grains.20)Nanocrystallites with high angle grain boundaries are usually not found. At extremely high strains ( >5), data are scarce because the rolled sheets start to break up and
intermediate annealing is necessary before further cross-sectional reduction is possible. In this paper, we describe a procedure that enables commercial Cu to be rolled to very large plastic strains ( >5) without cracking even at cryogenic temperatures. Using heavily deformed Cu, we investigate the structural evolution towards nanocrystals at extremely large strains. The cryo-rolled Cu is subjected to further deformation, including controlled deformation tests, to study the effects of deformation temperature and strain rate on the grain refinement mechanisms as well as the steady-state grain sizes achievable.
2. Experimental Procedures
As the starting material, a commercial purity Cu (99.9+% purity) bar 12.7 mm in diameter was annealed at 900C for 2 h. The resulting grain size is in the range of 10-30mm. Rolling was carried out at RT and cryogenic temperatures (CT), with a thickness reduction per pass of 30-50%. In the first stages of rolling, the workpiece was rotated 90about the rolling direction between consecutive passes. For CT rolling, the samples were submerged in liquid nitrogen until equilibrium and then rolled quickly. The temperature, as measured using a K-type thermocouple, was 150C and 100C before and after each pass, respectively. The degree of deformation, ", is defined as "¼ ðSoSÞ=S100%, whereSoandSare the cross sectional areas before and after rolling. The strain rate during rolling was101s1-100s1. At very large", the sample became thin sheets (of the order of 100mm), which were folded to increase the sample thickness and sandwiched between steel plates or embedded inside a steel tube. The constrained rolling reduces the tendency for cracking.
The evolution of the microhardness was recorded as a function of". Vickers hardness tests were carried out on the polished sample surfaces (1200 grit finish) with a LECO M-400 hardness tester using a load of 50 g and a duration of 15 s. The hardness value obtained was averaged from at least eight Special Issue on Nano-Hetero Structures in Advanced Metallic Materials
indentations for each sample.
The thermal stability of the rolled Cu microstructure was studied using a differential scanning calorimeter (DSC, Perkin-Elmer Pyris 1) in the temperature range of 50 to 450C at a constant heating rate of 40C/min. No additional DSC signals were detected beyond this range. Aluminum pans were used for both the sample and the reference. The baseline was determined by reheating the sample at the same heating rate.
Controlled deformation was conducted by conventional compression testing on samples CT-rolled to "2300%. The stored energy of cold work reached saturation at this strain level. The high strain rate tests were performed using a compressive Kolsky bar setup over the strain rate range of 103s1-104s1.21–23) The quasistatic tests were carried out using a standard MTS servohydraulic-driven machine at a constant anvil displacement speed, with initial strain rates of 104s1-101s1. The sample sizes for the dynamic and quasistatic compression tests were2:22:21:6mm3and 2:22:2 3:5mm3, respectively. The loading axis is parallel to the longitudinal rolling direction. The samples tested at CT were cooled with liquid nitrogen to a measured temperature of125C (148 K).
The microstructures of the samples were examined using a Philips EM420 transmission electron microscope (TEM) operated at 120 kV. The high-resolution TEM (HRTEM) was conducted in a Philips CM300 Field-Emission-Gun (FEG) TEM operated at 300 kV. The point-to-point resolution is 0.2 nm. The misorientations between grains were measured using the method in Ref. 24). TEM samples were prepared by a Struers Tenupol-3 double jet electro-polisher at 35C with an electrolyte of 33% nitric acid and 67% methanol. For the as-rolled samples, TEM foils were cut with the thin section parallel to the rolling plane. For compression-tested samples, TEM foils were sliced normal to the loading axis.
3. Results
3.1 Evolution of microhardness and stored energy of cold work
The Vickers microhardness (VHN) of the samples, rolled at RT and CT, to different strain levels is shown in Fig. 1. The effect of temperature is significant. For CT rolling, VHN increases up to 1.7 GPa with increasing deformation up to
"¼2300% and then levels off. A similar trend is observed at RT, except that the maximum VHN is only about 1.2 GPa and is reached much earlier.
The constant-heating-rate DSC traces of the samples CT-and RT-rolled to different levels of"are displayed in Fig. 2. Each DSC curve shows a single exothermic peak between 150C and 300C, corresponding to the heat release due to recrystallization and subsequent grain growth. The peak position shifts to lower temperatures with increasing". The peak temperatures of CT-rolled Cu are more than 60 K lower than those of RT-rolled Cu for the same ". This is because dynamic recovery is reduced at CT, allowing the density of the accumulated dislocations to reach higher levels than at RT. The driving force for recrystallization is elevated as a result.
The area under the peak is an indicator of the stored energy
of cold work. As seen in Fig. 3, the same trend is observed for samples rolled at both temperatures: the integrated enthalpy increases with rolling strain and levels off beyond a certain". After rolling the sample to "¼2000-4600%, the stored energy for CT rolled Cu reached 1.6 J/g (102 J/mol), which is about 2.5 times that for the same Cu rolled at RT to similar strains (0.6 J/g). At both temperatures, the stored energy plot follows the same trend as that in Fig. 1. That commercial purity Cu can be deformed to 7;000% without fracture under rolling was not reported before.
0 1000 2000 3000 4000 5000 6000 7000 8000 600
800 1000 1200 1400 1600 1800 2000
CT
RT
Microhardness, /MPa
Rolling Strain (%)
Fig. 1 The Vickers hardness as a function of". Note that CT-rolled Cu reaches much higher hardness values than those of RT-rolled Cu.
0 0.05 0.1 0.15 0.2 0.25 0.3 0.35
100 150 200 250 300 350 400 450
Heat Flow (W/g), Endo
Temperature, T / o
C
4600% 30000%
354% 988% 1686% 2319%
(a)
0 0.05 0.1 0.15 0.2 0.25
100 150 200 250 300 350 400 450
Heat Flow, Endo (W/g)
Temperature, T / oC
752% 1430% 2433% 3914%
(b)
[image:2.595.315.537.75.230.2] [image:2.595.323.531.286.613.2]3.2 The effect of additional deformation during me-chanical testing
3.2.1 The deformation test curves
The heavily CT-deformed Cu was subjected to additional deformation in compression tests at different strain rates and temperatures. These controlled test conditions help establish the mechanisms responsible for the dynamic grain refinement processes. Figure 4 shows the strain rate dependence of the flow stress at RT and 148 K (higher flow stresses at higher strain rates). These stress-strain curves do not provide accurate measurements of the Young’s modulus because the experiments were designed for large plastic deformations. The strain at which the steady-state flow stress was attained increases monotonically with decreasing strain rate or increasing temperature. The initial peak in the flow stress is a characteristic signal that the material has accumulated a sufficient amount of strain (stored energy) for recrystalliza-tion during the deformarecrystalliza-tion test.25) All the tests were terminated with unloading, without any sign of cracking.
3.2.2 Microstructure evolution
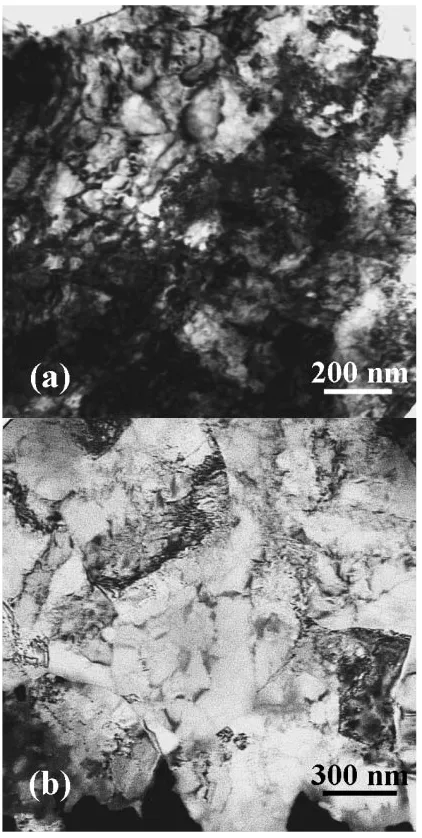
Typical TEM bright-field images of the as-rolled (same
"¼2300%) Cu after CT and RT rolling are shown in Figs. 5(a) and (b), respectively. The CT-rolled Cu shows a heavy
deformation microstructure with features that are difficult to resolve. Only occasionally are there observable grains 50-200 nm in size. The dislocation density is very high and nonuniformly distributed. The grain boundaries are mostly diffuse, indicating their nonequilibrium nature. Dislocation cells, dislocation-tangling zones, and dense dislocation walls were frequently observed inside the grains.26,27) Subgrains with low-angle grain boundaries, mostly having sizes
[image:3.595.322.533.71.490.2]<150nm, can also be seen. A different scenario is observed for RT-rolled Cu (Fig. 5(b)): the dislocation density is much lower, and the subgrains are better defined, with an average size of300nm. Heavy dislocation tangles or cell blocks are rarely seen, indicating significant dynamic recovery during rolling.
Figure 6 displays the TEM micrographs of CT-rolled copper after additional high strain rate (104s1) Kolsky bar deformation of 60% at RT and CT. A comparison of Fig. 6(a) with Fig. 5(a) indicates that the additional RT deformation lowers the overall dislocation density. Many grains become nearly equal-axed, with sharp grain boundaries. These near dislocation-free grains coexist with some grains with high 0 1000 2000 3000 4000 5000 6000 7000 8000
0.2 0.3 0.4 0.5 0.6 0.7 0.8 0.9 1.0 1.1 1.2 1.3 1.4 1.5 1.6 1.7 1.8
RT CT
Energy Release, /J.g
-1
Rolling Strain (%)
Fig. 3 The stored energy as a function of", for CT- and RT-rolled Cu.
0 200 400 600 800 1000
0 10 20 30 40 50 60 70 80
True Stress, /MPa
True Strain (%) 10-4 s-1, 298 K
10-1 s-1, 298 K 11400 s-1, 298 K
10965 s-1, 148 K
10-1
s-1, 148 K
Fig. 4 Compressive stress-strain responses of cryo-rolled Cu at strain rates of104s1to1:14104s1. The materials were subject to CT rolling before tests, with"¼2;300%.
[image:3.595.60.277.74.228.2] [image:3.595.58.282.568.747.2]dislocation densities, leading to a coexistence of sharply delineated boundaries and loosely tangled ones. Such features are normal after significant dynamic recrystalliza-tion.28) The selected area diffraction (SAD) pattern from a sample area of 4.5mm2shows fairly uniform rings, confirm-ing a nearly continuous and wide distribution of mis orientations. The average grain size was measured using the linear intercept method to be 205 nm from over 150 grains, much smaller than that of the as-rolled grains/ subgrains observed in Fig. 5(b). This comparison demon-strates that, to achieve small grain sizes it is useful to use CT deformation to store dislocations and high-rate loading for dynamic recrystallization.
Two major features can be identified for the sample deformed at CT at high strain rates, Fig. 6(b). First, dynamic recrystallization did not occur and the high-density disloca-tions remained. Second, we observed clusters of nanosized (<20nm thick) deformation twins with a total width of about 200 nm, which are apparently a result of deformation at the low temperature and high strain rates.29,30)The clustered twin bands (CTBs), which consist of multiple mechanical twins,
are aligned along the plastic flow direction. The CTBs occupy60% of the area observed, indicating the dominant role of twinning in high-rate CT deformation. Also, the CTBs are more profuse in the thicker areas of the TEM foil than in the thinner regions, possibly because in the latter areas dislocation/twin rearrangements occurred, losing some of the CTB structures.
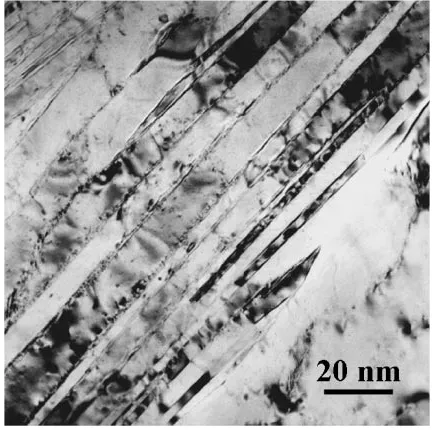
To further reveal the detailed features of the CTBs, Fig. 7 shows a high-magnification view of the multiple twins and twin boundaries. The twin boundaries along the lengths of the bands are very sharp and individual dislocations are not resolved. Dislocations are commonly seen starting from twin boundaries and subdivide the twin into a number of subgrains. The long, aligned, sharply defined twin clusters do not intersect often. Only occasionally can interpenetra-tions of CTBs be identified, where nanograins 50-100 nm in size are produced as a result.
The cryo-rolled Cu was also subjected to low-strain-rate (101s1) deformation at RT and CT. Compared with Fig. 6(a), RT deformation resulted in a similar recrystallized microstructure, but the average grain size is much larger at 290nm, Fig. 8(a). The CT quasistatic deformation led to minor microstructural change (compare Fig. 5(a) with Fig. 8(b)). The microstructures evolved slowly at CT at such high strain levels.
3.3 Evolution towards nanostructures upon prolonged rolling at CT
Adding CT rolling to the cryo-rolled Cu was not able to produce nanocrystalline grain structures up to "¼4600%. TEM still revealed a heavily deformed microstructure with high densities of dislocations in nanoscale networks, Fig. 9. Only occasionally are there some resolvable subgrains 30-300 nm in size. Some small subgrains become visible at high magnifications, as seen in the HRTEM images in Fig. 10(a). Its Fourier-filtered image is in Fig. 10(b). Based on the modulation wavelength of the fringes in a number of Fig. 6 TEM micrographs of cryo-rolled Cu after additional high strain rate
(104s1) deformation of 60% at (a) RT, and (b) CT (148 K).
Fig. 7 A high-magnification TEM image of multiple twins and twin boundaries. The sample was deformed to 60% strain at a strain rate of
[image:4.595.67.274.71.489.2] [image:4.595.318.535.73.288.2]HRTEM micrographs the average size of these crystallites is 12nm. The SAD pattern (Fig. 10(c)) of this sample consists of some scattered spots and small arcs, indicating the existence of subgrains with small misorientations (also see the fringes).
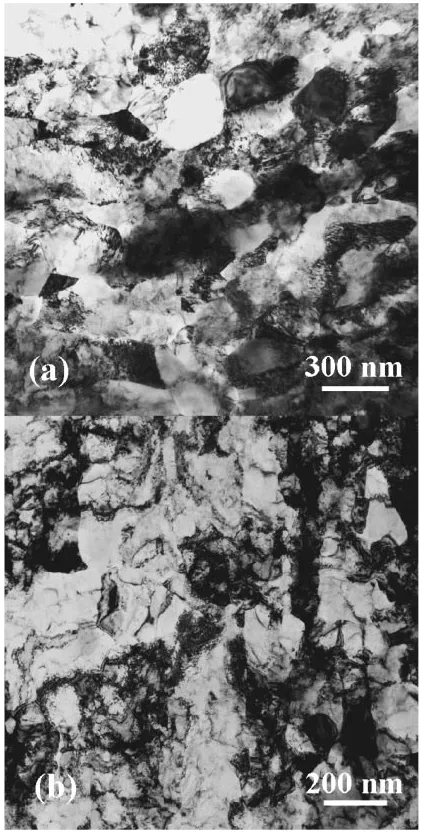
Figure 11(a) shows a TEM bright field image and corresponding SAD pattern of the nanostructures developed in Cu after it was rolled to a total " of 30000% at the Fig. 8 TEM bright-field images of the cryo-rolled Cu after additional low
strain rate (101s1) deformation to (a) 60% strain at RT, and (b) 25% strain at CT (148 K).
Fig. 9 TEM bright-field micrograph of commercial Cu after CT rolling to
[image:5.595.63.275.72.488.2]"¼4;600%, showing the high dislocation density typical of heavily cold-worked microstructures.
[image:5.595.337.516.74.621.2] [image:5.595.69.269.550.747.2]cryogenic temperature. In comparison with the diffused features of Fig. 9, the grains are now much easier to resolve. The grain boundaries are clearly visible and well defined. The grains show high contrast across the grain boundaries, indicating large misorientations. The SAD pattern is also quite different from Fig. 10(c). A set of distinctive continuous rings, with no obvious signs of preferential orientations, is observed instead of scattered dots or arcs, indicating the existence of fine and highly misoriented grains. The grain sizes span a range, but are definitely in the nanocrystalline range (10-50 nm). Grains close to or larger than 100 nm are extremely rare in the TEM samples examined. For some regions where grains are not clearly resolved in the bright-field image, such as the upper right corner in Fig. 11(a), the dark-field image reveals very small grains of the order of 10-20 nm, Fig. 11(b). Figure 12 displays the grain size distribution plot obtained from a number of micrographs. The grains are nonuniformly distributed but definitely all less than 100 nm, with an estimated average size of 22 nm.
A high-resolution TEM micrograph and corresponding Fourier-filtered image of the 30,000% CT-rolled copper are displayed in Fig. 13, showing the nature of the high-angle grain boundaries. The crystallites seen in this area have sizes similar to those in Fig. 10 ("¼4600%) with an average size of11nm. This suggests that in the late stages of rolling, the size of the domains/crystallites does not decrease further.
[image:6.595.61.275.72.411.2]Some subgrain boundaries and small-angle grain boundaries (misorientation 15) are still detectable. This is not surprising as plastic deformation is inherently an inhomoge-neous process.
Fig. 11 (a) TEM bright-field micrograph of Cu after CT rolling to
"¼30;000% and the corresponding SAD pattern (selected area = 0.6mm2). (b) TEM dark-field micrograph showing the small grains.
0 20 40 60 80 100 120
0.00 0.05 0.10 0.15 0.20 0.25 0.30
D = 22 nm 231 grains
Number Fraction
[image:6.595.329.522.73.211.2]Grain Size, /nm
Fig. 12 The grain size distribution plot of the cryo-rolled Cu ("¼30;000%). The average grain size obtained is 22 nm.
[image:6.595.321.532.269.651.2]4. Discussion
4.1 Effects of cryogenic temperature on stored energy and microhardness
The significant increase of the hardness and the stored energy, Fig. 1 and Fig. 3, reflects the increase of stored dislocation densities in the CT-rolled Cu. As dynamic recovery is mainly controlled by dislocation climb and cross-slip mechanisms,31)the cryogenic temperature decreas-es the dislocation mobility and hence reducdecreas-es the rate of dynamic recovery, allowing the density of the accumulated dislocations to reach higher levels than at RT. A stored energy of 102 J/mol was attained for CT-rolled Cu, about 2.5 times that for the same Cu rolled at RT. According to Mohamed et al.,32) the stored energy in pure Cu can be linearly related to the dislocation density by
E ðJ/molÞ ¼1:441014ðm2Þ ð1Þ
The equation yields a dislocation density¼71015m2, about one order of magnitude higher than that observed in some ECAP Cu.1)At such a high dislocation density level, dynamic recrystallization may be triggered at low homolo-gous temperatures.33)
4.2 Dynamic recrystallization and steady-state grain size
There are two classical dynamic recrystallization mecha-nisms, namely, discontinuous dynamic recrystallization and continuous dynamic recrystallization (cDRX).25) The first mechanism is also known as migration dynamic recrystalli-zation (mDRX) and characterized by the movement of pre-exiting high-angle grain boundaries through the deformed microstructures, leaving a strain free region in their wake. The second mechanism includes geometric dynamic recrys-tallization and progressive rotation recrysrecrys-tallization. The former forms new crystals due to the interpenetration of microbands or twins. The latter involves the gradual rotation of subgrains as the material is strained. Eventually the misorientation between neighboring subgrains is sufficiently large that the sub-boundaries are turned into high-angle grain boundaries.
Our results indicate that the mechanisms responsible for the evolution of the heavily deformed microstructure towards fine grains depends strongly on the deformation rate and deformation temperature. Dynamic recrystallization initiates when a critical strain, "c, is reached. According to the classical mDRX theory,25)"cincreases with increasing strain rate or Zener-Hollomon parameter, which is defined as:
Z¼""_exp Q
RT
ð2Þ
whereQis the activation energy."cincreases with decreasing temperature. mDRX, normally a high-temperature phenom-enon, can therefore possibly occur at or below RT only if a very high accumulative strain (or a critical stored energy34)) is reached. In our case, a large driving force is made possible by the heavy cold work during CT rolling.
One of the key signatures of mDRX is the broad peak in the beginning of a stress-strain curve, as that seen in Fig. 4.
Note that this peak is not present for a material undergoing dynamic recovery, for which the stress-strain curve usually shows a plateau following an initial strain-hardening stage. This signature suggests that mDRX was involved in cryo-rolled Cu when it was further deformed at RT (0.22Tm), but not when tested at cryogenic temperatures. TEM examina-tions support this view. The co-existence of sharp grain boundaries and loosely tangled grain boundaries are typical of microstructures for RT tested samples (see Figs. 6(a), 8(a)), whereas deformation twinning becomes the dominant feature upon high rate deformation at CT (Fig. 6(b)).
In mDRX, a dynamic balance between nucleation events and grain growth determines the steady-state grain size developed. Derby35,36)developed a ‘‘universal’’ plot relating the normalized stress level,=, to the normalized grain size after mDRX,D=b, whereis the steady-state flow stress,is the shear modulus (weakly dependent on temperature),Dis the steady-state grain size, and b is Burgers vector. It was shown that
D/ 1 _
"
"1=2: ð3Þ Increasing strain rate can reduce the steady-state grain size. Andradeet al.37)observed dynamically recrystallized grains as small as 100 nm in Cu at a strain rate of104s1and a total shear strain of 8. Even though their grain size is one order of magnitude smaller than the grain size reported in literature,38–43)the result seems to be consistent with the trend extrapolated from the empirical equation of Blaz et al.,44) Fig. 14,
D b
¼K ð4Þ
whereKis a constant. The value of the constantobtained by Blaz et al. is 0.59. Our grain sizes obtained after RT compression tests (Fig. 4) have also been included in Fig. 14. The data points agree well with the trend predicted by the formulation.35,36,44)
This fit in Fig. 14 is another evidence that the mDRX was involved, in addition to the initial peak in the stress-strain curve that signals mDRX upon ‘‘hot’’ deformation of a material that has stored energy in ‘‘cold’’ deformation. However, mDRX may not be the only process operative because at high dislocation densities the number of isolated regions with a large growth advantage over the surroundings may be limited. cDRX (see below) may also be involved,45,46) which occurs in the flat portion of the stress-strain curve and results in some deviation from eq. (4) (Fig. 14).46)
4.3 Formation of nanocrystalline grain structures
The eventual development of nanocrystalline grains (<100nm) upon continued CT rolling involves extreme grain refinement and development of high-angle grain boundaries, as reported here and in our recent work.47)The nanocrystallite formation was not involved previously in studies of cold rolling to smaller strains ( <5).15)
found to be a function of the deformation temperature.47,49–51) From the dislocation density obtained in eq. (1), the average dislocation distance is12nm for the CT-rolled copper. This is consistent with an estimate of the equilibrium dislocation distance,52)
Lc¼ 3b
ð1vÞH ð5Þ whereH is the hardness of the material (1.7 GPa for cryo-rolled Cu at" >2;000%, see Fig. 1). This result suggests that a domain/grain size of the order of 10 nm is achievable at very large"in cryo-rolled Cu. The HRTEM observations in Fig. 10 confirm that the majority of subgrains are close to 10 nm, with small-angle misorientations between them.
For such small subgrains, the eventual formation of nanocrystals may be due to cDRX through gradual rotation of the subgrains. As the high-angle grain boundaries are formed by progressive increase of misorientation angles of the small-angle subgrain boundaries, one would expect that eventual crystallites be similar in size to that of the subgrains. This is indeed true from TEM and HRTEM observations, as illustrated in Fig. 11 and Fig. 13. Most high angle nanograins formed in the 30000% cryo-rolled Cu have similar sizes to those observed in 4600% cryo-rolled Cu (Fig. 10). There are a few grains with sizes 50-100 nm in the 30000% rolled nanostructures, formed possibly by the interpenetration of MBs and/or CTBs as observed by TEM in the CT-tested samples.
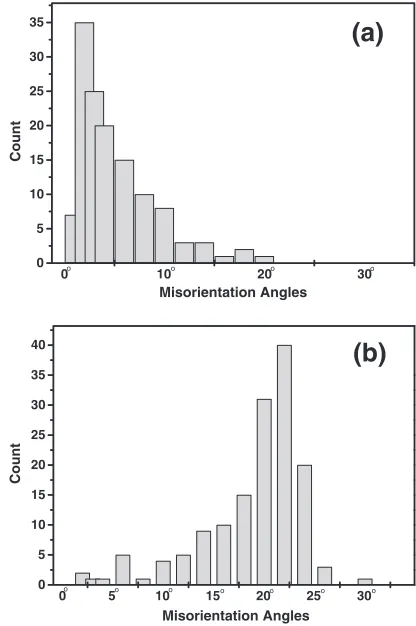
The increase of misorientation angles between subgrains can also be seen from the statistical misorientation distribu-tion plot in Fig. 15. It is found that most misorientadistribu-tion angles of the neighboring subgrains/crystallites are increased from 1-10 (at "¼4600%, Fig. 15(a)) to 10-25 ("¼30000%, Fig. 15(b)). As a result, the average grain misorientation increased from 5to 18 while maintaining the nanocrystal-line size of the subgrains/crystallites. Similar cDRX has been reported for Cu with larger grains before,48)and such grain rotation can be accommodated by dislocation generation and movement as predicted by computer simulations.53)
The preference for the progressive lattice rotation mech-anism at very large strains and slow strain rates over the
conventional mDRX (Sec. 4.2) is also supported by the relatively low flow stress during the late stage of cryo-rolling (CT rolling was conducted with ease near"¼30000%). As shown in Fig. 4, a flow stress less than 600 MPa was observed as the cryo-rolled Cu was continuously deformed at a strain rate and temperature similar to those of cryo-rolling. If one assumes that mDRX is still dominant, the model in Fig. 14 indicates that the flow stress required would be as high as 2.7 GPa in order to obtain a dynamic recrystallization grain size of 22 nm (Fig. 11 and Fig. 12). This was not the case in the CT-rolling experiments.
5. Concluding Remarks
We have investigated the grain refinement behavior in heavily cryo-rolled copper. The CT-rolling accumulates high densities of dislocations in Cu to allow an investigation of the various dynamic recrystallization phenomena upon further deformation. Strain rate and deformation temperature are found to change the grain refinement mechanism. The results of the entire set of experiments can be summarized as follows:
(1) A cryogenic temperature, and thus a low rate of dynamic recovery, is beneficial for attaining a high dislocation density (and hence also a higher hardness) in heavily rolled Cu.
(2) Migration dynamic recrystallization can occur during RT (0.22Tm) deformation of cryo-rolled Cu. This is a method to produce bulk ultrafine-grained microstruc-2.0 2.5 3.0 3.5 4.0 4.5 5.0 5.5 6.0 6.5
-4.0 -3.5 -3.0 -2.5 -2.0 -1.5 -1.0
Blaz et al. Andrade et al. Current data
Log (
σ /
/ µµ
)
[image:8.595.321.529.72.385.2]Log (D / b)
Fig. 14 Dependence of the steady-state Cu grain size on the normalized uniaxial normal stress for dynamic recrystallization from Blazet al., [44] Andradeet al.[9] and the current experimental data for RT deformation of cryo-rolled Cu.
0 10 20 30
0 5 10 15 20 25 30 35
o o
o o
(a)
Count
Misorientation Angles
0 5 10 15 20 25 30
0 5 10 15 20 25 30 35 40
o o o o o o o
(b)
Count
Misorientation Angles
[image:8.595.66.270.72.224.2]ture with average grain size as small as 200 nm. High deformation rate results in smaller recrystallized grain sizes compared with quasistatic deformation rates. The classical mDRX formulation produces a reasonable fit even in this range of grain sizes for Cu.
(3) mDRX did not appear to occur during CT (148 K, 0.11Tm) deformation. Deformation twinning is a mechanism to refine the microstructure if the strain rate is high at CT.
(4) At sufficiently high accumulative strains (" >
30;000%), a nanocrystalline grain structure with an average grain size of 22 nm was achieved upon continuous cryo-rolling of this commercial purity Cu. The nanocrystallites formed in this case are largely due to a cDRX, i.e., the progressive increase of grain boundary misorientation angles at extremely large deformations.
(5) Severe plastic deformation can produce a range of nanocrystalline or ultrafine grain structures in Cu via different dynamic grain refinement mechanisms, de-pending on the strain (dislocation density) accumulated, and on the deformation temperature and strain rates.54) (6) The findings from this work may shed light on the grain size limits and mechanisms involved in the grain refinement processes in other SPD-processed nc or ultrafine-grained metals and alloys.
Acknowledgements
Part of this work was presented at the International Workshop on Nanostructured Metallic Materials, March 9-12, 2003, Sendai, Japan, sponsored by the Nanotechnology Research Network Center of Japan and Tohoku University Materials Research Center.
REFERENCES
1) R. Z. Valiev, E. V. Kozlov, Y. F. Ivanov, J. Lian, A. A. Nazarov and B. Baudelet: Acta Metall. Mater.42(1994) 2467-2475.
2) I. Kim, W. S. Jeong, J. Kim, K. T. Park and D. H. Shin: Scr. Mater.45 (2001) 575-581.
3) V. V. Stolyarov, Y. T. Zhu, T. C. Lowe and R. Z. Valiev: Mater. Sci. Eng. A303(2001) 82-89.
4) H. Jiang, Y. T. Zhu, D. P. Butt, I. V. Alexandrov and T. C. Lowe: Mater. Sci. Eng. A290(2000) 128-138.
5) Y. M. Wang, E. Ma and M. W. Chen: Appl. Phys. Lett.80(2002) 2395-2397.
6) J. Xu, J. H. He and E. Ma: Metall. Mater. Trans. A28(1997) 1569-1580.
7) N. Hansen and D. Juul Jensen: Phil. Trans. R. Soc. Lond.357(1999) 1447-1469.
8) J. Nuttall and J. Nutting: Metall. Sci.12(1978) 430-437.
9) J. H. Cairns, J. Clough, M. A. P. Dewey and J. Nutting: J. Inst. Metals. 99(1971) 93.
10) B. J. Duggan, M. Hatherly, W. B. Hutchinson and P. T. Wakefield: Metall. Sci.12(1978) 343-351.
11) R. G. Solomon, A. S. Malin and M. Hatherly: inStrength of metals and alloys, Proceedings of the 6th International Conference, Vol. 1, ed. Gifkins RC., (Pergamon Press, Oxford, 1982) 541-546.
12) I. Baker and J. W. Martin: inStrength of metals and alloys, Proceedings of the 6th International Conference, Vol. 1, ed. Gifkins RC., (Pergamon
Press, Oxford, 1982) 487-492.
13) B. Bay, N. Hansen, D. A. Hughes and D. Kuhlmann-Wilsdorf: Acta Metall. Mater.40(1992) 205-219.
14) D. A. Hughes and N. Hansen: Scr. Metall. Mater.33(1995) 315-321. 15) N. Hansen: Mater. Sci. Tech.6(1990) 1039-1047.
16) Q. Liu and N. Hansen: Scr. Metall. Mater.32(1995) 1289-1295. 17) N. Hansen and X. Huang: Acta Mater.46(1998) 1827-1836. 18) Q. Liu, D. Juul Jensen and N. Hansen: Acta Mater.46(1998)
5819-5838.
19) D. A. Hughes and N. Hansen: Acta Mater.45(1997) 3871-3886. 20) J. Y. Huang, Y. T. Zhu, H. Jiang and T. C. Lowe: Acta Mater.49(2001)
1497-1505.
21) K. T. Ramesh: Metall. Mater. Trans. A33(2002) 927-935.
22) D. Jia, Y. M. Wang, K. T. Ramesh, E. Ma, Y. T. Zhu and R. Z. Valiev: Appl. Phys. Lett.79(2001) 611-613.
23) D. Jia, K. T. Ramesh, E. Ma, L. Lu and K. Lu: Scr. Mater.45(2001) 613-620.
24) L. Lu, M. L. Sui and K. Lu: Acta Mater.49(2001) 4127-4134. 25) F. J. Humphreys and M. Hatherly: Recrystallization and related
annealing phenomena, (Pergamon Press, 1st ed. 1995) p. 370. 26) X. Wu, N. Tao, Y. Hong, B. Xu, J. Lu and K. Lu: Acta Mater.50(2002)
2075-2084.
27) H. G. Jiang, Y. T. Zhu, D. P. Butt, I. V. Alexandrov and T. C. Lowe: Mater. Sci. Eng. A290(2000) 128-138.
28) R. B. Nethercott, J. A. Retchford and R. A. Coyle: inStrength of metals and alloys, Proceedings of the 6th International Conference, Vol. 1, ed. Gifkins, RC., (Pergamon Press, Oxford, 1982) 535-540.
29) S. Mahajan and D. F. Williams: Inter. Metall. Rev.18(1973) 43. 30) J. Y. Huang, Y. K. Wu and H. Q. Ye: Acta Mater.44(1996) 1211-1221. 31) R. W. Hertzberg:Deformation and fracture mechanics of engineering materials, 4th ed., (John Wiley and Sons, New York, 1996) p. 125. 32) G. Mohamed and B. Bacroix: Acta Mater.48(2000) 3295-3302. 33) X. Zhang, H. Wang, J. Narayan and C. C. Koch: Acta Mater.49(2001)
1319-1326.
34) R. D. Doherty, D. A. Hughes, F. J. Humphreys, J. J. Jonas, D. Juul Jensen, M. E. Klassner, W. E. King, T. R. McNelley, H. J. McQueen and A. D. Rollett: Mater. Sci. Eng. A238(1997) 219-274.
35) B. Derby and M. F. Ashby: Scr. Metall. Mater.21(1987) 879-884. 36) B. Derby: Acta Metall. Mater.39(1991) 955-962.
37) U. Andrade, M. A. Meyers, K. S. Vecchio and A. H. Chokshi: Acta Metal. Mater.42(1994) 3183-3195.
38) A. S. Malin and M. Hatherly: Metal Sci.13(1913) 463.
39) P. Karduck, G. Gottstein and H. Mecking: Acta Metall. Mater. 31 (1983) 1525-1536.
40) L. Blaz and A. Korbel: Mater. Sci. Tech.5(1989) 1186-1190. 41) S. R. Chen and U. F. Kocks: Scr. Metall. Mater.27(1992) 1587-1592. 42) J. Takada, N. Nishino and S. Kikuchi: J. Mater. Sci.21(1986)
3420-3424.
43) M. Ueki, S. Horie and T. Nakamura: Mater. Sci. Tech.3(1987) 329-337.
44) L. Blaz, T. Sakai and J. J. Jonas: Metal Sci.17(1983) 609-616. 45) O. V. Mishin and G. Gottstein: Philos. Mag. A78(1998) 373-388. 46) A. Belyakov, T. Sakai, H. Muira and K. Tsuzaki: Philos. Mag. A81
(2001) 2629-2643.
47) Y. M. Wang, M. W. Chen, H. W. Sheng and E. Ma: J. Mater. Res.17 (2002) 3004-3007.
48) M. H. Shih, C. Y. Yu, P. W. Kao and C. P. Chang: Scr. Mater.45(2001) 793-799.
49) P. Gay, P. B. Hirsch and A. Kelly: Acta Cryst.7(1954) 41. 50) D. H. Warrington: Proceedings of the European Regional Conference
on Electron Microscopy, Delft, 1961; p. 354.
51) A. Howie: Direct observation of lattice defects in crystals, (Inter-science, New York-London, 1962) p. 283.
52) T. G. Nieh and J. Wadsworth: Scr. Metall. Mater.25(1991) 955-958. 53) J. Schitz, F. D. Di Tolla and K. W. Jacobsen: Nature391(1998)
561-563.