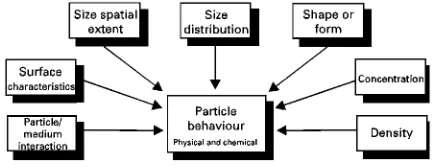
Figure 1 Main factors affecting particle behaviour in a medium. Sullivan JJ and Wekell MM (1987) In: Kramer DE and
Liston J (eds)Seafood Quality Determination, p. 357. New York: Elsevier, North Holland.
Thibault P, Pleasance S and Laycock MV (1991) Analysis of paralytic shellRsh poisons by capillary electro-phoresis. Journal of Chromatography A 542: 483}501.
Wright JLC, Boyd RK, De Freitas ASWet al. (1989) Identi-Rcation of domoic acid, a neuroexcitatory amino acid, in toxic mussels from eastern Prince Edward Island. Cana-dian Journal of Chemistry67: 481}490.
Zhao JY, Thibault P and Quilliam MA (1997) Analysis of domoic acid and isomers in seafood by capillary elec-trophoresis.Electrophoresis18: 268}276.
MECHANICAL TECHNIQUES: PARTICLE
SIZE SEPARATION
A. I. A. Salama, Natural Resources Canada, Devon, Alberta, Canada
Copyright
^
1999 Minister of Natural Resources, CanadaIntroduction
Particles of many kinds and various sizes have played an important role in man’s interaction with his phys-ical environment. They abound in the soil and earth below; they are also present in water, air, chemical products, and many other sources. If particles were spherical or cubical, it would be easy to characterize them. Unfortunately, most of the particles present in our environment are of irregular size and shape. Therefore, it is desirable to try to develop methodolo-gies and techniques to characterize particles of irregu-lar size and shape, and this is the main objective of particle size analysis. Moreover, particle size analysis is important in studying particle behaviour in a medium as in many analytical sciences and industrial applications.
Particle size analysis in physical, chemical, and biological processes involves many concepts and tech-niques; however, this article focuses on the methods of particle size analysis utilizing mechanical techniques. This article willRrst introduce some basic principles used in particle size analysis. This will be followed by a summary of the applicable particle size ranges for the different methods and the size ranges of most common particles found in industrial, chemical, envir-onmental, and clinical applications. The most com-mon mechanical techniques and methods used in particle size analysis will be brieSy presented.
Particle Properties
Particle size analysis plays an important role in many analytical sciences and industrial applications. To assist in developing useful methodologies and
tech-niques it is essential to identify the main factors that control the behaviour of particles in a medium. Such factors include particle density, shape, size, size distri-bution, concentration, and surface characteristics, and the carrier medium dynamics (Figure 1). This article focuses on particle size analysis using mechan-ical techniques in relation to clinmechan-ical, industrial, and environmental applications: therefore, the particles under consideration could be solid or liquid and the medium could be liquid or gas. In aerosol systems the medium is gas (air).
Density
Particles originating from a solid will have the same density as that of the parent material. However, if the material undergoes hydration or surface oxidization or if it agglomerates in clusters, its speciRc gravity will change. The particle density plays an important role in the separation of solids as in centrifugal and gravi-tational sedimentation, for example.
Particle Shape
solidi-Rcation and formation of chain-like aggregate (e.g. iron oxide fumes, carbon black).
Based on experimental data it has been found that for a collection of groups of particles having an aver-age diameterDpifor groupi, the total surface area can be expressed as:
Ap"Q(niD2pi) [1]
where
Q is deRned as the surface shape factor. The total volume can be expressed as:
Vp"v(niD3pi) [2]
where vis deRned as the volume shape factor. The surface and volume shape factors may be related to a combined shape factorkpas:
kp"s
v [3]
In the case of spherical or cubical particles it can be shown that the shape factor is 6. For irregular particles, values vary from 6 to 10. Some other rela-tionships can be obtained by using eqns [1]}[3]:
Av"
Ap
Vp"
kp
DHp
[4]
DHp"
niD3pi niD2pi
[5]
Am"
kp pDHp
[6]
whereAv"speciRc surface area (surface area per unit volume): DHp"speciRc surface diameter: Am" sur-face area per unit mass: p"density of the particle material. The surface and volume information are used in estimating the equivalent spherical particle diameter which is used in studying particle behaviour in a medium.
Fractal geometry Mandelbrot introduced the basic concepts and theories of a new type of geometry called fractal geometry, in order to describe rugged structures. The main idea put forward by Mandelbrot is that the boundary of a rugged system can be de-scribed in its embedding space by a fractal dimension which describes its space Rlling effect. In the case of a fractal surface the estimate of surface area (A
H) tends to increase without limit as the step size (resolu-tion)of an elemental square decreases. This can be expressed as:
A
H"ka\(B\2) [7]
wherekais a constant and the fractal dimensionis greater than 2. Hence a plot of ln(A
H) versus ln() will have a slope of [!(!2)], where ‘ln’ designates a natural logarithm.
Kaye applied fractal geometry in his studies of the proRles of carbon black agglomerates. In subsequent studies he demonstrated the usefulness of fractal ge-ometry in studying boundary and mass fractal dimen-sions of aerosol systems, fractal structures of Rne particle systems, fragmentation, description of por-ous bodies and gas adsorption.
Surface Characteristics and Interfacial Phenomena
The surface characteristics of small particles include surface area, rate of evaporation and condensation, electrostatic charge, adsorption, adhesion and light scatter. In certain circumstances, changes in the envi-ronment of a particle during sampling and particle size analysis may change its size or state of aggrega-tion or its surface characteristics. Such changes must be considered in the selection of a suitable sampling device or method for particle size analysis.
Surface area One of the important characteristics of small particles is the rapid increase in exposed surface area per unit mass as size decreases, which leads to increased chemical reaction rate. Fine powders of organic and inorganic oxidable materials (such as coal, iron,Sour, sugar, and starch) burn vigorously or explode violently when in the form of an aerosol. Moreover, an increase in surface area increases the toxicity of some granular materials.
Evaporation and condensation Evaporation and condensation are diffusion mass transfer pro-cesses which proceed at rates proportional to the surface area exposed. The temperature and partial pressure in the vicinity of the surface control the time required for small particles (e.g. water) to evaporate into still air. The evaporation time is given by:
"8RTMpD2p
Dp [8]
where "evaporation time (s); p"density of particle material (kg m\3); D
p"particle diameter (m); D"diffusion coefRcient of vapour from particle (m2s\1); p"difference between
the particle pressure at the particle surface and in the surrounding Suid (N m\2); R"gas constant
(8.3144 J mol\1K\1);T"absolute temperature (K);
Figure 2 Mechanisms producing natural charge on particles.
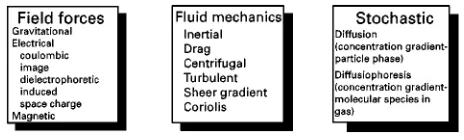
Figure 3 Processes affecting particle motion in a medium. condensation of moisture, leading to an increase in their size.
Electrostatic charge Electrostatic charge represents an excess or deRciency of electrons on the particle surface. This charge may be assumed to reside on the particle surface in an absorbed gas or moistureRlm. Mechanisms which produce natural charge on par-ticle surfaces are shown inFigure 2. The electrostatic charge generated on a particle is proportional to the particle surface area, which is the principle used in the design of electrostatic classiRers and precipitators. Furthermore, the presence of electrostatic charge on particle surfaces controls the behaviour of particles in an electric Reld (see II/PARTICLE SIZE SEPAR-ATION/Electrostatic Precipitation).
Scattering properties Scattering of radiation arises from inhomogeneities, such as dispersed dust or water drops, in theSuid medium. Scattering is often accompanied by absorption, and both scattering and absorption remove energy from the incident beams. The quantitative response of the intensity of transmit-ted and/or scattered beams can be used to character-ize the scharacter-ize of a particle.
Kinetic Behaviour of Particles
The equivalent spherical particle diameter of an ag-gregate of irregularly-shaped particles can be deter-mined by studying the inertial motion of particles in a medium. Such inertial motion can be found in many applications such as pulmonary deposition, design of industrial ventilation, particle collectors, and electro-static precipitation. The various processes that affect particle motion in a Reld are shown inFigure 3.
Medium Resistance
For a small spherical particle moving in a medium at low velocities (i.e. laminarSow), the drag (medium resistance) force acting on the particle is given by Stokes’ Law as:
FR"3mDpVpm"CDm
AV2
pm
2 [9]
where FR"medium resistance (N); Dp"particle diameter (m);m"medium density (kg m\3);m"
medium viscosity (kg m\1s\1); V
pm"relative velo-city between particle and medium (m s\1);A"
pro-jected area of particle normal to its motion (m2).
It is useful to relate the magnitudes of the inertial and viscous forces in the form of a dimensionless Reynolds’ Number as:
Rep"m
DpVpm
m [10]
The relationship between the drag coefRcient CD and the Reynolds’ Number can be found in any
Suid mechanics textbook. However, for spheres with Rep(1,CD"24/Rep.
In Rnite containers a particle experiences an in-crease in the drag force due to two effects. First theSuid streamlines around the particle impinge on the container walls and are reSected back causing increased drag on the particle. The second effect occurs because the Suid is stationary at aRnite dis-tance from the particle, and there is a distortion of the
Sow pattern which reacts back on the particle. Taking into consideration these two effects, the drag force may be modiRed as:
FR"3mDpVpm
1#kDp
L
[11]whereL represents the distance from centre of par-ticle to the container walls andk"0.563 for a single wall or container bottom andk"2.104 for a cylin-drical container.
Particle Motion
Particle motion in a gravitational/dragVeld The lin-ear motion of a particle in a directionXrelative to time t and under the inSuence of the drag, gravi-tational, and buoyancy forces is governed by:
6pD
3
p
d2Xdt2
"
6(p!m)D
3
pg!3mDp dX
dt
[image:3.568.49.281.622.692.2]wheregdenotes gravitational acceleration. If the par-ticle starts from zero velocity it will accelerate until it reaches a terminal velocity given by:
dXdt
t"Vgt"
D2
p(p!m)
18m
)g [13]from which the particle diameter can be expressed as:
Dp"
18m(p!m)g)Vgt
1/2
[14]
Note that eqns [12] to [14] are applicable forRep(1. For a particle settling in air, it is usual to neglect the buoyancy correction, sincepis of the order of unity, the air density is of the order of 10\3g cm\3, and
viscosity of ambient air is 1.8;10\5kg m\1s\1.
Equation [13] reduces to:
Vgt"3.03;104pD2p [15]
whereVgt,p, andDpare expressed in m s\1, kg m\3, and m, respectively.
Particles with diameters less than or close to the mean free path of the Suid molecules begin to slip between molecules and settle at a higher velocity than that predicted by eqn [13] for settling velocity. Cun-ningham considered this so-called slip effect and introduced a correction term to the terminal settling velocity as:
Vgtc"CcVgt [16]
Cc"
1# 2Dp
[17]
where Cc denotes the Cunningham slip correction factor,is the mean free path of medium molecules, andis a constant of approximately one.
Particle motion in a rotational (centrifugal)Veld In a centrifugalReld the radial motion of a particle at a distanceRfrom the centre of rotation is governed by:
6pD
3
p
d2Rdt2
"
6(p!m)D
3
p 2R!3mD
p dR
dt
[18]
where is the angular velocity of the particle. Assum-ing that the particle movement outward is resisted by viscous drag, Stokes’ law provides a reasonable ap-proximation for the drag. Therefore, the terminal radial velocity at equilibrium is given by:
dRdt
t"Vrt"
D2
p(p!m)
18m
)2R [19]
which is equivalent to eqn [13].
To evaluate the performance of a centrifugal separ-ation process, a separsepar-ation factor ‘SF’, deRned as the ratio of centrifugal acceleration to gravitational acceleration:
SForg-force"
2R
g [20]
is used. For dust-collecting cyclones (particles
'100m), SF"200, while conventional centri-fuges used in precipitation of submicron particles and large molecules in liquid suspension haveSF"5000. See II/PARTICLE SIZE SEPARATION/Hydrocyc-lones for Particle Size Separation.
Particle motion in an electrostaticVeld When par-ticles larger than 1m are passed through a corona discharge as the result of bombardment charging, they acquire charges from electrons and adsorbed gas ions proportional to the surface area of the particle. The saturation charge acquired is given by:
Qpb"ne"01D2pE [21]
" 32
2#21
[22]
where Qpb"saturation bombardment charge ac-quired (C);n"number of electron charges acquired; e"electron charge (1.6022;10\19C);
0"
permit-tivity of vacuum (8.8542;10\12F m\1);
1"
rela-tive permittivity of medium (gas); 2"relative
permittivity of particle material;E"external electric
Reld strength (V m\1). For particles less than 0.2m,
diffusion charging predominates and the charges acquired at timetare given approximately by:
Qpb"ne"
DpkT
2e ln
1#DpViN0e2
2kT t
[23]where Qpd"diffusion charge acquired (C);
k"Boltzmann constant (1.3807;10\23J K\1);
T"absolute temperature (K);N0"ion density (ions
m\3); V
i"ion velocity (root mean square, m s\1). Based on the acquired charge on the particle and assuming that air resistance is approximated by Stokes’ Law, the particle terminal velocity in an elec-tricReld is given by:
Vet"Cc
EQp 3mDp
[24]
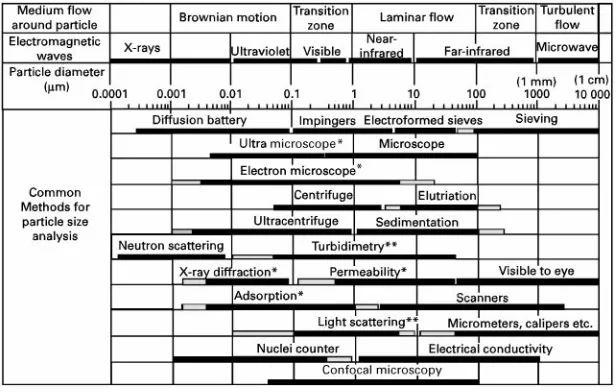
Figure 4 Common methods of particle size analysis.HAverage particle diameter but not size distribution.HHSize distribution may be obtained by special calibration.
Particle motion in a thermal gradient Veld It has been observed that particles in suspension move from hotter to colder regions. Later it has been shown that in a thermal gradient Reld and at atmospheric pres-sure, the thermal force acting on a particle is given by:
Ft"(!9)
Dp
2
2
m
mT
2#p
m
\1
dTdx
[25]
where p"thermal conductivity of the particle ma-terial (J m\1s\1K\1); m"thermal conductivity of
the air (J m\1s\1K\1); T"absolute temperature
(K); dT/dx"temperature gradient in the air (K m\1).
The negative sign in the equation indicates that the force is in the direction of negative thermal gradient. By setting the thermal force equal to the resistive force of the medium, the terminal velocity of a par-ticle is given as:
Vtt"(!1.5)
Ccm
mT
2#p
m
\1
dTdx
[26]The particle velocity and the Sow velocity and geo-metrical conRguration are used in the design of ther-mal precipitators.
Common Methods of Particle Size
Analysis and Particle Size Ranges
To assist in covering the scope of the different techniques used in particle size analysis, an attempt was made to survey the current literature on particle
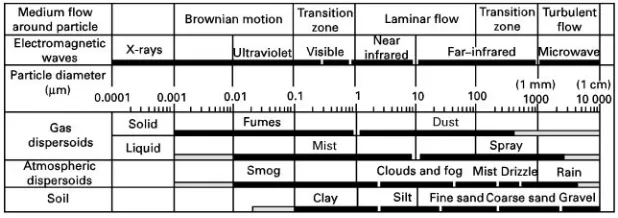
size analysis techniques. The results of this investiga-tion are summarized inFigure 4. It should be empha-sized that this summary is not exhaustive. There are other sophisticated techniques which are outside the scope of this article. Of more importance is the
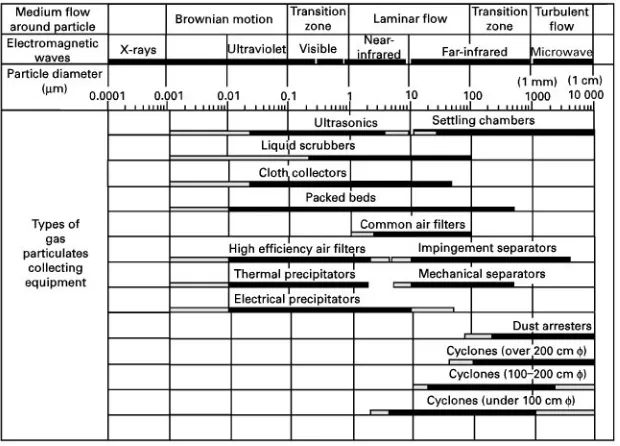
identi-Rcation of the size ranges of most common particles found in industrial, environmental, chemical and clinical applications (Figure 5). From an industrial point of view, the different types of gas partic-ulate collecting equipment are summarized in Figure 6. Some basic deRnitions of particle size ranges of gas and atmospheric dispersoids and soil are in-cluded inFigure 7.
Mechanical Techniques for Particle
Size Analysis
Based on the information given in Figures 4}7, it can be seen that the most common mechanical techniques for particle size analysis relevant to analytical sciences and industrial applications are: sieving, sedi-mentation (gravitational or centrifugal), elutriation, electrostatic precipitation, thermal precipitation, hy-drodynamic chromatography and impaction. Each technique will be brieSy presented; the details of each technique can be found in the references listed in the bibliography.
Sieving
Figure 5 Typical particles and gas dispersoids.
Figure 6 Different types of gas particulates collecting equipment (, diameter). Micromesh sieves are used to classify particles of size
range 5}20m, while particles of size range 20}125m are classiRed in the standard woven wire sieves. Coarse particles ('125m) are classiRed in
[image:6.568.132.442.467.690.2]Figure 7 Some size range definitions.
Table 1 International sieve standards
Country Standard Sieve type
Great Britain BS 410 Woven wire
USA ASTM E11 Woven wire
ASTM E161-607 Micromesh (electroformed)
Germany DIN 4188 Woven wire
DIN 4187 Perforated plate France AFNOR NFX 11-501 Woven wire International ISO R565 1972(E) Woven wire
[image:7.568.289.518.615.709.2]Perforated plate
Table 2 Sedimentation methods and techniques Incremental methods Cumulative methods
Solids concentration variation Sedimentation rate
Line start Line start
Homogeneous suspension Homogeneous suspension
Suspension density variation List start
Homogeneous suspension The sieving test is conducted using up to 11 sieves
stacked with progressively larger aperture openings towards the top, and placing the powder on the top sieve. A closed pan (receiver) is placed at the bottom. There are several schemes for shaking the sieves by mechanical or ultrasonic means. The residues in each sieve are recorded and expressed in percentage as cumulative values against the nominal sieve aperture values.
The common methods forRne sieving are machine, wet, hand and air-jet sieving. Wet-sieving is recom-mended for material originally suspended in a liquid and is necessary for powders which form aggregates when dry-sieved. In such tests the stack of sieves is
Rlled with liquid and the sample is fed to the top sieve. Sieving is accomplished by rinsing, vibration, recip-rocating action, vacuum, ultrasonication or a combi-nation of these.
Table 1 presents the different international sieve standards and the corresponding sieve types. There are several sieve aperture progression ratios commonly available depending on the different international standards. In the USA, a progression ratio of 21/2is used. This ratio corresponds to
success-ive particle groups of 2 : 1 particle surface ratio. The progression rate of 21/3 (100.1) which has been
adopted by the French corresponds to successive par-ticle groups of 2 : 1 parpar-ticle volume ratio. The progression ratios of 100.1and 100.05are
recommen-ded for narrow size distributions.
The probability of a particle passing through sieve apertures depends on the particles size distribution, the number of particles on the sieve (sieve loading), the method of sieve shaking, the dimension and shape of the particle, and the ratio of open area of sieve to total area. In addition, the sieving operation can be affected by the friability and cohesiveness of the powder.
Sedimentation
Sedimentation ofRne powders in a suspension is an important tool in the determination of particle size distribution.Table 2 presents a classiRcation of the methods and techniques used in sedimentation (gravitational or centrifugal). To conduct particle size analysis using sedimentation, the suspension can be prepared using the line start (two-layer) or the homo-geneous suspension techniques. In the two-layer technique, the powder is introduced at the top of a column of clear liquid. In the homogeneous suspen-sion technique, the powder is uniformly dispersed in the liquid. As the particles start to settle the change in solids concentration at a particularRxed height with time or the sedimentation time rate is measured. The solids concentration or density measurements is used in the incremental methods, while the settling rate measurement is used in the cumulative methods. In-cremental methods may be divided asRxed time and
Rxed depth methods, the latter being more popular, although a combination is sometimes used.
Figure 8 Main gravitational sedimentation techniques. primary particles are crystalline or organic structures bound together by molecular bonding, while the aggregates are primary particles tightly bound to-gether at their point of contact by atomic or molecu-lar bonding. The force required to break these bonds is considerable. In case of agglomerates, the primary particles are loosely bound together with weak van der Waals forces. It is often necessary to disperse the powder in a liquid prior to analysis. Dispersion is affected by the use of wetting agents which break down the agglomerates to their constituent parts. This process is facilitated by mechanical or ultrasonic agitation.
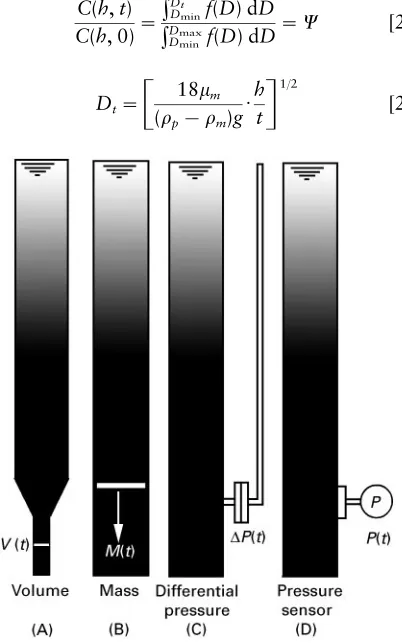
Gravitational sedimentation In gravitational sedi-mentation there are four main techniques: volume sample, mass sample, manometry and sedimentation vessel-wall pressure sensing as shown schematically inFigure 8.
Incremental methods Based on the results of motion of a particle in a gravitational/drag Reld, it can be shown that the solids concentration of settling sus-pension at depth hcan be related to the cumulative undersize mass distribution as:
C(h,t) C(h, 0)"
Dt
Dminf(D) dD
Dmax
Dmin f(D) dD
" [27]
Dt"
18m (p!m)g)h t
1/2
[28]
where dm(D)"f(D)dDrepresents the mass fraction having particle size betweenDandD#dD. In eqns [27] and [28], it is assumed that the volume of par-ticles (powder) in suspension is very small compared with the total volume of suspension. By plotting 100against the free-falling particle diameterDtthe resulting curve shows the cumulative undersize per-centage curve by mass.
Similarly, it can be shown that:
C(h,t) C(h, 0)"
(h,t)!m
(h, 0)!m" [29]
where(h, 0) and(h,t) are the suspension density at a height h at t"0 and t"t, respectively. By plotting 100againstDt, the resulting curve shows the cumulative undersize percentage size curve.
The pipette method In this method, the changes in concentration occurring within a settling suspension are determined by drawing off deRnite volumes at a set of discrete intervals of time by means of a pipette. The solids concentration in the suspension is required to be between 0.2 and 1.0 vol%. If the con-centration exceeds 1% the hindered settling adversely affects the results of the analysis. Initially the powder is made into a paste; this is followed by slow addition of the dispersing liquid, using a spatula plus mixing, to form a slurry. Further dispersion may be carried out in an ultrasonic bath. The suspension is washed into a sedimentation vessel. The analysis starts with violent agitation of the vessel avoiding the use of a stirrer. It is recommended that the container be continually inverted by hand for 1 min. Since ini-tially the particles are not at rest, it is advisable to wait 1 min before withdrawing samples. The use of a time scale progression of 2 : 1 which produces a 21/2particle size progression is recommended. The
collected samples are prepared to determine the solids concentration for particle size cumulative mass determination.
Hydrometers and divers The variation in density of settling suspension may be monitored with hydro-meters, a method used widely in the cement industry. The method starts with a fully dispersed suspension and the densities at known depths are recorded as the solid phase settles out. The hydrometer technique is useful for quality control but not as an absolute method.
Sealed in each diver is a copper ring which enables an external search coil to monitor and determine the location of the diver using high-frequency alternating current.
The speciTc gravity balance The speciRc gravity bal-ance may be used to monitor the change within a sett-ling suspension. Such a balance comprises two bobs, one in clear Suid and the other in the suspension being studied. The bobs are connected to the two arms of a beam balance. The depth of immersion of the bobs is adjustable. The change in buoyancy is counterbalanced by means of solenoids which are connected to a pen recorder. From the trace of the pen recorder, the particle size distribution can be calculated.
Cumulative methods Cumulative methods have an advantage over incremental methods in that the amount of sample required is small (about 0.5 g), which reduces the interaction between particles. This is a useful feature when only a small quantity of powder is available or when dealing with toxic materials.
Line start method In this case the size distribution may be directly determined by plotting the fractional weight settled against the free-falling diameter of par-ticles. Special care needs to be exercised to eliminate the streaming problem, especially when the suspen-sion at the top has higher density than the liquid.
Homogeneous suspension method Let us consider a powder with a mass distribution such that dM" f(D)dD, where dM represents the fractional mass of particles having a diameter betweenD andD#dD. Let us assume that the powder is completely dispersed in a liquid, and consider a suspension chamber of heighth. It can be reasoned that mass per centPwhich has settled out at timetis made up of two parts:
(1) all the particles with a free-falling speed greater than that ofDtas given by Stokes’ Law or some related law, whereDtis the size of particle which has a velocity of fallh/t:
(2) particles smaller than Dt which started off at some intermediate position in the chamber. The falling velocity of one of these smaller particles is , the fraction of particles of this size that have fallen out at timetis (t/h).
This mechanism can be represented mathematically as:
P"
Dmax
Dt
f(D) dD#
Dt
Dmin
t
hf(D) dD [30]
which after some manipulation can be rewritten as:
P"M#tdP
dt [31]
eqn [31] may be written in a different form as:
M"P! dP
d ln(t) [32]
Both eqns [31] and [32] can be used to determineM. The most obvious way is to tabulate t and P, and hence derive dP, dt, and Rnally M (cumulative per-centage oversize) versus Dt. Equation [32] is recommended in cases of wide size distribution.
Centrifugal sedimentation Gravitational sedi-mentation for particle size analysis has limitedS exi-bility. Firstly, the only means of varying the particle velocity is by selecting a medium with different density or viscosity. Secondly, gravitational sedimenta-tion cannot handle particles smaller than 5m. Thirdly, most sedimentation devices suffer from the ef-fects of convection, diffusion and Brownian motion. These difRculties can be reduced by speeding up the settling process by centrifuging the suspension. Furthermore, by the use of a centrifugal
Reld, a substantially lower size limit and reduced analysis time can be achieved. As with gravitational methods the data may be cumulative or incremental and the sample may be homogeneous or two-layer.
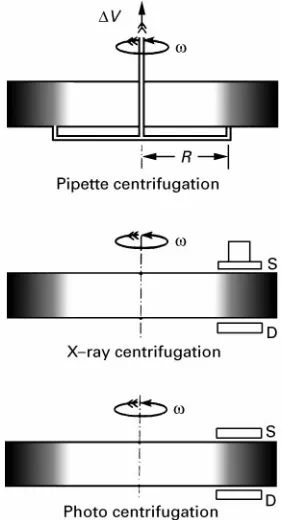
Calculations of size distribution from centrifugal data are more difRcult than calculations from gravitational data, since particle velocities increase as they move away from the axis of rotation (i.e. the particle velocity depends on its radial position). One way to overcome this difRculty is to use a rela-tively small settling radial zone at a far distance from the centre of rotation (i.e. the centrifugal force acting on all particles is approximately the same). Another solution is to use the line start technique. The most common techniques used in centrifugal sedimenta-tion are schematically presented in Figure 9 where SandD designate source and detector, respectively.
Line start method Rewriting eqn [19] as:
Vrt" dR
dt"
D2t(p!m)
18m
)2R [33]
together with separation of variables and integration of eqn [33], yields:
Dt"
18m
(p!m) 2t)ln
R
S
1/2
Figure 9 Main centrifugal sedimentation techniques.
where t is the time for a particle of size Dt to settle from the surface of the Rll (at distance S from the centre of rotation) to a radial distance R. Hence, at timet, all particles atRwill be of sizeDt. Monitoring the per cent solids or density of the sus-pension at speciRed intervals of time will produce the particle size distribution which can be repre-sented using cumulative values at different values ofDt.
Homogeneous suspension method Equation [34] still applies: however, at time t, all particles of size greater than Dt will have settled out radially to a distance R. Conversion of the sedimentation curve into a cumulative curve is not as simple in this case as for that of gravitational sedimentation.
Dif-Rculties involved in evaluating the sedimentation curve may be overcome in the case of a centrifugal
Reld by assuming a constant centrifugalReld, i.e. for (R!S) interval is small enough to allow the approximation:
ln
R S+(R!S)
R [35]
when the value (R!S) is one twentieth of R, the cumulative curve can be obtained directly by the pipette technique with an error of 1%.
Elutriation
In Suid classiRcation, the effects of different forces on the movement of suspended particles con-trol the separation of dispersed particles. As discussed in the kinetic behaviour of particles, theReld forces are gravitation, as with elutriators, or centrifugal or Coriolis force in classiRers. The medium is usually water or air. In general all Suid classiRers can be divided into two classes, counterSow equilibrium (elutriation) and inverseSow separation. The elutri-ation is presented brieSy below.
In the elutriation technique, theReld and the drag forces act in opposite directions and particles leave the separation zone in one of two directions, depend-ing on their size. Particles of a certain size stay in equilibrium in the separation zone. The grading is carried out in a series of vessels (cylindro-conical form) of successively increasing diameter. Hence, the
Suid velocity decreases in each stage, the coarse par-ticles being retained in the smallest vessel and the relativelyRner particles in the following vessels. For air elutriation, the analysis is considered complete if the rate of change of weight in residues is less than 0.2% of the initial weight in half an hour, and for water elutriation the analysis ends when there is no sign of further classiRcation.
Using Stokes’ Law, the particle size retained in an intermediate vessel can be predicted approximately as
Dp"
18m(p!m)g)Vmax
1/2
[36]
Vmax"2V"2
Q
A [37]
where Q"volumetric Sow rate, A"vessel cross-sectional area at the equilibrium zone. In eqn [37] it is assumed that the Sow proRle in the vessel is para-bolic. It is clear that elutriation is only suitable for rough dispersions. With small particles, sedimenta-tion may be speeded up by using a centrifuge. This technique is utilized when classifying aerosols using a stream of air whichSows in the direction opposite to the centrifugal force.
Electrostatic Precipitation
mag-Figure 10 Thermal precipitation.
Figure 11 Cascade impactor. nitude of this current is proportional to the number of
particles deposited. Particle sizes can be determined by varying theSow rate or applied potential.
ClassiRcation in an electrostatic Reld by differ-ences in charge is related explicitly to particle size. This type of instrument has been used for collecting aerosol bacteria. The instrument consists of a glass cylinder with a central electrode. The inner surface of the cylindrical glass is coated with a suitable mater-ial to act as the other electrode and to collect samples. The principal advantages of this type of instrument are high collection efRciency over a wide size range, low resistance and high Sow-rate capacity.
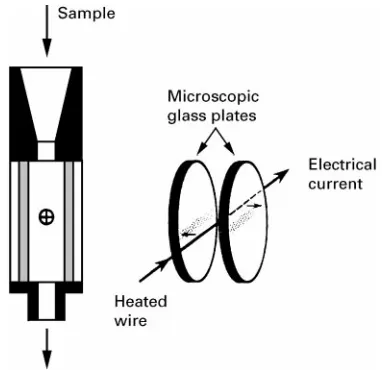
Thermal Precipitation
Particles in a thermal gradient medium move in the direction of negative gradient, i.e. from hotter to colder regions. Based on this principle, the instrument typically consists of two parallel round microscopic plates and a heated wire in between as shown in Figure 10. The sample is drawn between the plates and the particles deposit on the glass plates and are collected for further analysis.
Normally a sampleSow of 1}2 cm3s\1is
recom-mended and the collection efRciency is high for particles smaller than 5m. The collecting device may be modiRed so that the sample is collected dir-ectly on an electron microscope grid. ModiRcations of the basic design include means of centering the wire in position, substitution of the wire by a ribbon to give more uniform deposits, and using inlet elut-riators to exclude coarse particles. The practical ap-plication of thermal precipitation in gas cleaning plants has only rarely been attempted.
Impaction
Impactor Inertial impaction devices cause an air sample to be drawn into a round or rectangular nozzle where the gas velocity is substantially increased. The jet from the nozzle is discharged against an adjacent Sat surface, causing the air to diverge sharply. Particles in the air have more inertia than the air, and tend to continue forward as the air passes off to the sides, causing some of the par-ticles to impact onto the surface. To prevent the particles from re-entrainment, a viscous material such as siliconeSuid (or substrate) is used to coat the plate. The efRciency of impaction may be deRned in terms of the dimensionless impaction factor as:
I"
CcpD2
paVj 18mDj
1/2
[38]
whereDpa"particle aerodynamic diameter:Dj"jet diameter or width:Vj"average air velocity at the jet outlet.
[image:11.568.69.260.504.689.2]diameter as:
Dpa"DStokes1p/2 [39]
whereDStokesis the measured diameter. The
aerody-namic size is important because it controls the motion of a particle in an air stream. Therefore, it is signiR -cant for studies concerning lung inhalation, spray effectiveness, and gaseous cleaning devices. A special duty impactor (Rve-stage cascade impactor) has been developed for sampling and grading acid mists in the size range 0.3}3m.
Impinger Another sampling instrument, referred to as an impinger, also utilizes inertial impaction: how-ever, deposition occurs at the bottom of a liquid-containing vessel. The downward-directed air-jet dis-places the liquid and uncovers the bottom of the vessel. The particles that impinge against the wet surface are subsequently washed off by the liquid. The undeposited particles may be caught as air bubbles rise through the liquid. The particles are usually examined in the liquid suspension. Water is the most commonly used liquid.
Hydrodynamic Chromatography
Size information about colloidally suspended par-ticles (0.01}1m) can be obtained by employing hy-drodynamic chromatography (HDC). A medium (an aqueous solution) is pumped through a column packed with impermeable spheres. A pulse of collo-idal suspension (0.2 cm3) containing about 0.01 wt%
polymer is injected into the Sowing stream of the column entrance. The mobile phase from the column efSuent is passed through a suitable detection system, such as aSow through spectrophotometer of the type used in liquid chromatography, and the de-tector response of the colloid is determined as a func-tion of elufunc-tion time. An extra step is needed to deter-mine the concentration of solids in the eluted solution. It has been observed that the larger particles elute faster than the small ones. It has also been found that the smaller the packing diameter the better the separ-ation. Other factors which affect the rate of transportation through the bed are the size of bed particles, the ionic strength, and Sow velocities, as well as the particle size of eluting particles.
In general, HDC has been successfully applied to the size characterization of a number of polymer lattices. The method is applicable to the size separ-ation of particles between 0.02 and 1m, if they are rigid. Moreover, it is expected that HDC has wide applicability to sub-m particles such as in lattices, carbon black, colloidal silica, paint, and
photo-graphic pigments, dyes, food colours, natural and artiRcial blood, and metallic fumes.
Another extension of HDC is to replace the packed bed with a long capillary. Capillary particle chro-matography (CPC) requires 30 kPa pressure and has a separating range of 0.2}200m. In such techniques the particle transit time is a logarithmic function of particle size.
Liquid Particle Size Measurement Techniques
In the areas of combustion and chemical processes and in the pharmaceutical and agriculture industries, measurement of droplet size and velocity distribu-tions is important. In one respect the measurement of droplets is easier than that of solid particles because droplets are usually spherical and smooth. In another respect the measurement of droplets is more difRcult because they are not easy to collect and stabilize, and they may be volatile. Thus, anin situmeasurement is usually preferable. The applica-tions commonly used can be grouped as spray diag-nostics (using ensemble scattering techniques and op-tical single-particle analysis) and spray measurement.
Acknowledgement
This work was supported in part by the Federal Panel on Energy Research and Development (PERD).
See also: II / Chromatography: Hydrodynamic Chroma-tography. Flotation: Cyclones for Oil/Water Separations; Historical Development; Oil and Water Separation. Par-ticle Size Separation: Electrostatic Precipitation; Field Flow Fractionation: Thermal; Hydrocyclones for Particle Size Separations; Sieving/Screening.
Further Reading
Allen T (1997) Particle Size Measurement, 5th edn. New York: Chapman and Hall.
Barth HG (ed.) (1984) Modern methods of particle size analysis. In:Chemical Analysis(A Series of Monographs on Analytical Chemistry and its Application) pp. 1}75, vol. 73. New York: John Wiley.
Barth HG and Sun ST (1985) Particle size analysis. Analyti-cal Chemistry57, 151R}175R.
Barth HG, Sun ST and Nikol RM (1987) Particle size analysis.Analytical Chemistry59: 142R}162R. BoKhm J (1982) Electrostatic Precipitators. New York:
Elsevier.
Hirleman DE, Bachalo WD and Felton FG (eds) (1990) Liquid Particle Size Measurement Techniques, vol. 2. American Society for Testing and Materials, STP; 1083. Kaye BH (1981) Direct Characterization of Particles.
New York: John Wiley.
Mandelbrot BB (1983)The Fractal Geometry of Nature. San Francisco: W. Freeman Publishers.
Miller BV and Lines R (1988) Recent advances in particle size measurement: a critical review.Critical Reviews in Analytical Chemistry20(2): 75}116.
Oglesby S Jr and Nichols GB (1978)Electrostatic Precipita-tion. New York: Marcel Dekker Inc.
Provder T (ed.) (1998) Particle Size Distribution III, Assess-ment and Characterization.ACS Symposium Series693, ACS.
Salama AIA and Mikula RJ (1996) Particle and suspension characterization. InSuspensions:Fundamentals and Ap-plications in the Petroleum Industry. Advances in Chem-istry Series 251, ACS.
Silverman L, Bellings CE and First MW (1971)Particle Size Analysis in Industrial Hygiene. New York: Academic Press.
Syvitski James PM (1991)Principles,Methods and Applica-tions of Particle Size Analysis. Cambridge: Cambridge University Press.
MEDICINAL HERB COMPOUNDS:
HIGH-SPEED COUNTERCURRENT
CHROMATOGRAPHY
T. Zhang, Beijing Institute of New Technology Application, Beijing, China
Copyright^ 2000 Academic Press
Introduction
Medicinal herbs are an important source of natural products for medicine. They include various chemical components ranging from fat-soluble to water-soluble compounds. The isolation of the biologically active components is the starting point of further research in chemistry and pharmacology as well as in the utilization of these compounds.
Traditional Chinese medicine is an extremely rich source of the experience acquired over a long period of time. In order to make greater use of traditional Chinese medicine, modern scientiRc methods are used to Rnd the bioactive compounds in the traditional drugs and to use them as leading compounds for new drug design. New drugs developed in this way include anisodamine and the antimalarial agent Qinghaosu (artemisine).
For separating and purifying bioactive compounds from medicinal herbs, modern chromatographic tech-niques, such as gas chromatography, high perfor-mance liquid chromatography, thin-layer chromatog-raphy and electrophoresis have signiRcantly raised the technical level and have shortened the time re-quired for research projects.
High speed countercurrent chromatography (HSCCC) has been recognized as an effective means for separation and puriRcation of a wide variety of bioactive components. It is a liquid}liquid partition chromatography system based on a coil planet centri-fuge system without the use of any solid support. This technique has developed rapidly during the past
dec-ade. It has been demonstrated to have preparative capabilities and unique properties for fractionating a variety of natural products and medicinal herbs.
Here some applications of the separation of bio-active compounds, such as alkaloids andSavonoids, in medicinal herbs by HSCCC are described.
Separations of Alkaloids
Separations of Alkaloids Extracted from Stephania tetrandra S. Moore
Dried roots ofStephania tetrandraS. Moor (Menis-permaceas) or Fenfangji in Chinese is a traditional Chinese drug used for rheumatism and arthritis. The total active alkaloid content in the natural products is 2.3%. Three major alkaloids have been identiRed as tetrandrine (I, 1%), fangchinoline (II, 0.5%) and cyc-lanoline (III, 0.2%). I and II are inseparable by con-ventional methods, while III is well separated from the other two. As illustrated inFigure 1, I and II are both bisbenzylisoquinoline alkaloids, whereas III is a water-soluble quaternary protoberberine-type alkaloid.
A sample solution was prepared as a mixture of I and II with puriRed III to obtain a 10 : 5 : 2 weight ratio to simulate their composition in the natural drug. 3 mg of this sample was dissolved in 0.5 mL of the upper stationary phase of the selected solvent system. The solvent system was composed of n-hexane/ethyl acetate/methanol/water at two dif-ferent volume ratios of 3 : 7 : 5 : 5 in theRrst experi-ment and 1 : 1 : 1 : 1 in the second. In both cases the lower phase was used as the mobile phase at aSow rate of 60 mL h\1 in the normal elution mode. The