R E S E A R C H
Open Access
Dietary patterns of university students in
the UK: a cross-sectional study
E. F. Sprake
1, J. M. Russell
2, J. E. Cecil
3, R. J. Cooper
4, P. Grabowski
1, L. K. Pourshahidi
5and M. E. Barker
6*Abstract
Background:University represents a key transition into adulthood for many adolescents but there are associated concerns about health and behaviours. One important aspect relates to diet and there is emerging evidence that university students may consume poor quality diets, with potential implications for body weight and long-term health. This research aimed to characterise dietary patterns of university students in the UK and their sociodemographic and lifestyle antecedents.
Methods:An online, cross-sectional survey was undertaken with a convenience sample of 1448 university students from five UK universities (King’s College London, Universities of St Andrews, Southampton and Sheffield, and Ulster University). The survey comprised a validated food frequency questionnaire alongside lifestyle and sociodemographic questions. Dietary patterns were generated from food frequency intake data using principal components analysis. Nutrient intakes were estimated to characterise the nutrient profile of each dietary pattern. Associations with sociodemographic variables were assessed through general linear modelling.
Results:Dietary analyses revealed four major dietary patterns:‘vegetarian’;‘snacking’;‘health-conscious’; and‘convenience, red meat & alcohol’. The‘health-conscious’pattern had the most favourable micronutrient profile. Students’ gender, age, year of study, geographical location and cooking ability were associated with differences in pattern behaviour. Female students favoured the‘vegetarian’pattern, whilst male students preferred the ‘convenience, red meat & alcohol’ pattern. Less healthful dietary patterns were positively associated with lifestyle risk factors such as smoking, low physical activity and take-away consumption. The health-conscious pattern had greatest nutrient density. The‘convenience, red meat & alcohol’pattern was associated with higher weekly food spending; this pattern was also identified most consistently across universities. Students reporting greater cooking ability tended towards the‘vegetarian’and‘health-conscious’patterns.
Conclusions:Food intake varied amongst university students. A substantial proportion of students followed health-promoting diets, which had good nutrient profiles obviating a need for dietary intervention. However, some students consumed poor diets, incurred greater food costs and practised unfavourable lifestyle behaviours, which may have long-term health effects. University policy to improve students’diets should incorporate efforts to promote student engagement in cooking and food preparation, and increased availability of low cost healthier food items.
Keywords:Food consumption, Principal components analysis, Survey, University students
* Correspondence:[email protected]
6Food & Nutrition Group, Business School, Sheffield Hallam University, Sheffield S1 1WB, UK
Full list of author information is available at the end of the article
Background
University students represent a substantial proportion (50%) of the UK young adult population [1] and an indi-vidual’s university career may be influential in the estab-lishment of long-term eating patterns and thus chronic disease risk. This population also represents a group of young adults with a set of unique factors driving dietary in-take: the transition to university life may be associated with increased autonomy over food choice, small food budgets, and exposure to new social groups and food cultures.
A limited body of data indicates that the dietary be-haviours of UK university students are not conducive to either short- or long-term health. Alcohol consumption has received most research attention revealing that binge drinking is endemic [2,3]. There are also indications of high intakes of confectionery and fast foods, and low consumption of fruit and vegetables [3, 4]. Although there is some evidence that dietary behaviours track from adolescence to adulthood [5,6], the transition from home to university life has been associated with un-favourable changes to food intake: increases in alcohol and sugar intake, and decreases in fruit and vegetable consumption have been reported [7].
Additionally, the first year of university life has been identified as a period associated with body weight gain in both North American [8] and UK students [9, 10]. Such weight gain may have long-term repercussions, since overweight during young adulthood has been iden-tified as a significant predictor of obesity later in life [11]. Furthermore, high rates of body dissatisfaction and dieting behaviours have been noted, particularly amongst female students [12,13]. Such engagement in dieting be-haviour and dysfunctional relationships with food not only impact on dietary adequacy [14, 15], but may also create tension and conflict for young people as they de-velop relationships with new peer groups [16].
Dietary studies of British university students are con-strained by crude dietary assessment, small sample size and generally focus on a single university [3,4]. Further-more, their analytical approach has been on single foods and/or nutrients, which has allowed assessment of intake relative to dietary recommendations. Using multivariate statistical techniques to identify dietary patterns through intake of multiple interrelated food groups captures the complexity and multidimensional nature of diet, which is representative of real life food consumption [17]. This approach also allows greater insight into the different patterns of food consumption that naturally occur within a population and facilitates identification of sub-groups who may be most in need of health promotion efforts. Universities in particular may represent a setting in which dietary behaviours are open to change and large groups of young adults can be reached, representing an appropriate target for health promotion efforts. A dietary
patterns approach has been used widely in various UK population groups, but has not been employed to char-acterise the diets of university students.
This study aimed to identify dietary patterns that exist within a UK university student population, to assess the nutritional profile of these patterns, and to examine socio-demographic and lifestyle variables underpinning these patterns.
Methods Study design
This cross-sectional study involved a convenience sam-ple of five regionally and socio-economically diverse uni-versities throughout the UK (Uniuni-versities of: Sheffield, Ulster, King’s College London (KCL), Southampton and St Andrews). These universities had responded positively to an invitation to participate in the research study; con-tact was made via university Human Nutrition or Health Sciences departments. A web-survey, comprising a vali-dated food frequency questionnaire (FFQ) (Tinuviel Soft-ware Ltd., Warrington, UK) was used to assess dietary intake. Socio-demographic and lifestyle data were also col-lected. The survey was conducted between Autumn 2013 and Spring 2015. Data collection was preceded by a pilot study, which was used to refine the web-survey.
Ethical approval was obtained from each participating university. Informed consent for participation was ob-tained on the first page of the web-survey.
Subjects & recruitment
Participant eligibility
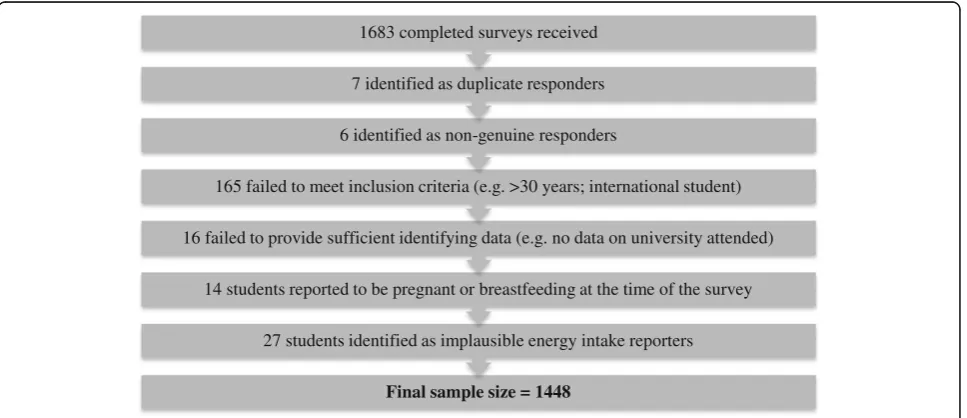
A total of 1683 students across the five universities responded to the survey. Figure1shows numbers of stu-dents excluded based on fulfilment of various eligibility criteria. The cut-offs for implausible energy intakes in the Nurses’ Health Study (< 500 Kcal/day and > 3500 Kcal/day) and Healthcare Professionals’Follow-up Study (< 800 Kcal/day or > 4200 Kcal/day) were used to identify and exclude participants reporting implausible energy intakes the current study. Using this method, 24 partic-ipants were identified as over-reporters (8 males; 16 females) and three participants were identified as under-reporters (1 male; 2 females). A total of 1448 students comprised the final sample.
Dietary data
A validated 111-item FFQ originally developed by the Medical Research Council was employed to assess diet-ary intake (DietQ; Tinuviel Software Ltd., Warrington, UK; [18,19]. The FFQ was piloted among 40 students at the University of Sheffield. Feedback from the pilot study led to three further items being incorporated into the questionnaire (consumption of hummus; tofu; water).
Frequencies of consumption in the questionnaire were expressed as follows: every day = 7/week, through to once per week = 1/week; once every 2–3 weeks (F) = 0.5/week; rarely/never (R) = 0. Where absolute quan-tities of consumption were given, these were converted into number of portions consumed per day. Food and nutrient intakes were generated directly from these FFQ data using the nutritional analysis software QBuilder (Tinuviel Software, Warrington, UK). The ori-ginal 111 foods/food groups listed in the FFQ were
condensed into 55 broader foods/food groups for dietary patterns analysis. These 55 foods/food groups are detailed in Additional file1: Table S1.
Socio-demographic, anthropometric and lifestyle data The following socio-demographic information was col-lected: age; gender; degree programme and year of study; full/part-time study; nature of term-time residence; eth-nicity; religion; socioeconomic status (SES); maternal education; and university attended. Information on dieting/ weight loss behaviour, supplement use, cooking ability (four response options from ‘able to cook wide range of meals from raw ingredients’ through to ‘unable to cook at all’), smoking status (students were asked to self-identify as a never smoker, ex-smoker, social smoker or regular smoker), self-reported physical activity levels (students were required to self-identify as not very active, moderately active or very active), body weight (kg) and height (m) (for calculation of body mass index (BMI), kg/m2), cooking behaviours (consumption of: meals made from raw ingredients; pre-prepared foods; ready meals and take-aways; and meals from university cafeteria) and weekly food ex-penditure (£) was also collected.
Identification of dietary patterns
To generate dietary patterns, the 55 food/food group intake variables were entered into a principal component analysis (PCA) and a varimax (orthogonal) rotation was performed. The number of components retained was determined by the scree plot, parallel analysis and component interpret-ability [20]. Food/food groups with factor loadings > 0.32 were used to interpret each dietary pattern.
Final sample size = 1448
27 students identified as implausible energy intake reporters 14 students reported to be pregnant or breastfeeding at the time of the survey 16 failed to provide sufficient identifying data (e.g. no data on university attended)
165 failed to meet inclusion criteria (e.g. >30 years; international student) 6 identified as non-genuine responders
7 identified as duplicate responders 1683 completed surveys received
[image:3.595.58.542.505.714.2]Statistical analysis
Pearson’s product moment correlation coefficients were calculated between pattern scores and absolute nutrient intakes. Partial correlation coefficients were also calcu-lated, which adjusted for energy intake. Correlation co-efficients ≥0.5 and≤ −0.5 were considered strong. Examination of scatter plots revealed no evidence of non-linear relationships between component scores and nutrient intakes.
General linear models (GLMs) were firstly fitted for demographic variables alone (model 1) and then with additional eating factors (model 2). Maternal education was not included in the models, since data were not available for all students. Religion was also not included due to confounding with ethnic background.
Variables were categorised into two groups for entry into a GLM: 1) demographic variables: gender, age, leisure-time physical activity, BMI, smoking, ethnicity, year of study, term-time accommodation, university attended, and full-time/part-time status 2) cooking- and eating-related variables: cooking ability, animal food consumption, frequency of consumption of meals pre-pared using raw ingredients, frequency of consumption of meals using pre-prepared foods, frequency of con-sumption of ready-meals and take-aways, frequency of consumption of meals from university cafeteria, fre-quency of skipping breakfast, frefre-quency of skipping lunch, and amount spent on food.
For each retained dietary component a GLM was fitted with demographic variables only (Group 1). A second GLM was then fitted, which included significant demo-graphic variables and variables from Group 2. Multi-comparison post-hoc tests with Sidak correction were carried out to aid interpretation of significant factors in the GLM. The Statistical Package for the Social Sciences (SPSS) Version 20 was used for all statistical analyses. Ap value of < 0.05 was considered significant.
Results
Participant characteristics
The sociodemographic characteristics of the sample are shown in Table 1. The sample comprised 1064 (73.5%) women and 384 (26.5%) men. The majority of students were White British (n = 911; 62.9%) and registered for full-time study (n = 1394; 96.3%). The mean age of the sample was 21.5 years (SD 2.63 years). The majority of re-spondents were from the University of Sheffield (n= 567; 39.2%), Ulster University in Northern Ireland (n= 443; 30.6%) and KCL (n= 305; 21.1%). The remaining students were from the Universities of Southampton (n= 79; 5.5%) and St Andrews, Scotland (n= 54; 3.7%). Just over one-third of students were studying a health-related de-gree. The majority of students (n= 1000; 69.1%) reported a
healthy BMI (18.5–24.99 kg/m2
); mean BMI was 22.8 kg/m2 (SD 4.64 kg/m2).
In terms of eating behaviours of the sample, just under two-thirds of students described themselves as regular meat-eaters, whilst approximately 10% of students iden-tified themselves as vegetarian. Just over half (55%) of students reported that they were able to cook a wide range of meals from raw ingredients, and 73% consumed self-cooked meals from raw ingredients‘every’ or ‘most’ days. One in four students reported that they consumed meals cooked from pre-prepared foods, which could be assumed to represent convenience foods,‘most days’ or ‘everyday’. Approximately 30% of students reported that they skipped breakfast at least most days. Just less than one quarter of students spent less than £20 on food each week; a weekly food budget of £20–29 was most com-mon. Almost one in five students spent over £40 on food each week. Full details are provided in tabular form in Additional file1: Table S2).
Dietary patterns
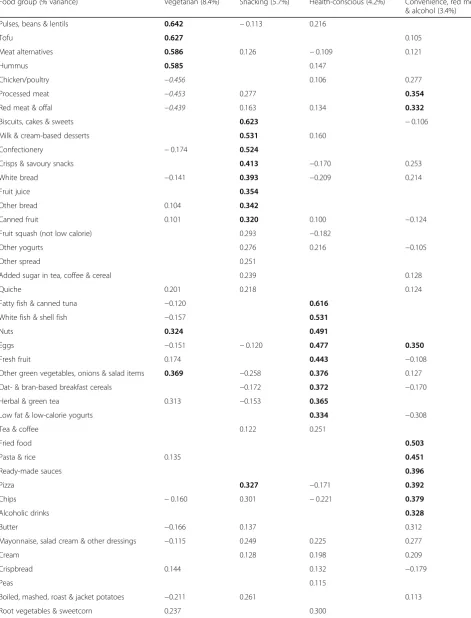
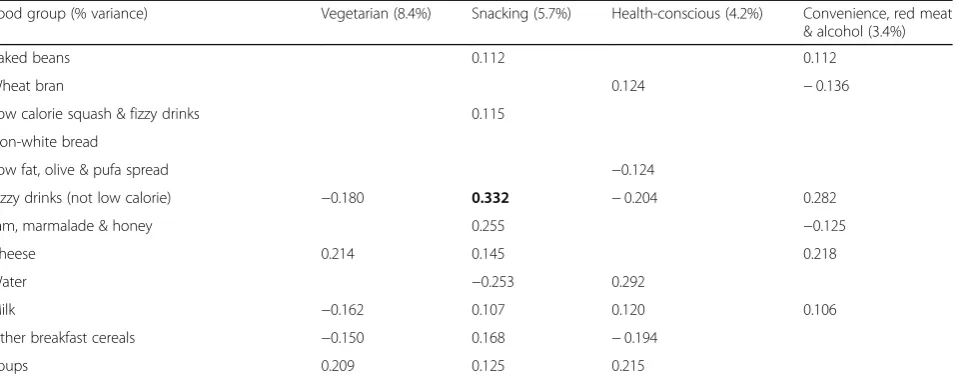
Four principal components were retained, which ex-plained 21.7% of the total variance in food intake. The first component explained 8.4% variance; the three remaining components explained 5.7%, 4.2% and 3.4% of the variance in food intake respectively. Table 2 shows the factor loadings of each of the food groups in the four dietary components retained.
fourth component was labelled‘convenience, red meat & alcohol’, because it had high factor loadings for red meat and savoury foods requiring little or no preparation, and it was the only component with a positive loading on al-coholic drinks. There were also high factor loadings for fried food, pasta and rice, ready-made sauces, pizza, chips, alcoholic drinks, processed meat, red meat and offal, and eggs; there was a strong negative factor load-ing for low fat/low calorie yogurts.
Correlational analyses
[image:5.595.61.297.102.714.2] [image:5.595.299.534.111.502.2]Pearson’s correlation coefficients between dietary pat-tern scores and energy intake were calculated. These are displayed in Table 3. There was a weak negative correlation between the ‘vegetarian’ pattern and energy intake (r=−0.096;p< 0.01), but a weak positive correl-ation between the‘health-conscious’pattern and energy
Table 1Socio-demographic characteristics of the sample
Number Percentage (%)a
Gender
Male 384 26.5
Female 1064 73.5
Age (years)
17–21 873 60.3
22–25 412 28.5
26–30 163 11.3
BMI (kg.m−2)
< 18.5 112 7.7
18.5–24.9 1000 69.1
25–29.9 220 15.2
≥30 76 5.2
Leisure-time physical activity
Not very active 473 32.7
Moderately active 748 51.7
Very active 227 15.7
University attended
University of Sheffield 567 39.2
Ulster University 443 30.6
KCL 305 21.1
University of Southampton 79 5.5
University of St Andrews 54 3.7
Faculty of study
Arts 252 17.4
Social science 285 19.7
Engineering 109 7.5
Science 212 14.6
Medicine and health 521 36.0
Full or part time status
Full time 1394 96.3
Part time 54 3.7
Year of study
1st year undergraduate 489 33.8
2nd year undergraduate 301 20.8
3rd year undergraduate 264 18.2
4th or higher year undergraduate 136 9.4
Postgraduate 245 16.9
Other 13 0.9
Term-time residence
University catered accommodation 58 4.0
University self-catered accommodation 340 23.5
Private accommodation with other friends/students
610 42.1
Private accommodation on own 63 4.4
Table 1Socio-demographic characteristics of the sample
(Continued)
Number Percentage (%)a
With parents/relatives 205 14.2
With partner 107 7.4
With parents/partner & children 48 3.3
With children only 9 0.6
Other 8 0.6
Ethnic background
White British 911 62.9
White Irish 235 16.2
Other White ethnicity 139 9.6
Mixed ethnicity 45 3.1
Asian/Asian British 69 4.8
Black/African/Caribbean/Black British 15 1.0
Other 16 1.1
Would rather not say 18 1.2
Mother’s level of education
CSE 80 5.5
Vocational 59 4.1
O Level 184 12.7
A Level 96 6.6
Degree 342 23.6
Would rather not say 120 8.3
Not askedb 567 39.2
Smoking habits
Never smoker 1090 75.3
Ex-smoker 72 5.0
Social smoker 192 13.3
Regular smoker 94 6.5
a
where percentages do not total 100% this is due to missing data b
Table 2Factor loadings of the 55 food groups in the four principal components extracted from the PCA of frequency of food intake data of 1448 university students
Food group (% variance) Vegetarian (8.4%) Snacking (5.7%) Health-conscious (4.2%) Convenience, red meat & alcohol (3.4%)
Pulses, beans & lentils 0.642 −0.113 0.216
Tofu 0.627 0.105
Meat alternatives 0.586 0.126 −0.109 0.121
Hummus 0.585 0.147
Chicken/poultry −0.456 0.106 0.277
Processed meat −0.453 0.277 0.354
Red meat & offal −0.439 0.163 0.134 0.332
Biscuits, cakes & sweets 0.623 −0.106
Milk & cream-based desserts 0.531 0.160
Confectionery −0.174 0.524
Crisps & savoury snacks 0.413 −0.170 0.253
White bread −0.141 0.393 −0.209 0.214
Fruit juice 0.354
Other bread 0.104 0.342
Canned fruit 0.101 0.320 0.100 −0.124
Fruit squash (not low calorie) 0.293 −0.182
Other yogurts 0.276 0.216 −0.105
Other spread 0.251
Added sugar in tea, coffee & cereal 0.239 0.128
Quiche 0.201 0.218 0.124
Fatty fish & canned tuna −0.120 0.616
White fish & shell fish −0.157 0.531
Nuts 0.324 0.491
Eggs −0.151 −0.120 0.477 0.350
Fresh fruit 0.174 0.443 −0.108
Other green vegetables, onions & salad items 0.369 −0.258 0.376 0.127
Oat- & bran-based breakfast cereals −0.172 0.372 −0.170
Herbal & green tea 0.313 −0.153 0.365
Low fat & low-calorie yogurts 0.334 −0.308
Tea & coffee 0.122 0.251
Fried food 0.503
Pasta & rice 0.135 0.451
Ready-made sauces 0.396
Pizza 0.327 −0.171 0.392
Chips −0.160 0.301 −0.221 0.379
Alcoholic drinks 0.328
Butter −0.166 0.137 0.312
Mayonnaise, salad cream & other dressings −0.115 0.249 0.225 0.277
Cream 0.128 0.198 0.209
Crispbread 0.144 0.132 −0.179
Peas 0.115
Boiled, mashed, roast & jacket potatoes −0.211 0.261 0.113
intake (r= 0.271;P< 0.01). The‘snacking’and ‘conveni-ence, red meat and alcohol’ dietary patterns exhibited the strongest correlations with energy intake (r= 0.582 and r= 0.547 respectively). Owing to these significant associations, energy-adjusted nutrient intakes were used to explore relationships with dietary patterns scores. There were strong positive correlations (0.5≥ r < 0.6;
p< 0.01) between the ‘vegetarian’ pattern and energy-adjusted intakes of fibre, copper and thiamin. The ‘health-conscious’ pattern was the most nutrient dense, with sig-nificant, positive, strong correlations (0.5≥r< 0.7;p< 0.01) for energy-adjusted intakes of selenium, vitamin D, vitamin B12, and biotin. The‘snacking’pattern was strongly posi-tively correlated with energy-adjusted non-milk extrinsic sugars (NMES) (r = 0.524; P< 0.01). Alcohol intake (energy-adjusted) was negatively correlated with scores on the‘snacking’pattern (r=−0.317;P< 0.01). Only in-take of total sugars (energy-adjusted) was strongly and negatively correlated with the‘convenience, red meat & alcohol’pattern (r=−0.577;P< 0.01).
General linear models
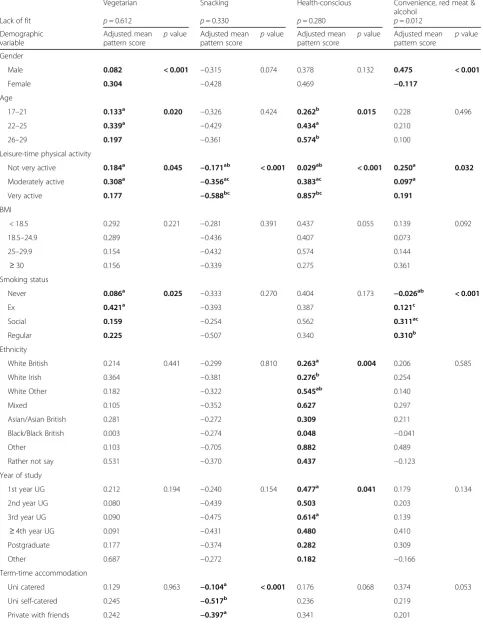
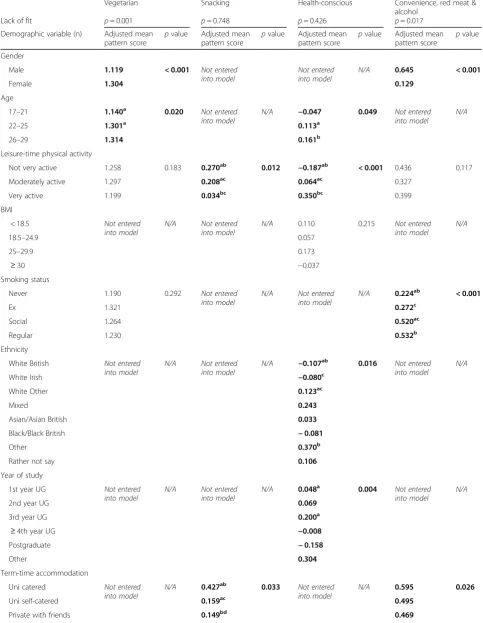
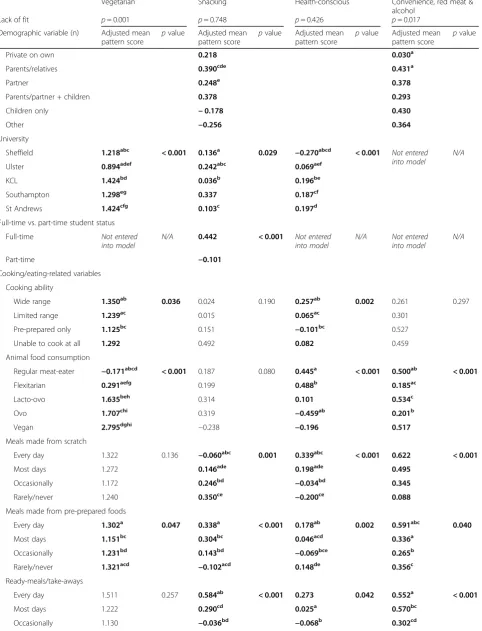
Adjusted mean pattern scores by demographic and cook-ing/eating behaviour variables from the GLMs are pro-vided in Table 4 (Model 1) and Table 5 (Model 2). The text that follows summarises the key findings.
Pattern 1–Vegetarian
In Model 1 (demographic variables only) female gender (p< 0.001), middle age group (p= 0.020), moderate leisure-time activity levels (p= 0.045) and ex-smoker sta-tus (p= 0.025) were independently associated with higher scores on the vegetarian dietary pattern. Attendance at
Ulster University was independently associated with lower ‘vegetarian’pattern scores (p< 0.001).
In Model 2 (demographic variables & food/eating re-lated variables), female gender (p < 0.001), middle age group (p = 0.020), greatest self-reported cooking ability (p= 0.036), least frequent consumption of pre-prepared foods (p= 0.047) and lower consumption of animal products (p= 0.036) were independently associated with higher ‘vegetarian’ pattern scores. Attendance at Ulster University (p< 0.001) was independently associated with lower scores.
Pattern 2–Snacking
In Model 1, low leisure-time physical activity (p< 0.001), attendance at Ulster University (p= 0.003), full time stu-dent status (p= 0.001) and living with parents/other rel-atives (p< 0.001) were independently associated with higher‘snacking’pattern scores.
In Model 2, lower leisure-time physical activity par-ticipation (p= 0.012), attendance at Ulster University (p= 0.029), living with parents/other relatives or in uni-versity catered accommodation (p= 0.033), and full-time student status (p< 0.001) were independently associated with greater pattern score. Infrequent consumption of meals prepared from raw ingredients (p< 0.001), and frequent consumption of pre-prepared foods (p< 0.001) and ready meals/take-aways (p< 0.001) were also independently associated with high ‘snacking’ pattern scores.
Pattern 3–Health-conscious
[image:7.595.62.540.110.300.2]In Model 1,‘very active’physical activity levels (p< 0.001), ‘White Other’ ethnicity (p= 0.004) and third year of undergraduate study (p= 0.041) were independently Table 2Factor loadings of the 55 food groups in the four principal components extracted from the PCA of frequency of food intake data of 1448 university students(Continued)
Food group (% variance) Vegetarian (8.4%) Snacking (5.7%) Health-conscious (4.2%) Convenience, red meat & alcohol (3.4%)
Baked beans 0.112 0.112
Wheat bran 0.124 −0.136
Low calorie squash & fizzy drinks 0.115
Non-white bread
Low fat, olive & pufa spread −0.124
Fizzy drinks (not low calorie) −0.180 0.332 −0.204 0.282
Jam, marmalade & honey 0.255 −0.125
Cheese 0.214 0.145 0.218
Water −0.253 0.292
Milk −0.162 0.107 0.120 0.106
Other breakfast cereals −0.150 0.168 −0.194
Soups 0.209 0.125 0.215
associated with higher scores on the ‘health-conscious’ pattern. Youngest age group (p= 0.015) and attendance at University of Sheffield were independently associated with lower scores (p< 0.001).
In Model 2, the five significant demographic factors identified in Model 1 remained independently associated with ‘health-conscious’ pattern scores. Additionally, re-porting being ‘able to cook a wide range of meals from raw ingredients’ (p= 0.002), daily consumption of meals
[image:8.595.59.538.110.574.2]made from raw ingredients (p< 0.001) and pre-prepared foods (p= 0.002), greatest amount of money spent on food (≥50/week) (p< 0.001), at least occasional con-sumption of animal products (p< 0.001) and infrequent skipping of breakfast (p< 0.001) were independently as-sociated with higher health-conscious pattern scores. Rare – compared to occasional or almost daily - con-sumption of take-aways/ready meals was associated with lower scores (p= 0.042).
Table 3Pearson’s correlations between dietary pattern scores and estimated average daily nutrient intakes from frequency of food intake data
Vegetarian Snacking Health-conscious Convenience, red meat & alcohol
Nutrient Absolute Adjusted Absolute Adjusted Absolute Adjusted Absolute Adjusted
Energy (kcal) −0.096γ 0.582γ 0.271γ 0.547γ
Protein (g) −0.304γ −0.389γ 0.309γ −0.343γ 0.483γ 0.469γ 0.491γ 0.334γ
Total fat (g) −0.171γ −0.183γ 0.602γ 0.232γ 0.291γ 0.116γ 0.535γ 0.134γ
Total carbohydrate (g) 0.073γ 0.322γ 0.633γ 0.316γ 0.101γ −0.287γ 0.330γ −0.358γ
NMES (g) −0.163γ −0.110γ 0.696γ 0.524γ −0.124γ −0.393γ 0.234γ −0.174γ
Saturated fat (g) −0.266γ −0.326γ 0.638γ 0.347γ 0.166γ −0.098γ 0.485γ 0.080γ
Monounsaturated fat (g) −0.241γ −0.306γ 0.558γ 0.144γ 0.302γ 0.142γ 0.507γ 0.091γ
Polyunsaturated fat (g) 0.018γ 0.143γ 0.430γ −0.026 0.336γ 0.209γ 0.492γ 0.137
Total sugars (g) 0.019 0.123γ 0.602γ 0.333γ 0.295γ 0.154γ 0.043 −0.577γ
Fibre (g) 0.443γ 0.551γ 0.080γ −0.259γ 0.386γ 0.306γ 0.096γ −0.207γ
Sodium (mg) 0.113γ 0.286γ 0.439γ −0.002γ 0.313γ 0.172γ 0.436γ 0.040γ
Potassium (mg) 0.035 0.196γ 0.360γ −0.240γ 0.472γ 0.451γ 0.352γ −0.212γ
Calcium (mg) 0.073γ 0.183γ 0.449γ 0.106γ 0.315γ 0.189γ 0.199γ −0.258γ
Magnesium (mg) 0.229γ 0.461γ 0.253γ −0.347γ 0.509γ 0.482γ 0.304γ −0.197γ
Iron (mg) 0.147γ 0.332γ 0.247γ −0.350 0.339γ 0.214 0.400γ −0.017
Copper (mg) 0.343γ 0.545γ 0.229γ −0.256γ 0.458γ 0.387γ 0.340γ −0.035
Zinc (mg) −0.264γ −0.318γ 0.289γ −0.382γ 0.391γ 0.304γ 0.483γ 0.080γ
Selenium (mg) −0.221γ −0.208γ 0.208γ −0.259γ 0.584γ 0.555γ 0.423γ 0.115γ
Iodine (μg) −0.260γ −0.247γ 0.259γ −0.065 0.524γ 0.488γ 0.126γ −0.224γ
Vitamin A (μg) 0.132γ 0.163γ 0.050 −0.129γ 0.362γ 0.314γ 0.065 −0.095γ
Vitamin E (mg) 0.163γ 0.286γ 0.347γ −0.022 0.505γ 0.447γ 0.244γ −0.145γ
Vitamin D (μg) −0.136γ −0.113γ 0.015 −0.209γ 0.645γ 0.613γ 0.159γ −0.009
Thiamin (mg) 0.484γ 0.558γ 0.217γ 0.010 0.044 −0.059 0.200γ 0.004
Riboflavin (mg) −0.223γ −0.216γ 0.338γ −0.090γ 0.394γ 0.298γ 0.210γ −0.258γ
Niacin (mg) −0.359γ −0.429γ 0.221γ −0.377γ 0.465γ 0.408γ 0.408γ 0.008
Vitamin B6(mg) −0.210γ −0.226γ 0.266γ −0.435γ 0.332γ 0.199γ 0.439γ −0.011
Vitamin B12(mg) −0.315γ −0.311γ 0.180γ −0.163γ 0.583γ 0.537γ 0.230γ −0.065
Folate (μg) 0.177γ 0.313γ 0.191γ −0.294γ 0.416γ 0.329γ 0.253γ −0.155γ
Biotin (μg) 0.088γ 0.169γ 0.100γ −0.319γ 0.690γ 0.673γ 0.212γ −0.123γ
Vitamin C (mg) 0.202γ 0.244γ 0.163γ −0.017γ 0.299γ 0.237γ 0.009 −0.197γ
Alcohol (g) 0.023 0.064 −0.020 −0.317γ 0.026 −0.086γ 0.345γ 0.180γ
γP< 0.01
Correlation coefficients between absolute nutrient intakes and relative nutrient intakes adjusted for energy intakes are both shown. Correlation coefficients≥0.5
Table 4General Linear Model 1–Demographic Variables
Vegetarian Snacking Health-conscious Convenience, red meat &
alcohol
Lack of fit p= 0.612 p= 0.330 p= 0.280 p= 0.012
Demographic variable
Adjusted mean pattern score p
value Adjusted mean pattern score p
value Adjusted mean pattern score p
value Adjusted mean pattern score p
value
Gender
Male 0.082 < 0.001 −0.315 0.074 0.378 0.132 0.475 < 0.001
Female 0.304 −0.428 0.469 −0.117
Age
17–21 0.133a 0.020 −0.326 0.424 0.262b 0.015 0.228 0.496
22–25 0.339a −0.429 0.434a 0.210
26–29 0.197 −0.361 0.574b 0.100
Leisure-time physical activity
Not very active 0.184a 0.045 −0.171ab < 0.001 0.029ab < 0.001 0.250a 0.032
Moderately active 0.308a −0.356ac 0.383ac 0.097a
Very active 0.177 −0.588bc 0.857bc 0.191
BMI
< 18.5 0.292 0.221 −0.281 0.391 0.437 0.055 0.139 0.092
18.5–24.9 0.289 −0.436 0.407 0.073
25–29.9 0.154 −0.432 0.574 0.144
≥30 0.156 −0.339 0.275 0.361
Smoking status
Never 0.086a 0.025 −0.333 0.270 0.404 0.173 −0.026ab < 0.001
Ex 0.421a −0.393 0.387 0.121c
Social 0.159 −0.254 0.562 0.311ac
Regular 0.225 −0.507 0.340 0.310b
Ethnicity
White British 0.214 0.441 −0.299 0.810 0.263a 0.004 0.206 0.585
White Irish 0.364 −0.381 0.276b 0.254
White Other 0.182 −0.322 0.545ab 0.140
Mixed 0.105 −0.352 0.627 0.297
Asian/Asian British 0.281 −0.272 0.309 0.211
Black/Black British 0.003 −0.274 0.048 −0.041
Other 0.103 −0.705 0.882 0.489
Rather not say 0.531 −0.370 0.437 −0.123
Year of study
1st year UG 0.212 0.194 −0.240 0.154 0.477a 0.041 0.179 0.134
2nd year UG 0.080 −0.439 0.503 0.203
3rd year UG 0.090 −0.475 0.614a 0.139
≥4th year UG 0.091 −0.431 0.480 0.410
Postgraduate 0.177 −0.374 0.282 0.309
Other 0.687 −0.272 0.182 −0.166
Term-time accommodation
Uni catered 0.129 0.963 −0.104a < 0.001 0.176 0.068 0.374 0.053
Uni self-catered 0.245 −0.517b 0.236 0.219
Pattern 4–Convenience, red meat & alcohol
In Model 1, male gender (p< 0.001), lowest leisure-time physical activity levels (p= 0.032), and regular/social smoking status (p< 0.001) were independently
associ-ated with higher scores on the ‘convenience, red
meat & alcohol’ diet pattern. An independent inverse association between living alone in private accommo-dation and score on this pattern approached signifi-cance (p= 0.053).
In Model 2, higher pattern scores were independently associated with male gender (p< 0.001), regular/social smoking status (p< 0.001), most frequent consumption pre-prepared foods (p= 0.040), frequent consumption of ready-meals/take-aways (p< 0.001), frequent breakfast skipping (p< 0.001), regular consumption of animal products (p< 0.001) and greater amounts of money spent on food (p< 0.001). Lower scores were independ-ently associated with living alone (p= 0.026) and spend-ing less money on food (p< 0.001).
Discussion
This study aimed to identify dietary patterns within a UK university student population and to delineate the socio-demographic, lifestyle and other behavioural characteris-tics of students favouring these patterns. Dietary patterns analysis unveiled heterogeneity in food choice with stu-dents following four major dietary patterns: ‘vegetarian’, ‘snacking’,‘health-conscious’and‘convenience, red meat & alcohol’. These patterns explained approximately one fifth of the variance in food intake. Students’gender, age, geo-graphical location and cooking ability were associated with differences in pattern behaviour. Clustering of lifestyle risk factors with dietary patterns was also evident, with less healthful dietary patterns associated with smoking, low physical activity and take-away consumption. Students tending to the ‘convenience, red meat & alcohol’ pattern reported spending more money on food each week.
[image:10.595.59.538.98.448.2]The‘vegetarian’,‘snacking’and‘health-conscious’patterns identified here are analogous to those previously reported Table 4General Linear Model 1–Demographic Variables(Continued)
Vegetarian Snacking Health-conscious Convenience, red meat &
alcohol
Lack of fit p= 0.612 p= 0.330 p= 0.280 p= 0.012
Demographic variable
Adjusted mean pattern score p
value Adjusted mean pattern score p
value Adjusted mean pattern score p
value Adjusted mean pattern score p
value
Private on own 0.324 −0.265 0.450 −0.275
Parents/relatives 0.173 −0.076bc 0.524 0.175
Partner 0.269 −0.306c 0.456 0.187
Parents/partner + children 0.138 −0.247 0.290 0.074
Children only 0.218 −0.555 0.344 0.254
Other 0.268 −0.879 0.992 0.402
University
Sheffield 0.146abc < 0.001 −0.370a 0.003 0.098abcd < 0.001 0.166 0.270
Ulster −0.376adef −0.214ab 0.318aef 0.299
KCL 0.398bd −0.569b 0.541be 0.237
Southampton 0.227e −0.264 0.584cf 0.221
St Andrews 0.719cf −0.442 0.576d −0.027
Faculty
Arts 0.334 0.234 −0.308 0.527 0.456 0.766 0.275 0.277
Social science 0.180 −0.357 0.464 0.191
Engineering 0.123 −0.416 0.400 0.153
Science 0.216 −0.453 0.357 0.177
Medicine & health 0.261 −0.324 0.440 0.099
Full-time vs. part-time student status
Full-time 0.183 0.582 −0.109 0.001 0.381 0.560 0.246 0.378
Part-time 0.263 −0.634 0.466 0.113
Independent associations between dietary pattern scores and non-nutrient variables.pvalues < 0.05 are highlighted in bold. Common superscript letters indicate
Table 5General Linear Model 2–Demographic + Eating related variables
Vegetarian Snacking Health-conscious Convenience, red meat &
alcohol
Lack of fit p= 0.001 p= 0.748 p= 0.426 p= 0.017
Demographic variable (n) Adjusted mean pattern score p
value Adjusted mean pattern score p
value Adjusted mean pattern score p
value Adjusted mean pattern score p
value
Gender
Male 1.119 < 0.001 Not entered
into model Not enteredinto model N/A
0.645 < 0.001
Female 1.304 0.129
Age
17–21 1.140a 0.020 Not entered
into model N/A −
0.047 0.049 Not entered
into model N/A
22–25 1.301a 0.113a
26–29 1.314 0.161b
Leisure-time physical activity
Not very active 1.258 0.183 0.270ab 0.012 −0.187ab < 0.001 0.436 0.117
Moderately active 1.297 0.208ac 0.064ac 0.327
Very active 1.199 0.034bc 0.350bc 0.399
BMI
< 18.5 Not entered
into model N/A Not enteredinto model N/A
0.110 0.215 Not entered
into model N/A
18.5–24.9 0.057
25–29.9 0.173
≥30 −0.037
Smoking status
Never 1.190 0.292 Not entered
into model N/A Not enteredinto model N/A
0.224ab < 0.001
Ex 1.321 0.272c
Social 1.264 0.520ac
Regular 1.230 0.532b
Ethnicity
White British Not entered
into model N/A Not enteredinto model N/A −
0.107ab 0.016 Not entered
into model N/A
White Irish −0.080c
White Other 0.123ac
Mixed 0.243
Asian/Asian British 0.033
Black/Black British −0.081
Other 0.370b
Rather not say 0.106
Year of study
1st year UG Not entered
into model N/A Not enteredinto model N/A
0.048a 0.004 Not entered
into model N/A
2nd year UG 0.069
3rd year UG 0.200a
≥4th year UG −0.008
Postgraduate −0.158
Other 0.304
Term-time accommodation
Uni catered Not entered
into model N/A
0.427ab 0.033 Not entered
into model N/A
0.595 0.026
Uni self-catered 0.159ac 0.495
Table 5General Linear Model 2–Demographic + Eating related variables(Continued)
Vegetarian Snacking Health-conscious Convenience, red meat &
alcohol
Lack of fit p= 0.001 p= 0.748 p= 0.426 p= 0.017
Demographic variable (n) Adjusted mean pattern score p
value Adjusted mean pattern score p
value Adjusted mean pattern score p
value Adjusted mean pattern score p
value
Private on own 0.218 0.030a
Parents/relatives 0.390cde 0.431a
Partner 0.248e 0.378
Parents/partner + children 0.378 0.293
Children only −0.178 0.430
Other −0.256 0.364
University
Sheffield 1.218abc < 0.001 0.136a 0.029 −0.270abcd < 0.001 Not entered
into model N/A
Ulster 0.894adef 0.242abc 0.069aef
KCL 1.424bd 0.036b 0.196be
Southampton 1.298eg 0.337 0.187cf
St Andrews 1.424cfg 0.103c 0.197d
Full-time vs. part-time student status
Full-time Not entered
into model N/A
0.442 < 0.001 Not entered
into model N/A Not enteredinto model N/A
Part-time −0.101
Cooking/eating-related variables
Cooking ability
Wide range 1.350ab 0.036 0.024 0.190 0.257ab 0.002 0.261 0.297
Limited range 1.239ac 0.015 0.065ac 0.301
Pre-prepared only 1.125bc 0.151 −0.101bc 0.527
Unable to cook at all 1.292 0.492 0.082 0.459
Animal food consumption
Regular meat-eater −0.171abcd < 0.001 0.187 0.080 0.445a < 0.001 0.500ab < 0.001
Flexitarian 0.291aefg 0.199 0.488b 0.185ac
Lacto-ovo 1.635beh 0.314 0.101 0.534c
Ovo 1.707chi 0.319 −0.459ab 0.201b
Vegan 2.795dghi −0.238 −0.196 0.517
Meals made from scratch
Every day 1.322 0.136 −0.060abc 0.001 0.339abc < 0.001 0.622 < 0.001
Most days 1.272 0.146ade 0.198ade 0.495
Occasionally 1.172 0.246bd −0.034bd 0.345
Rarely/never 1.240 0.350ce −0.200ce 0.088
Meals made from pre-prepared foods
Every day 1.302a 0.047 0.338a < 0.001 0.178ab 0.002 0.591abc 0.040
Most days 1.151bc 0.304bc 0.046acd 0.336a
Occasionally 1.231bd 0.143bd −0.069bce 0.265b
Rarely/never 1.321acd −0.102acd 0.148de 0.356c
Ready-meals/take-aways
Every day 1.511 0.257 0.584ab < 0.001 0.273 0.042 0.552a < 0.001
Most days 1.222 0.290cd 0.025a 0.570bc
in adult and adolescent UK populations [22,23]. The ‘con-venience, red meat & alcohol’pattern shares features (posi-tive factor loadings for red meat, chips, alcohol) with a major dietary pattern (labelled drinker/social) reported among approximately 480 20–25 year olds in Northern Ireland, derived from 7-day diet history data [24].
The‘snacking’and‘convenience, red meat and alcohol’ patterns have common features with published data on the food preferences of British university students [2, 4]. Existing studies allude to non-prudent consumption pat-terns, reporting low consumption of fruit and vegetables alongside high intakes of confectionery, alcohol, and fried, ready-made and convenience foods [2–4].
We have shown that both the ‘snacking’and ‘conveni-ence, red meat and alcohol’ patterns were least nutrient-dense. Indeed it is noteworthy that these two patterns were additionally positively correlated with energy intake and did not feature fruit and vegetables; dependence on such a pat-tern may increase risk of positive energy balance and hence weight gain. The ‘health-conscious’ pattern, which had a
favourable nutrient profile - being particularly dense in micronutrients such as biotin, vitamin B12, vitamin D and selenium - is at odds with the stereotype of student eating patterns, but concurs with published research on dietary patterns among UK adults [21,22] and a small-scale study of university students in Birmingham, UK [4].
It is of note that a vegetarian diet was the predominant pattern identified in the current study, and indeed 10% of students described themselves as vegetarian. The lat-ter figure is less than that reported in a survey of over 3000 university students studying in Northern Ireland, which reported that 22% of students did not eat meat [3]. Although a vegetarian pattern has been described in the wider UK diet pattern literature [21–23], it was a minor component, in keeping with the low prevalence of vegetarianism among British adults nationally (3%) [25].
[image:13.595.58.543.97.460.2]Whilst high rates of binge drinking have previously been documented among student populations [3, 26], and there is a popular stereotype of students as heavy drinkers, only one pattern (‘convenience, red meat & Table 5General Linear Model 2–Demographic + Eating related variables(Continued)
Vegetarian Snacking Health-conscious Convenience, red meat &
alcohol
Lack of fit p= 0.001 p= 0.748 p= 0.426 p= 0.017
Demographic variable (n) Adjusted mean pattern score p
value Adjusted mean pattern score p
value Adjusted mean pattern score p
value Adjusted mean pattern score p
value
Rarely/never 1.143 −0.155acd 0.073ab 0.125abd
Meals in university cafeteria
Every day 1.156 0.062 0.153 0.547 0.141 0.922 0.375 0.336
Most days 1.253 0.245 0.047 0.485
Occasionally 1.311 0.170 0.069 0.372
Rarely/never 1.286 0.115 0.046 0.317
Skipped breakfast
Every day 1.358 0.062 0.221 0.101 −0.179ab < 0.001 0.514ab < 0.001
Most days 1.276 0.257 0.066c 0.609cd
Occasionally 1.193 0.114 0.126ad 0.307ace
Rarely/never 1.179 0.091 0.290bcd 0.119bde
Skipped lunch/dinner
Every day 1.245 0.991 0.089 0.131 0.284 0.404 0.001 0.012
Most days 1.252 0.236 0.066 0.443
Occasionally 1.261 0.116 −0.031 0.503
Rarely/never 1.248 0.241 −0.016 0.602
Amount spent on food
< £20 1.278 0.268 0.101 0.534 −0.171abcd < 0.001 0.162abcd < 0.001
£20–29 1.269 0.146 −0.005aef 0.344aef
£30–39 1.251 0.150 0.138beg 0.385b
£40–49 1.333 0.264 0.096eh 0.481ce
≥£50 1.127 0.192 0.320dfgh 0.564df
Independent associations between dietary pattern scores and non-nutrient variables.pvalues < 0.05 are highlighted in bold. Common superscript letters indicate
alcohol’) was high in alcoholic beverages. Furthermore students following this pattern were also more likely to smoke, have frequent consumption of take-aways and pre-prepared foods and engage in lower levels of phys-ical activity. This clustering of behaviours is important, since the negative health outcomes associated with multiple lifestyle risk factors are greater than the sum of individual health risk behaviours [27]. Conversely students favouring more healthful dietary patterns re-ported greater engagement in other health-promoting lifestyle choices, including not smoking, greater partici-pation in physical activity. Aggregation of lifestyle be-haviours has previously been reported in both university student and adult populations [26–28].
Gendered food preferences were also evident, espe-cially in relation to meat consumption. Specifically, fe-male students favoured a ‘vegetarian’ diet, whilst male students scored highly on the ‘convenience, red meat & alcohol’ pattern. Greater meat and fast food consump-tion among male students has previously been reported, and vegetarianism is more prevalent amongst female students [3,24]. Although a recent British student study observed no gender differences between eating patterns [4], this study lacked detailed dietary assessment.
Dietary preferences also varied between participating universities. Generally, students at Ulster University favoured less healthful patterns, whilst those at the Uni-versities of Southampton, St Andrews and KCL tended towards more healthful diets. Students attending the University of Sheffield were least likely to adopt a ‘health-conscious’ dietary pattern. This gradient is con-gruent with national data, which indicates that the popu-lation of Northern Ireland consumes a diet of poorer quality than the UK as a whole [29]. Dietary gradients were also evident in relation to geography in a compara-tive study of university students from seven universities across the UK, although absence of information on spe-cific university location limits comparison [2].
It is also possible that dietary differences observed be-tween universities may arise because of socioeconomic gradients across universities. Missing data on social class for students at the University of Sheffield precluded ad-justment for this possibility. However information from the Higher Education Statistics Agency (HESA) indicates an SES gradient between universities: a greater propor-tion of students at Ulster University are from manual oc-cupational backgrounds than from KCL, Sheffield and Southampton (no data available for St Andrews) [30]. Maternal education data for Ulster, KCL, St Andrews & Southampton corroborated these differences (data for University of Sheffield not available). The wider litera-ture consistently reports a positive association between socioeconomic status and diet quality across UK popu-lation groups [21, 23, 28]. However, the tendency for
students at the University of Sheffield to score lowest on a ‘health-conscious’ diet is not in line with this explanation.
The possibility of selection bias should be considered. There were differences in recruitment method between the University of Sheffield and Ulster University (recruit-ment email distributed directly to all students via a glo-bal mailing list), and the other three participating sites (e.g. study advertisement on student volunteers web-page). These recruitment differences may have biased the sample towards health-motivated students at KCL, St Andrews and Southampton.
The lack of association between university attended and consumption of the ‘convenience, red meat & alco-hol’diet also deserves attention. This homogeneity sug-gests that this pattern is pervasive across all universities studied, substantiating popular beliefs that the diet of UK university students is one of poor quality.
This study also revealed that older students favoured more healthful dietary patterns and there was evidence of a positive linear relationship between age and scores on the ‘health-conscious’ pattern. It is possible that as students mature they become increasingly aware of the impact of dietary choices on health and well-being, and health thus becomes an increasingly important deter-minant of food choice. Studies among the general UK adult population report similar age effects [21, 22]. A student survey conducted in Northern Ireland reported a positive gradient in diet quality by year of study [3]. In contrast, other student-specific research has failed to de-tect an association between eating habits and age (or year of study), although most of these studies have not collected detailed dietary data [2,4,10,26].
Finally, 45% of the current sample reported limited (or non-existent) cooking ability, being at best only able to cook a limited range of meals from raw ingredients. Stu-dents with poor cooking ability were less likely to adopt healthier (vegetarian; health-conscious) diets than their more skilled counterparts. This association has not been documented among a university student population, but corroborates associations found in several adult studies [31,32]. No association, however, was identified between cooking ability and scores on the less healthful dietary patterns (snacking; convenience, red meat & alcohol). Whilst it is likely that students who lack culinary skills may be forced to rely on convenience foods to ensure meal provision, other factors such as time pressures and (lack of ) cooking enjoyment may be more salient in de-termining students’ decisions around consumption of these foods [33,34] .
Study strengths and limitations
for the measurement of absolute dietary intake, but the use of a dietary pattern approach permitted ranking ac-cording to food group intake and so was considered ap-propriate. Furthermore, use of an FFQ allowed dietary intake to be captured over a 3-month semester and facili-tated recruitment of a large, geographically diverse sample, albeit a convenience one. Ideally, the sampling frame would have included a greater number of universities and involved stratification by year of study, subject group and socioeconomic indices in order to give a nationally repre-sentative profile of student eating patterns. Moreover, only health-sciences students were recruited at Southampton, which may represent a source of bias.
The small number of students recruited from St Andrews may been seen as an under-representation of students from a Scottish university, but it should be noted that the total student population at St Andrews (population of around 8000 students) is much smaller than that of Sheffield, Ulster and KCL (between 25,000 and 30,000 students). It should also be noted that all dietary studies suffer from selection bias, in which more health- or diet-aware individuals choose to par-ticipate. Consequently, the prominence of the vegetar-ian and health-conscious dietary patterns may have been over-estimated in this study. Indeed, the BMI dis-tributions were also biased towards healthy, in keeping with other student surveys [4,26].
There was lack of fit in statistical models for ‘conveni-ence, red meat and alcohol’, and‘vegetarian’dietary pat-terns. It should be noted that these models are developmental and clearly only cover some of the po-tential antecedents of following such patterns. Conveni-ence, red meat, alcohol and vegetarian dietary choices are likely to be influenced by a raft of social, cultural and political factors, which have not been included in the model. For example, it is recognised that adoption of a vegetarian diet is related to concern about the envir-onment and animal welfare, as well as for health reasons and weight management [35,36]. Similarly, there is enor-mous heterogeneity in motives for drinking alcohol in-cluding coping, enhancement of social status, religious practice, personality type and alcohol availability [37,38].
Implications for policy and future research directions Importantly, policy makers must recognise not all stu-dents consume poor diets at university: a large group of students consumed nutritionally favourable and health-promoting diets and do not appear in need of dietary intervention. However, students who consumed poor diets and practised unfavourable lifestyle behaviours were also identified, which may have long-term health effects. Tar-geted interventions towards these students are necessary. Furthermore, contemporary policy to limit red meat and alcohol consumption has greatest relevance to male
students. University policy to improve students’ diets should also incorporate efforts to promote student en-gagement in cooking and food preparation, and in-creased availability of low cost healthier food items.
This study also highlights a number of future research needs. Replication of this research among a large repre-sentative sample of UK university students would be pertinent. Secondly, in light of the association between cooking ability and dietary consumption patterns, inves-tigation of the potential for a cooking skills intervention to improve dietary intake is warranted. Finally, the pub-lic health impact of dietary patterns and other lifestyle risk factors established during university become most important if these behaviours track forward into working adult life and represent a blueprint for long-term dietary preferences. Longitudinal research is now needed to in-vestigate this possibility.
Conclusion
This study provides a unique insight into the dietary patterns of UK university students along with associ-ated nutritional content. It has identified a number of antecedents of both healthful and unhealthful dietary practices. Four patterns emerged, with evidence of more healthful dietary practices amongst female and older students, and those with greater self-reported cooking ability. Students in Northern Ireland appeared to favour less healthful dietary patterns than those in Great Britain. Male students tended towards a diet founded on convenience food, red meat and alcohol; this pattern was germane to all participating univer-sities. These findings are relevant to future health pro-motion interventions and behaviour change in this important population.
Additional file
Additional file 1:Table S1.Details of the constituent foods comprising the 55 foods/food groups entered into the PCA.Table S2.Eating behaviours and other eating-related characteristics of the Phase 1 sample. (DOCX 26 kb)
Acknowledgments
The authors gratefully acknowledge Professor Peter Emery at King’s College London and Dr. Penelope Nestel at The University of Southampton for their assistance in administration of the survey. We would also like to acknowledge Anthony Johns from Tinuviel Software for his assistance in setting up the online survey.
Funding
This study was conducted as part of EFS’s PhD project. The University of Sheffield was its sponsor.
Availability of data and materials
Authors’contributions
This manuscript represents original work, which has not been published previously and is not being considered by another Journal. The authors’ responsibilities were as follows: EFS, JMR & MEB conceived and designed the study. EFS was primarily responsible for data collection and analysis, with advice from JMR. EFS wrote the first draft of the manuscript, with help from MEB. JC & LKP facilitated recruitment of students from the University of St Andrews and Ulster University, respectively. All authors contributed to revisions and approval of the final manuscript.
Ethics approval and consent to participate
Ethical approval was obtained from 3 participating university. University of Sheffield Medical School Research Ethics Review, SMBRER288; University of St Andrews Teaching and Research Ethics Committee, MD11298; University of Ulster Research Ethics, 14/0096. University of Sheffield ethical approval covered the research at Kings College London and Southampton.
Each participant gave informed consent on the first page of the web-survey. The provision of consent enabled access to the full survey.
Consent for publication
Not applicable
Competing interests
The authors declare that they have no competing interest.
Publisher’s Note
Springer Nature remains neutral with regard to jurisdictional claims in published maps and institutional affiliations.
Author details
1Human Nutrition Unit, Department of Oncology & Metabolism, The Medical School, University of Sheffield, Sheffield S10 2RX, UK.2Corporate Information & Computing Service, University of Sheffield, Sheffield S10 2GU, UK.3Medical & Biological Sciences Building, University of St Andrews, St Andrews KY16 9TF, UK.4School of Health and Related Research, University of Sheffield, Sheffield S1 4DA, UK.5Nutrition Innovation Centre for Food & Health (NICHE), Ulster University, Coleraine BT52 1SA, UK.6Food & Nutrition Group, Business School, Sheffield Hallam University, Sheffield S1 1WB, UK.
Received: 10 July 2018 Accepted: 24 September 2018
References
1. British Government. Participation Rates in Higher Education: Academic Years 2006/2007–2013/2014. London: British Government; 2015.
2. El AW, Stock C, John J, Deeny P, Phillips C, Snelgrove S, et al. Health promoting behaviours and lifestyle characteristics of students at seven universities in the UK. Cent Eur J Public Health. 2011;19:197–204.
3. Devine P, Lloyd K, Gray AM. University student food attitudes and behaviour survey. Belfast: University of Ulster; 2006.
4. Tanton J, Dodd LJ, Woodfield L, Mabhala M. Eating Behaviours of British University Students: A Cluster Analysis on a Neglected Issue. Adv Prev Med. 2015;2015:639239 Available from:http://www.hindawi.com/journals/apm/ 2015/639239/. [cited 2018 Aug 29].
5. Lake AA, Adamson AJ, Craigie AM, Rugg-Gunn AJ, Mathers JC. Tracking of dietary intake and factors associated with dietary change from early adolescence to adulthood: the ASH30 study. Obes Facts. 2009;2:157–65 Available from:http://www.ncbi.nlm.nih.gov/pubmed/20054220. [cited 2018 Aug 29].
6. Mikkilä V, Räsänen L, Raitakari OT, Pietinen P, Viikari J. Consistent dietary patterns identified from childhood to adulthood: the cardiovascular risk in young Finns study. Br J Nutr. 2005;93:923–31 Available from:http://www. ncbi.nlm.nih.gov/pubmed/16022763. [cited 2018 Aug 29].
7. Papadaki A, Hondros G, Scott J, Kapsokefalou M. Eating habits of university students living at, or away from home in Greece. Appetite. 2007;49:169–76. 8. Crombie AP, Ilich JZ, Dutton GR, Panton LB, Abood DA. The freshman
weight gain phenomenon revisited. Nutr Rev. 2009;67:83–94.
9. Finlayson G, Cecil J, Higgs S, Hill A, Hetherington M. Susceptibility to weight gain. Eating behaviour traits and physical activity as predictors of weight gain during the first year of university. Appetite. 2012;58:1091–8 Available from:http://www.ncbi.nlm.nih.gov/pubmed/22407132. [cited 2012 Nov 29].
10. Nikolaou CK, Hankey CR, Lean MEJ. Weight changes in young adults : a mixed-methods study. Int J Obes. 2014;39:508–13.
11. Guo SS, Huang C, Maynard LM, Demerath E, Towne B, Chumlea WC, et al. Body mass index during childhood , adolescence and young adulthood in relation to adult overweight and adiposity: the Fels longitudinal study. Int J Obes. 2000;24:1628–35.
12. Neumark-Sztainer D, Wall M, Larson N, Eisenberg M, Loth K. Dieting and disordered eating behaviors from adolescence to young adulthood: findings from a 10-year longitudinal study. J Am Diet Assoc. 2011;111:1004–11. 13. Fayet F, Petocz P, Samman S. Prevalence and correlates of dieting in college
women: a cross sectional study. Int J Womens Health. 2012;13:405–11. 14. Larson NI, Neumark-Sztainer D, Story M. Weight control behaviors and
dietary intake among adolescents and young adults: longitudinal findings from project EAT. J Am Diet Assoc. 2009;109:1869–77.
15. Woodruff SJ, Hanning RM, Lambraki I, Storey KE, McCargar L. Healthy eating index-C is compromised among adolescents with body weight concerns, weight loss dieting, and meal skipping. Body Image. 2008;5:404–8. 16. Schutz HK, Paxton SJ. Friendship quality, body dissatisfaction, dieting &
disordered eating in adolescent girls. Br J Clin Psychol. 2007;46:67–83. 17. Slattery ML. Defining dietary consumption: is the sum greater than its parts?
Am J Clin Nutr. 2008;88:14–5.
18. Yarnell JW, Fehily AM, Milbank J, Sweetnam P, Walker C. A short dietary questionnaire for use in an epidemiological survey: comparison with weight dietary records. Hum Nutr Appl Nutr. 1983;37:103–12.
19. Tinuviel Software Ltd. DIETQ Validation. 1999.
20. Tabachnick BG, Fidell LS. Using multivariate statistics. 6th ed. New York: Harper Row; 2012.
21. Northstone K, Emmett P, Rogers I. Dietary patterns in pregnancy and associations with socio-demographic and lifestyle factors. Eur J Clin Nutr. 2008;62:471–9.
22. Northstone K, Emmett PM. Dietary patterns of men in the ALSPAC: associations with socio-demographic and lifestyle characteristics, nutrient intakes and comparison with women’s dietary patterns. Eur J Clin Nutr. 2010;64:978–86.
23. Northstone K, Smith AD, Cribb VL, Emmett PM. Dietary patterns in UK adolescents obtained from a dual-source FFQ and their associations with socio-economic position, nutrient intake and modes of eating. Public Health Nutr. 2013;17:1476–85.
24. Mccourt HJ, Draffin CR, Woodside JV, Cardwell CR, Young IS, Hunter SJ, et al. Dietary patterns and cardiovascular risk factors in adolescents and young adults: the Northern Ireland young hearts project. Br J Nutr. 2014;112: 1685–98.
25. Pigott S, Bates B, Nass L. Socio-demographic characteristics of the NDNS RP sample - National Diet and Nutrition Survey. Results from Years 1–4 (combined) of the Rolling Programme (2008/2009–2011/12); 2014. p. 55–60. 26. Dodd LJ, Al-Nakeeb Y, Nevill A, Forshaw MJ. Lifestyle risk factors of students:
a cluster analytical approach. Prev Med (Baltim). 2010;51:73–7 Available from:https://doi.org/10.1016/j.ypmed.2010.04.005.
27. Buck D, Frosini F. Clustering of unhealthy behaviours over time -Implications for policy and practice. Kings Fund. 2012;1–24. Available from:
http://www.kingsfund.org.uk/publications/clustering-unhealthy-behaviours-over-time. Cited 29 Aug 2018.
28. Barker ME, McClean SI, Thompson KA, Reid NG. Dietary behaviours and sociocultural demographics in Northern Ireland. Br J Nutr. 1990;64:319–29 Available from:http://www.ncbi.nlm.nih.gov/pubmed/2223737.
29. Lennox A, Prynne C, Swan G, Roberts C, Steer T, Pell D, et al. Dietary intakes - National Diet and Nutrition Survey. Results from Years 1–4 (combined) of the Rolling Programme (2008/2009–2011/12). Northern Ireland: Public Health England; 2014. p. 61–84.
30. HIgher Education Statistics Agency Ltd. Working class students at university, 2008/09. 2010.
31. Bamia C, Trichopoulos D, Ferrari P, Overvad K, Bjerregaard L, Tjønneland A, et al. Dietary patterns and survival of older Europeans: the EPIC-elderly study (European prospective investigation into Cancer and nutrition). Public Health Nutr. 2007;10:590–8.
32. Wrieden WL, Anderson AS, Longbottom PJ, Valentine K, Stead M, Caraher M, et al. The impact of a community-based food skills intervention on cooking confidence, food preparation methods and dietary choices - an exploratory trial. Public Health Nutr. 2007;10:203–11.
34. Larson NI, Perry CL, Story M, Neumark-Sztainer D. Food preparation by young adults is associated with better diet quality. J Am Diet Assoc. 2006; 106:2001–7.
35. Ruby MB. Vegetarianism. A blossoming field of study. Appetite. 2012;58: 141–50 Available from:http://www.ncbi.nlm.nih.gov/pubmed/22001025. [cited 2012 Mar 13].
36. Kenyon PM, Barker ME. Attitudes towards meat-eating in vegetarian and non-vegetarian teenage girls in England--an ethnographic approach. Appetite. 1998;30:185–98 Available from:http://www.ncbi.nlm.nih.gov/pubmed/9573452. 37. Lac A, Donaldson CD. Alcohol attitudes, motives, norms, and personality
traits longitudinally classify nondrinkers, moderate drinkers, and binge drinkers using discriminant function analysis. Addict. Behav. 2016;61:91–8 Available from:https://doi.org/10.1016/j.addbeh.2016.05.006.