SyFSeL: Generating Synthetic Fuzzy Sets
Made Simple
Josie McCulloch
Lab for Uncertainty in Data and Decision Making (LUCID), School of Computer Science, University of Nottingham, Nottingham, UK
Email: [email protected]
Abstract—Empirical tests can help determine if methods de-veloped for fuzzy sets work correctly. However, finding a large enough data set with suitable properties to conduct thorough tests can be challenging. This paper presents a new library named SyFSeL (Synthetic Fuzzy Set Library) which automat-ically generates synthetic fuzzy sets with specified characteristics and fuzzy set type. SyFSeL generates as many sets as desired, with adjustable parameters to enable users to emulate real data. Generated fuzzy sets are exported so users can import them into their own fuzzy systems software. SyFSeL can also create graphical plots of the generated sets, examples of which are shown in this paper. The library is cross-platform and open-source under the GNU General Public License, and users are free to develop upon and adapt the code. However, SyFSeL has been designed so that no understanding of the code is required to use it.
I. INTRODUCTION
Synthetic fuzzy sets are useful in many fields on the fundamental and theoretical literature around fuzzy sets. For example, for testing measures (e.g., similarity), fusion methods (e.g., fuzzy integrals) and comparing a method’s performance between type-1 and type-2 fuzzy sets. A large collection of synthetic fuzzy sets can be used to adequately evaluate and demonstrate the behaviours of methods. This is particularly useful when real data sets are unavailable, too small, or sensitive. For example, synthetic data is useful when a method relies on a real data set that is too small to adequately test that the measure works as expected. Additionally, methods may be developed for sensitive data, and results with synthetic fuzzy sets can be published to show the method works with non-sensitive data.
We present a python-based, cross-platform, open-source library named SyFSeL (Synthetic Fuzzy Set Library) that automatically generates and plots synthetic fuzzy sets with adjustable properties on membership functions (e.g., selecting mean, variance, height) and fuzzy set type (type-1, interval type-2 and general type-2). Different modes of fuzzy sets can be generated including normal Gaussian sets, bimodal Gaussian-based sets, and sets emulating fuzzy logic system outputs. The range of adjustable parameters helps users to generate sets that are similar to their real data.
SyFSeL can be used, for example, to generated a large number of fuzzy sets to test methods of comparing fuzzy
This work funded by the EPSRC’s DTP - University of Nottingham grant, EP/M50810X/1.
sets for classification. This can be achieved by generating sets with similar and differing parameters to represent correct and incorrect classifications. Another example use is generating a variety of non-singleton inputs for a robust test of a fuzzy logic system.
The library is open-source under the GNU General Public License and the latest version is available online at https: //bitbucket.org/JosieMcCulloch/syfsel. The code is written in Python and users are free to develop upon and adapt it. However, SyFSeL has been designed so that no understanding of the code is required to use it. Fuzzy sets are stored in csv format so users can easily import the generated sets into their own fuzzy systems software. The library also provides the ability to graphically plot the generated sets, examples of which are shown in this paper.
While there is a wide range of open-source fuzzy systems software available online, their features differ to those of SyFSeL. Most libraries aid in designing and analysing fuzzy logic systems, or solving specific problems in a given field. For example, FisPro [1] is a toolkit for creating type-1 fuzzy logic systems by generating fuzzy partitions and rules from data, Xfuzzy [2] provides tools to aid in describing, verifying and tuning a type-1 fuzzy logic systems, and Type2-FL [3] provides tools to generate interval type-2 fuzzy sets from interval-valued data and calculate fuzzy statistics. For a more comprehensive overview of fuzzy software in the literature and a list of libraries and toolkits, see [4] and [5]. SyFSeL is unique in providing the ability to generate synthetic fuzzy sets that can be used to empirically test methods.
The next section details 1) how the library generates differ-ent types of synthetic fuzzy sets; 2) how to use the library to create and plot sets; and 3) how the fuzzy sets are stored so they may be imported into user’s personal code. Section III presents conclusions and future work.
II. FEATURES OFSYFSEL
This section details the features of SyFSeL, including how it generates synthetic fuzzy sets, how to use it to generate and plot sets, and how the sets are stored.
A. Method of generating fuzzy sets
• Mode-1: Gaussian (parametric) sets (e.g., Fig. 1). • Mode-2: Skewed, bimodal (non-parametric) sets (e.g.,
Fig. 2).
• Mode-3: Examples of fuzzy logic system outputs based on Gaussian (membership) functions (e.g., Fig. 3).
Different modes enable testing methods on a range of parameters. For example, non-normal fuzzy sets may represent agreement among experts where no member of the set is fully agreed on; non-normal fuzzy sets can be created in modes 1 and 2. Non-convexity may occur in real data, for example, when modelling agreement of experts among which there are two different groups of opinion. Non-convex fuzzy sets can be created in mode 2. In another example, methods may be developed to manipulate fuzzy logic system outputs, which are often non-normal and non-convex. These can be created in mode 3. The ability to generate a large sample size of synthetic fuzzy sets that are similar to the real data is useful for testing methods where real data is limited. We next detail how the fuzzy sets are generated.
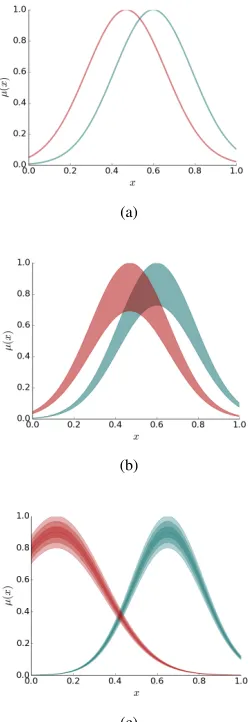
In mode-1, fuzzy sets have Gaussian membership functions. The mean, standard deviation and height of each function is pseudo-randomly generated within a user-defined range. For example, if the height range is set as[0.7,1.0]then the height of all generated sets will be a value within this inclusive interval. If the user wants all fuzzy sets to be normal then the range should be set to[1,1]. This is how type-1 fuzzy sets are generated; Fig. 1a shows an example.
For interval type-2 fuzzy sets, the upper membership func-tion is generated with the same method and user set parameters as for type-1 fuzzy sets. The lower membership function of each fuzzy set has the same mean and standard deviation as the upper membership function, but the height is different. Currently, the height difference is set by a single value defined by the user. For example, if the value is 0.2, then for each value of xin the fuzzy setF˜,µ˜
F(x) =µF˜(x)−0.2(whereµandµ
are the lower and upper membership functions, respectively). Fig. 1b shows example mode-1 interval type-2 fuzzy sets.
General type-2 fuzzy sets are constructed using the zSlices/alpha-planes representation [6], [7]. They are viewed as a collection of interval type-2 fuzzy sets that are assigned secondary membership (z) values that, unlike regular interval type-2 fuzzy sets, may be less than 1.0.
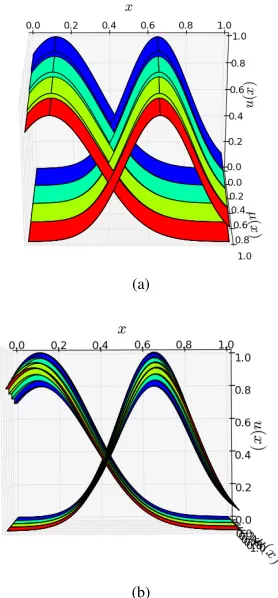
To generate general type-2 fuzzy sets, the upper and lower membership functions of the lowest zSlice (lowest value of secondary membership) is calculated as an interval type-2 fuzzy set as described above. Next, the highest zSlice (z= 1) is calculated as the type-1 fuzzy set at the centre of the lowest zSlice. Fig. 4 shows an example of the lowest and highest zSlices of a generated set. All remaining zSlices in between are calculated as interval type-2 fuzzy sets with membership functions equidistant from neighbouring zSlices. Fig. 1c and Fig. 5 show example mode-1 general type-2 fuzzy sets constructed with four zSlices. The former shows a two-dimensional representation, in which darker shades indicate higher secondary membership values. The latter shows a
three-(a)
(b)
[image:2.612.373.498.56.417.2](c)
Fig. 1: Examples of mode-1 generated fuzzy sets (a) type-1 (b) interval type-2 and (c) general type-2.
dimensional plot in which a heat-map shows changes in secondary membership.
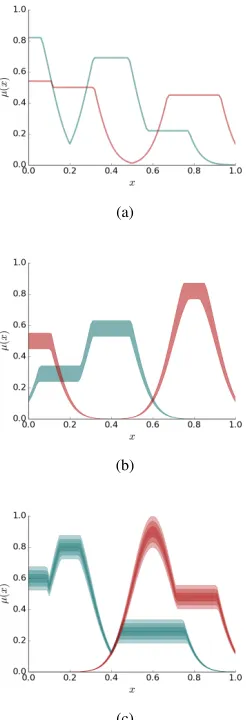
Mode-2 creates convex fuzzy sets to model non-parametric data. Fuzzy sets are created from the union of two pseudo-randomly generated membership functions. Fig. 2 shows example mode-2 fuzzy sets.
For type-1 fuzzy sets, two Gaussian functions are generated in the same method as mode-1. Both functions have means and standard deviations within the same user-defined range. Separate user-set parameters are used to choose the heights of the membership functions. This design choice is so the user can choose only one of the two membership functions to be normal; i.e., so there is only one x ∈ X for a fuzzy set F where µF(x) = 1. With separate ranges, it is also possible
to set both functions to be normal or both non-normal. Each fuzzy set in mode-2 is defined by the union of these two generated membership functions. Fig. 2a shows an example mode-2, type-1 fuzzy set.
(a)
(b)
[image:3.612.118.273.50.424.2](c)
Fig. 2: Examples of mode-2 generated fuzzy sets (a) type-1 (b) interval type-2 and (c) general type-2.
generated using the same method as mode-2, type-1 fuzzy sets, and the lower membership function is the same but with decreased membership values. As with mode-1, the difference in upper and lower membership values is set by the user.
The generation of mode-2 general type-2 fuzzy sets is the same as that described for mode-1. A mode-2 interval type-2 fuzzy set is generated for the lowest zSlice and the highest zSlice is a type-1 fuzzy set at the centre of the lowest zSlice. All remaining zSlices are constructed in between these two.
Mode-3 models possible outputs of a fuzzy logic system. These are based on equidistant Gaussian functions (shown in Fig. 6) representing possible consequents of fuzzy rules. Type-1, interval type-2 and general type-2 fuzzy sets in mode-3 are generated using the same method. For each fuzzy set of mode-3, up to n(default is three) output sets from Fig. 6 and their firing level in[0,1]are pseudo-randomly chosen to model the result of max-min inference. Fig. 3 shows example mode-3 fuzzy sets.
A fixed seed is used to generate pseudo-random numbers to select, for example, the mean and variance of Gaussian
(a)
(b)
[image:3.612.375.498.56.416.2](c)
Fig. 3: Examples of mode-3 generated fuzzy sets (a) type-1 (b) interval type-2 and (c) general type-2.
Fig. 4: A general type-2 fuzzy set with two zSlices. The lowest zSlice is an interval type-2 fuzzy set, and in the centre of this is the highest zSlice, which is a type-1 fuzzy set.
[image:3.612.365.508.488.595.2](a)
[image:4.612.104.243.52.351.2](b)
Fig. 5: Three-dimensional model of the fuzzy sets in Fig. 1c.
TABLE I: Overview of library directory.
utilities/
generate sets t1.py generate sets it2.py generate sets gt2.py plot sets t1.py plot sets it2.py plot sets gt2.py user defined variables.py
B. How to use the library
The library has been designed to be run from command line without requiring any knowledge of the underlying code. Note that, currently, no graphical user interface is available. Table I contains a list of files within the library. Files generate sets *.py are used to generate fuzzy sets and files plot sets *.py are used to plot graphs of the generated sets. The folder utilities contains modules that assist set genera-tion and plotting - these are not run directly by the user but are open-source and free to be altered. Finally, the file user defined variables enables the user to set variables such as the mean and variance ranges for membership functions. For a detailed view of the structure of the software, see the online API provided with the library.
1) Generating fuzzy sets: To generate synthetic fuzzy sets, the following is run:
python generate sets *.py mode total file
where * indicates the fuzzy set type (t1: type-1, it2: interval
(a)
(b)
[image:4.612.373.498.55.419.2](c)
Fig. 6: Base fuzzy sets used to generate mode-3 fuzzy sets..
type-2, gt2: general type-2), mode indicates the membership function mode (1, 2 or 3),total is the total number of fuzzy sets to be generated, and fileis where the sets are stored.
For example, the following:
python generate sets t1.py 1 10 sets.csv
creates 10 type-1 fuzzy sets of mode-1 and saves the resulting sets in the filesets.csv.
2) Plotting fuzzy sets: To plot generated type-1 or interval type-2 fuzzy sets, the following is run:
python plot sets *.py readfile range [savefile]
where readfile is the csv file containing fuzzy sets, range indicates the range of fuzzy sets plotted andsavefileis where the figure is saved. The parametersavefile is optional. If not given, the plot is displayed on the screen. range may be- to include all fuzzy sets, may indicate ranges using-(e.g.,2-5), or list individual indexes using.(e.g.,3.6.9). For example, the range2-4.7will plot fuzzy sets at indexes 2, 3, 4 and 7. Note that indexes begin at 0, not 1.
The following is an example of how to plot fuzzy sets python plot sets t1.py sets.csv - sets.pdf
resulting figure in sets.pdf. A wide range of image formats are supported, including png, pdf, eps and tiff. A full list of supported formats is displayed when an unsupported format is attempted.
The command for general type-2 fuzzy sets is different as it enables the user to choose between two- or three-dimensional graphs (e.g., Fig. 1c and Fig. 5, respectively). In two-dimensional graphs, changes in secondary membership values are shown through shading - darker shades indicate higher membership. Three-dimensional sets have the option of shading through colour, greyscale or heatmap to show in-creases in secondary membership values. The shading method can be chosen within the file user defined variables.py (de-scribed in the next section). The three-dimensional plots can be rotated to view the fuzzy sets from any angle when displayed on the screen, as demonstrated in Fig. 5. However, it is not possible to manipulate the angle of three-dimensional plots when saved straight to file. The following is run to plot general type-2 fuzzy sets:
python plot sets gt2.py readfile range space [savefile] in whichread file,rangeandsavefileare as described above, andspace can be either2d or3d. For example,
python plot sets gt2.py sets.csv - 3d
displays on the screen all of the sets in sets.csv in a three-dimensional plot.
3) Specifying parameters: Users can set variables, such as the range of mean and standard deviation values of the generated Gaussian membership functions. Parameters are set in the fileuser defined variables.py. The list of variables that can be set are:
- DISC XTotal number of discretisations along thex-axis. - DISC Z Total number of discretisations along thez-axis
(for secondary membership values).
- MEAN RANGE Range of mean values for Gaussian membership functions.
- VAR RANGE Range of standard deviation values for Gaussian membership functions.
- HEIGHT RANGE 1 Range of values for the height (highest membership value) of the mode-1 membership functions and of the first of the two mode-2 membership functions. Height ranges enable the user to create normal or non-normal fuzzy sets. For example, the interval[1,1] ensures normal membership functions. Setting [0.8,1.0] will result in membership functions with heights chosen within this range.
- HEIGHT RANGE 2 Range of values for the height of the second of the mode-2 membership functions. - HEIGHT DECREASE LMF The amount by which the
lower membership function of a type-2 fuzzy set is lower than the higher membership function. For example, if the parameter is set to 0.2 and the height of a fuzzy set’s upper membership function is 1.0 then the height of its lower membership function will be 0.8. This applies to interval type-2 fuzzy sets and the lowest zSlice of general type-2 fuzzy sets.
- FLS TOTAL MFS USEDTotal number of functions, out
of those in Fig. 6, used to create fuzzy logic system outputs.
- 3D SHADING Sets the shading method for three-dimensional plots of general type-2 fuzzy sets. Options areUNIQUE,GREYSCALE andHEATMAP.
Note that the membership functions for the fuzzy sets in Fig. 6 can be scaled usingMEAN RANGE. Fig. 6 shows the fuzzy sets whenMEAN RANGE = [0, 1]. Other changes can be made by altering the code.
The variable DISC Y does not exist because membership values are generated rather than chosen (xandzare chosen). Currently, membership values are given to a precision of four decimal places.
C. Storage of fuzzy sets
The ability to export fuzzy sets enables SyFSeL to be used to independently generate sets for use with other fuzzy systems software. Fuzzy sets generated by the library are stored in csv files. This section details how to read these files so the generated sets may be imported into the user’s own fuzzy systems software. Note that thex, primary and secondary axes are discrete. The total discretisations of thexandzaxes can be set in theuser defined variablesfile by the variablesDISC X andDISC Z, respectively.
Type-1 fuzzy sets are stored as (x-value, membership-value) pairs. We formally write this as:
F ={(x, µF(x))| ∀x∈X} (1)
whereX is the set of all discrete values ofxthat we assign membership. Note that even if a membership value is 0 at x, we still store the (x,0) pair. Table II shows an example of three fuzzy sets and their membership at four xvalues as stored by the toolkit. The first fuzzy set is written, using (1), as
{(0,0),(0.01,0),(0.02,0.003),(0.03,0.008), ...}
In an interval type-2 fuzzy setF˜, interval membership val-ues ([µ˜
F(x), µF˜(x)]) are assigned toxvalues. These are stored
as (x-value, interval-membership-value) pairs. We formally write this as:
˜
F ={(x,(µF˜(x), µF˜(x)))| ∀x∈X} (2)
Table III shows an example of three fuzzy sets and their membership at fourxvalues. Interval membership values are written asa;b pairs, where a andb are the lower and upper membership values. The first fuzzy set is written using (2) as
{(0.00,(0.494; 0.625)),(0.01,(0.536; 0.678)), (0.02,(0.577; 0.730)),(0.03,(0.616; 0.779)), ...}
TABLE II: Type-1 Fuzzy Set csv Representation.
x Fuzzy sets
[image:6.612.79.267.158.223.2]0.0, 0, 0.336, 0.249 0.01, 0.00, 0.372, 0.292 0.02, 0.003, 0.410, 0.339 0.03, 0.008, 0.449, 0.389 ...
TABLE III: Interval Type-2 Fuzzy Set csv Representation.
x Fuzzy sets
[image:6.612.70.279.252.316.2]0.00, 0.494;0.625, 0.000;0.000, 0.000;0.000 0.01, 0.536;0.678, 0.000;0.000, 0.000;0.000 0.02, 0.577;0.730, 0.001;0.001, 0.000;0.000 0.03, 0.616;0.779, 0.002;0.002, 0.001;0.001 ...
TABLE IV: General Type-2 Fuzzy Set csv Representation.
x z Fuzzy sets
0.00 0.5| 0.003;0.004| 0.000;0.000| 0.000;0.000, 1.0| 0.004;0.004| 0.000;0.000| 0.000;0.000 0.01 0.5| 0.004;0.005| 0.000;0.000| 0.001;0.001,
1.0| 0.005;0.005| 0.005;0.005| 0.001;0.001 ...
an interval (primary membership) (as done with interval type-2 fuzzy sets). We write this as
˜
F ={(x,{z,(µ˜
F(x, z), µF˜(x, z))})| ∀x∈X,∀z∈Z}. (3)
whereµ˜
F(x, z)andµF˜(x, z)are the lower and upper interval
membership values ofF˜ atxandz. Thus, eachxis assigned a set of z (secondary) and (µ˜
F(x, z), µF˜(x, z)) (primary)
membership pairs. If the fuzzy set is empty at x, we write the set atxas{(z,(0,0))| ∀z∈Z}. Note that we have used only the zSlices method of representing general type-2 fuzzy sets - the library does not store the sets in the vertical slice or embedded slice format.
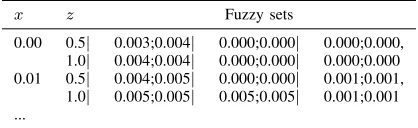
In a general type-2 fuzzy set, each xis assigned a set; i.e., each fuzzy set is written as a set within a set. Likewise, the csv file stores general type-2 fuzzy sets as a table within a table. As with interval type-2 fuzzy sets in Table III, intervals assigned to eachxandzare written asa;bpairs. In each row of a general type-2 csv file, xis written first. Next,z values are separated by,and fuzzy sets are separated by|. Table IV shows an example of three fuzzy sets with two xvalues and two z values (0.5 and 1.0). The first fuzzy set is read, using (3), as
{0.00,{(0.5,(0.003; 0.004)),(1.0,(0.004; 0.004))},
0.01,{(0.5,(0.004; 0.005)),(1.0,(0.005; 0.005))}, ...}
This section has presented how SyFSeL generates sets, how to run SyFSeL to generate and plot sets, and how sets are stored so they can be imported into other fuzzy systems software. In the future, alternative methods of exporting fuzzy sets will be available. We next present conclusions and future work.
III. CONCLUSIONS ANDFUTUREWORK
This paper presents an open-source, cross-platform library named SyFSeL that automatically generates synthetic fuzzy sets with specified characteristics (including parametric, non-parametric) and fuzzy set type (type-1, interval/general-type-2). The generated fuzzy sets are stored in csv format so users can import them into their own fuzzy systems software without requiring an understanding of the code within the library. In the future, alternative methods of exporting will also be available. The library is useful for generating sets for empirical tests, whilst other software relies on the user already having sufficient data. For example, SyFSeL can be used to generate sets for testing methods of comparing fuzzy sets for classification by generating sets with similar and differing parameters to represent correct and incorrect classifications. Another example use is generating a variety of non-singleton inputs for a robust test of a fuzzy logic system.
SyFSeL is unique to current fuzzy systems software which mostly aids in designing and analysing fuzzy logic systems, or solving specific problems in a given field. The library is avail-able and maintained at https://bitbucket.org/JosieMcCulloch/ syfsel. The code is written in Python and is free to be altered under the terms of the GNU General Public License. However, no knowledge of the code is required to use it. The library is run from command line to generate and plot sets; note, there is no graphical user interface. We ask authors/developers to please reference this paper when using SyFSeL.
The library’s intent is to provide the ability to automati-cally create synthetic fuzzy sets, store them and plot them. Future work will increase the usability and flexibility of these components. To preserve a single, clear purpose of the library, major features outside of this area will not be developed. Users are invited to highlight bugs and suggest new capabilities through up-to-date contact information provided online with the library.
REFERENCES
[1] S. Guillaume and B. Charnomordic, “Learning interpretable fuzzy in-ference systems with FisPro,” Information Sciences, vol. 181, no. 20, pp. 4409–4427, 2011. Special Issue on Interpretable Fuzzy Systems. [2] I. Baturone, F. J. Moreno-Velo, S. S´anchez-Solano, ´A. Barriga, P. Brox,
A. A. Gersnoviez, and M. Brox, “Using Xfuzzy environment for the whole design of fuzzy systems,” in Fuzzy Systems Conference, 2007. FUZZ-IEEE 2007. IEEE International, pp. 1–6, IEEE, 2007.
[3] N. Karnik, Q. Liang, F. Liu, D. Wu, J. Jhoo., and J. Mendel, “Type-2 fuzzy logic software (freeware),” 2008.
[4] J. Alcal´a-Fdez and J. M. Alonso, “A Survey of Fuzzy Systems Software: Taxonomy, Current Research Trends, and Prospects,”IEEE Transactions on Fuzzy Systems, vol. 24, pp. 40–56, Feb 2016.
[5] J. Alcal´a-Fdez and J. Alonso, “Fuzzy Systems Software: Taxonomy, Current Research Trends and Prospects.” [Online]. Available: http://sci2s. ugr.es/fss’ [Accessed: 01-Feb-2018].
[6] C. Wagner and H. Hagras, “Toward General Type-2 Fuzzy Logic Systems Based on zSlices,” Fuzzy Systems, IEEE Transactions on, vol. 18, pp. 637–660, Aug. 2010.