1 Exploring the advantages of multiband fMRI with simultaneous EEG to investigate coupling
between gamma frequency neural activity and the BOLD response in humans.
Makoto Ujia, Ross Wilsona, Susan T. Francisb, Karen J. Mullingera,b*†, Stephen D. Mayhewa*
a Centre for Human Brain Health (CHBH), School of Psychology, University of Birmingham, Birmingham, UK
b Sir Peter Mansfield Imaging Centre (SPMIC), School of Physics and Astronomy, University of Nottingham, Nottingham, UK
* these authors were equally responsible for leading this study
2
Abstract
We established an optimal combination of EEG recording during sparse multiband (MB) fMRI
that preserves high resolution, whole brain fMRI coverage whilst enabling broad-band EEG
recordings which are uncorrupted by MRI gradient artefacts (GAs). We firstly determined the
safety of simultaneous EEG recording during MB fMRI. Application of MB factor=4 produced
<1°C peak heating of electrode/hardware during 20-minutes of GE-EPI data acquisition.
However, higher SAR sequences require specific safety testing, with greater heating observed
using PCASL with MB factor=4. Heating was greatest in the electrocardiogram channel, likely
due to it possessing longest lead length. We investigated the effect of MB factor on the temporal
signal to noise ratio for a range of GE-EPI sequences (varying MB factor and temporal interval
between slice acquisitions). We found that, for our experimental purpose, the optimal
acquisition was achieved with MB factor=3, 3mm isotropic voxels and 33 slices providing
whole head coverage. This sequence afforded a 2.25s duration quiet period (without GAs) in
every 3s TR. Using this sequence we demonstrated the ability to record gamma frequency
(55-80Hz) EEG oscillations, in response to right index finger abduction, that are usually obscured
by GAs during continuous fMRI data acquisition. In this novel application of EEG-MB fMRI
to a motor task we observed a positive correlation between gamma and BOLD responses in
bilateral motor regions. These findings support and extend previous work regarding coupling
between neural and haemodynamic measures of brain activity in humans and showcase the
utility of EEG-MB fMRI for future investigations.
Keywords
EEG-fMRI
Multiband or multislice fMRI Gamma-BOLD coupling Gradient artefacts
Safety Heating
3
Introduction
Electroencephalography (EEG) and functional magnetic resonance imaging (fMRI) are two
neuroimaging techniques that are often used to investigate human brain function. Simultaneous
EEG-fMRI recordings provide a wide range of complimentary information and can be
advantageous for improving our understanding of brain function, for example: through
investigating the spatiotemporal dynamics of neural activity (for a review, see Huster et al.,
2012), or studying the underlying neurophysiological origins of the measured responses by
comparing neural and haemodynamic signals e.g. (Mullinger et al., 2013). The primary
advantage of simultaneous EEG-fMRI acquisition over separate recordings is that it enables
investigation of unpredictable or spontaneous brain activity, as well as studying the
trial-by-trial covariation in brain processing as measured by the two techniques (Bagshaw et al., 2004;
Becker et al., 2011; Debener et al., 2006; Eichele et al., 2008; Goldman et al., 2002; Horovitz
et al., 2008; Mayhew et al., 2013; Mobascher et al., 2009; Mullinger et al., 2014; Olbrich et al.,
2009; Scheibe et al., 2010). Thus simultaneous recordings enable spatial localisation of
temporally dynamic response features. EEG-fMRI analysis has provided many novel insights
into brain function. For example, such analyses have demonstrated specific BOLD correlates
of: distinct neurophysiological components including the auditory oddball (Bénar et al., 2007;
Eichele et al., 2005) and the error-related negativity (Debener et al., 2005); as well as specific
neural activity in specific frequency bands (Goldman et al., 2002; Laufs et al., 2003). These
studies have shown that simultaneous EEG-fMRI can provide greater specificity regarding the
spatial arrangement (Goldman et al., 2009; Novitskiy et al., 2011) or the temporal sequence
(Eichele et al., 2005; Mayhew et al., 2012) of responsive brain areas, compared to that revealed
by a standard analysis of data from a single neuroimaging modality.
Recently, neuronal activity in the gamma frequency band, which is typically defined as
4 has been linked with a range of cognitive and sensory functions (Buschman and Miller, 2007;
Buzsaki and Draguhn, 2004; Colgin et al., 2009; Fries, 2009; Singer and Gray, 1995).
Gamma-band synchronization has been observed in humans using non-invasive imaging methods
during visual (Hoogenboom et al., 2006; Muthukumaraswamy and Singh, 2013),
somatosensory (Bauer et al., 2006) and auditory (Pantev et al., 1991; Schadow et al., 2009)
stimulation. It is also known to be involved in higher cognitive functions such as memory
processes (Fell et al., 2001; Howard et al., 2003) and motor control (Brown et al., 1998; Cheyne
et al., 2008; Crone et al., 1998; Darvas et al., 2010; Gaetz et al., 2010; Muthukumaraswamy,
2010; Schoffelen et al., 2005). Therefore, due to the functional importance of gamma frequency
activity, characterising the underlying mechanisms of these responses is of great interest.
The majority of previous work investigating the link between BOLD signals and gamma
activity has been conducted using invasive electrode recordings of local-field potentials in
humans (Mukamel et al., 2005; Murta et al., 2016; Nir et al., 2007), primates (Logothetis et al.,
2001; Magri et al., 2012; Niessing et al., 2005; Scholvinck et al., 2010; Viswanathan and
Freeman, 2007) and rodents (Boorman et al., 2015; Sumiyoshi et al., 2012). These studies
showed the BOLD response is more strongly coupled to gamma frequency activity, compared
with the activity in the lower (<30Hz) frequency bands.
Whilst providing novel insights into neurovascular coupling, findings from invasive animal
recordings cannot be easily extrapolated to scalp electrophysiological recordings due to
differences in the recording references used and in the spatial scale of the neuronal populations
involved in generating the signals (Hall et al., 2005). In addition, although the coupling
between BOLD and gamma-LFP activity is widely cited as principle evidence for the neural
underpinnings of haemodynamic based functional neuroimaging, the majority of these seminal
studies have been conducted in visual cortex (Logothetis et al., 2001; Viswanathan and
5 understanding in other brain regions, for example sensorimotor cortex, is important to fully
establish the fundamental nature of the gamma-BOLD relationship. Such investigations are
particularly important given the recent doubt cast on the functional importance of narrow-band
gamma responses in visual cortex (Hermes et al., 2014), and the BOLD correlates of broader
high-frequency activity (Winawer et al., 2013). Therefore non-invasive simultaneous
EEG-fMRI recordings in humans offer many potential advantages for relating gamma and BOLD
signals. Possibilities include extending previous studies suggestions of a strong gamma-BOLD
relationship by investigating this coupling in motor paradigms, which have been widely shown
to induce robust increases in gamma power (Cheyne et al., 2008; Crone et al., 1998; Gaetz et
al., 2010; Muthukumaraswamy, 2010), and gaining a fuller understanding of the fundamental
relationship of these signals to each other and also to human behaviour (Hoogenboom et al.,
2010; Womelsdorf et al., 2006).
However, few simultaneous EEG-fMRI studies have investigated gamma activity due to
technical limitations as detailed below, and consequently the relationship between
haemodynamic responses and the gamma band activity in humans remains incompletely
understood (Logothetis, 2008). The recording of EEG data in the MRI environment is
technically challenging primarily due to the effect of the MRI on the EEG data quality. Namely,
EEG data are corrupted by the gradient artefact (GA) produced by the time-varying magnetic
field gradients needed for imaging, the pulse artefact produced by cardiac pulse driven motion
in the strong magnetic field of the MR scanner, and motion artefacts due to head movement in
the MR environment (Mullinger and Bowtell, 2011). The frequency characteristics of these
artefacts mean that the GA is the primary problem for studying gamma band activity, with
residual GAs easily obscuring the small amplitude neuronal signal of interest even after
6 Despite the technical challenges, a few studies have attempted to study the gamma band using
concurrent EEG and fMRI measures (Castelhano et al., 2014; Green et al., 2017; Leicht et al.,
2016; Mantini et al., 2007; Michels et al., 2010; Mulert et al., 2010; Rosa et al., 2010;
Scheeringa et al., 2011). Of these a number limited the frequency range of the measured gamma
band to a range of 30-50Hz (or narrower) to avoid the high frequencies where the GAs
dominate (e.g. Mantini et al., 2007; Mulert et al., 2010; Rosa et al., 2010). However, this band
limiting approach, is clearly suboptimal when gamma responses that are often reported in the
upper portion of the 30-100 Hz frequency range (Muthukumaraswamy, 2010) have been related
to behaviour and other neuronal measures e.g. GABA concentration (Muthukumaraswamy et
al., 2009). An alternative approach taken by other studies, or in addition to band-limiting
gamma, has been to adopt a sparse fMRI sequence (Leicht et al., 2016; Mulert et al., 2010;
Scheeringa et al., 2011) rather than conventional, continuous fMRI acquisition. Sparse
sequences feature an acquisition time shorter than the repetition time (TR) of the MRI sequence
in order to provide a time window with no MRI gradients present in which to collect EEG data.
As a result this approach enables the full gamma frequency range to be investigated. However,
conventional MRI sequences require a long TR (>3s) and/or small number of slices to be
acquired to provide the required sparsity; imposing limitations in the temporal sampling or
spatial coverage possible and consequently limiting the utility of the fMRI data acquired.
Therefore in order to optimize simultaneous EEG-fMRI recordings to study gamma-BOLD
coupling, we need to establish a novel method to obtain cleaner EEG data in the high (>30Hz)
frequency band. Multiband (MB) fMRI has the potential to overcome the limitations imposed
by conventional sparse fMRI sequences. MB acquisition (Feinberg et al., 2010; Moeller et al.,
2010) can be employed to: shorten repetition times (TR); increase brain coverage for a given
TR; or shorten the acquisition time of whole-head fMRI in a sparse fMRI sequence which
7 fMRI acquisitions therefore offer great potential for improving EEG data quality during
simultaneous acquisitions. However, due to the additional radio frequency (RF) power of MB
excitation the safety of EEG-MB fMRI acquisitions must be assessed (Auerbach et al., 2013).
In addition, as MB methods can affect temporal signal to noise (tSNR) of fMRI data (Chen et
al., 2015; Todd et al., 2016) assessing the implementation of MB and the effect on fMRI tSNR
is also important to enable optimised EEG-fMRI studies to take place.
Therefore the aim of this work was to assess the overall feasibility of recording EEG
simultaneously with MB fMRI in humans. This took place in three parts: i) assessing the safety
implications of EEG-MB fMRI; ii) assessing the tSNR of MB fMRI and iii) applying an
optimised EEG-MB fMRI approach to investigate single-trial coupling relationships between
MB-BOLD and gamma and beta frequency EEG responses to a finger-abduction motor task.
We chose to investigate motor responses as an event-related synchronisation (ERS) of gamma
oscillations (reflecting an increase in power), typically accompanied by desynchronization
(ERD) of beta frequency (15-30Hz) oscillations (reflecting a reduction in power), in the
primary motor cortex contralateral to the movement have been well documented using invasive
electroencephalography (ECoG) (Darvas et al., 2010), MEG (Muthukumaraswamy, 2010) and
EEG (Cheyne et al., 2008) (for reviews, Cheyne and Ferrari, 2013; Cheyne, 2013;
Muthukumaraswamy, 2013). To our knowledge, the motor gamma-BOLD relationship has not
previously been investigated with simultaneous EEG-fMRI acquisition in humans. Therefore,
through this proof of concept study we also aim to widen the understanding of gamma-BOLD
coupling across the cortex. We hypothesise that the single-trial positive BOLD response in
contralateral motor cortex will correlate positively with gamma power ERS and negatively with
8
Methods
Data were acquired and analysed in two stages. Stage one consisted of initial safety testing and
image-quality optimisation of EEG-MB fMRI; whilst stage two involved the application of the
optimised scanning protocol for the concurrent EEG-fMRI study of human brain responses
during motor tasks.
During both stages, EEG data were acquired using BrainAmp MRplus EEG amplifiers (Brain
Products, Munich) with 5kHz sampling rate and an MR-compatible 63-channel EEG cap
(EasyCap, Herrsching). The hardware band-pass filters were set to a 0.016-250 Hz range, with
a roll-off of 30 dB/octave at high frequency. Electrode layout followed the extended
international 10-20 system with an additional channel for recording the electrocardiogram
(ECG). FCz was used as the reference electrode. A 3T Philips Achieva MRI scanner with a
body transmit and 32-channel receiver-array head coil was used for MR data acquisition. The
MB implementation for fMRI acquisitions in this study was from Gyrotools, Zurich. MR-EEG
scanner clocks were synchronised for all EEG data acquisition (Mullinger et al., 2008b). All
data acquisition on humans was performed with approval from the local ethics committee and
informed consent was obtained from all subjects involved in this project.
Stage 1: Assessing the safety and tSNR of EEG-MB fMRI
Safety testing
Safety testing was performed on a conductive, head shaped phantom with a conductivity of
about 0.5Ω-1m-1 to mimic skin conductivity (Yan et al., 2010). The phantom was left in the scanner room over night to equilibrate to the ambient temperature. The EEG cap was then
connected to the phantom using conductive gel (Abralyte 2000 [EasyCap GmbH, Munich])
9 Corporation, Santa Clara, CA, USA) were used to continually monitor (1 Hz sampling rate)
heating effects at seven locations: four scalp electrodes (Cz, TP7, FCz & TP8), the ECG lead
(connected to the base of the phantom’s neck), the cable bundle coming from the EEG cap and
the scanner bore (as a control measurement of heating effects unrelated to the presence of the
EEG system). Thermometer sensors were placed in the conductive gel under the electrodes and
taped to the surface of the cable bundle and scanner bore. The phantom was then placed at the
MR scanner iso-centre. Firstly, a 5-minute recording of baseline temperature at each location
was collected without any scanning. Then two 20-minute MRI scans, both employing MB
factor 4 and spectral presaturation with inversion recovery (SPIR) fat suppression, were
performed to test for heating during the highest realistic values of specific absorption rate
(SAR) for a given sequence type. Please note MB factor 4 was the highest available in this
implementation of MB. The sequences tested were: 1) gradient echo (GE)-EPI (using:
TR/TE=1000/40ms, SENSE=2, slices=48, B1 RMS=1.09μT, SAR/head=22%); 2)
Pseudo-continuous arterial spin labelling (PCASL)-GE-EPI (using: TR/TE=3500/9.8ms, SENSE=2,
slices=32, B1 RMS=1.58μT, SAR/head=46%). Between the two MRI scans there was a 10
minute period without scanning to allow a return to baseline following any heating effects from
the previous MRI scan.
Analysis
The mean baseline temperature at each thermometer location was determined using the 5
minute recording prior to each MRI scan. For each location, the mean baseline temperature
was then subtracted from the temperature timeseries recorded during each scan to give the
change in temperature across the whole 20 minute scan period.
10 To assess the effect of the implementation of MB excitation on the fMRI signal tSNR, fMRI
data were recorded on 3 healthy-adult subjects (age 32 ± 2 years) during five different GE-EPI
pulse sequences:
i) MB factor = 1 with equidistant slice acquisition
ii) MB factor = 2 with equidistant slice acquisition
iii) MB factor = 2 with sparse slice acquisition
iv) MB factor = 3 with equidistant slice acquisition
v) MB factor = 3 with sparse slice acquisition
Equidistant acquisition used the full TR period, comprised of equal temporal intervals between
each slice acquisition. For sparse acquisitions MR data were acquired in the minimum possible
time at the beginning of the TR period; the rest of the TR period then formed a quiet period
with no MR gradients. A TR = 3060ms and 36 slices were chosen to ensure that these
parameters could be used for all combinations of MB factors and slice acquisition (in scans
i-v) whilst adhering to requirements for EEG clock synchronisation (Mandelkow et al., 2006;
Mullinger et al., 2008b). Other parameters were set for all scans as follows: TE= 40ms,
SENSE=2, flip angle=79°, 41 volumes acquired. A T1-weighted anatomical image was also
acquired for each subject.
Analysis
For each subject the anatomical image was used to segment the grey matter (FSL FAST,
https://fsl.fmrib.ox.ac.uk/fsl/) (Zhang et al., 2001) which formed a mask for subsequent
analysis. The tSNR was calculated in every grey matter voxel (Eq. 1) and then averaged over
voxels for each subject. The group mean and standard deviation in grey matter of the tSNR
was then found for each of the five scans to assess the change in tSNR with MB factor and
11
𝑡𝑆𝑁𝑅𝑣𝑜𝑥𝑒𝑙 = 𝑚𝑒𝑎𝑛 𝑠𝑖𝑔𝑛𝑎𝑙 𝑜𝑣𝑒𝑟 𝑡𝑖𝑚𝑒𝑣𝑜𝑥𝑒𝑙 𝑠𝑡𝑎𝑛𝑑𝑎𝑟𝑑 𝑑𝑒𝑣𝑖𝑎𝑡𝑖𝑜𝑛 𝑜𝑣𝑒𝑟 𝑡𝑖𝑚𝑒𝑣𝑜𝑥𝑒𝑙
Eq. 1
Stage 2: EEG-fMRI motor study
12 right-handed subjects (10 males, 2 females, age = 26.6 ±5.7) took part in the study. After
initial data processing, two subjects were excluded from further analysis due to repeated,
excessive head motion (>4mm, as assessed from fMRI realignment parameters).
Data acquisition
The EEG cap was put on the subject and all electrode impedances were maintained below 10kΩ
for the duration of the study. EEG-fMRI data were acquired using a sparse GE-EPI scheme
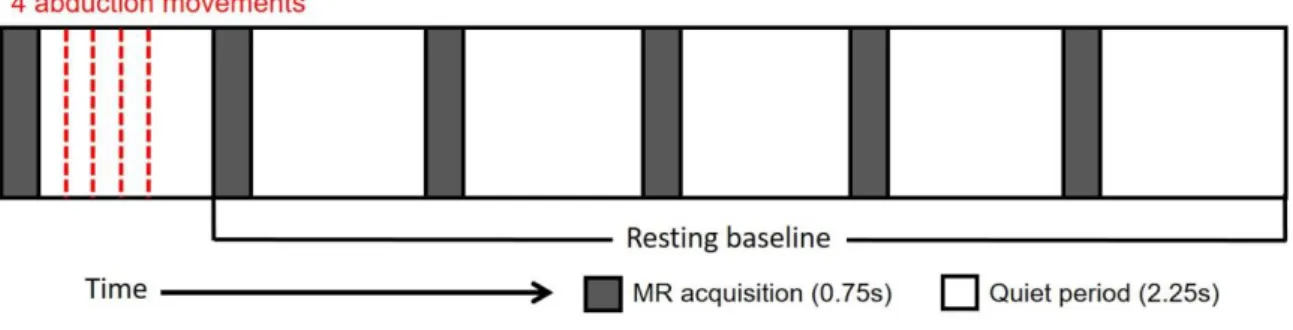
(TR=3000ms (of which: acquisition time=750ms, quiet period=2250ms), TE=40ms, MB
factor=3, 33 slices, voxels=3mm3, SENSE = 2, FOV = 240 x 240 mm, flip angle = 79°, 192 volumes, SAR/head<7%). These parameters had been optimised based on the results of Stage
1 and the requirements of the paradigm (see below). High frequency (>30 Hz) artefacts were
minimised by mechanically isolating the EEG amplifiers from the scanner bed and minimising
MR scanner room environment noise (Mullinger et al., 2013; Mullinger and Bowtell, 2011). In
addition, the subject was positioned such that electrodes Fp1 and Fp2 were at the iso-centre in
the foot/head direction so as to further reduce the amplitude of the GAs (Mullinger et al., 2011).
Foam padding was placed around the subject's head to reduce motion-related artefacts. The
EEG and MR scanner clocks were synchronised (Brain Products Synchbox), and the TR made
equal to a multiple of the EEG sampling period, to ensure consistent sampling of the GA
waveforms (Mandelkow et al., 2006; Mullinger et al., 2008b). The onset of every TR period
was marked in the EEG data to facilitate GA correction. Simultaneous electromyogram (EMG)
12 of the right hand using a Brain Product EXG amplifier. Cardiac and respiratory cycles were
simultaneously recorded using the scanner's physiological monitoring system (vector
cardiogram (VCG) and respiratory belt). A T1-weighted anatomical image (MPRAGE
sequence) with 1mm isotropic resolution was also acquired. EEG electrode locations were
digitised (Polhemus Fastrak) to facilitate individualised co-registration of electrode positions
with each subject’s anatomical image.
Paradigm
Subjects performed abduction movements of the right-hand index finger in time with an
auditory cue (1 kHz tones, 50ms duration, 2.5Hz presentation rate) that was delivered to both
ears via headphones, as previously employed in an MEG study (Muthukumaraswamy, 2010).
A single trial consisted of four abduction movements which were performed briskly following
each auditory cue within the MR gradient quiet period of a single TR. The onset of the first cue
was 250ms after the end of the MR acquisition in that TR, such that the cues occurred at 1000,
1400, 1800 and 2200ms relative to the start of a given TR, resulting in all movements occurring
within a 1.5s window for each trial. Abduction trials were separated by a 16s (five 3s TR
periods + 750ms MR acquisition + 250ms) resting baseline interval (see Figure 1). Subjects
were instructed to fixate on a centrally displayed cross, to keep their hands by their sides and
to remain as still as possible throughout the whole experiment. Immediately prior to the first
auditory cue of each trial, a visual cue appeared, the fixation cross changed to a plus sign for
2s, warning the subjects to prepare for the upcoming trial. Subjects performed a 10-minute
practice outside the scanner (50 trials of the same auditory cued abduction task for 1.5s,
13 paradigm and were then subsequently positioned inside the MRI scanner where they each
completed four runs of 30 trials during fMRI, resulting in 120 trials per subject in total.
Analysis
EEG
Cardiac R-peaks were detected from the VCG recording and used to inform pulse artefact
correction of data recording inside the scanner (Mullinger et al., 2008b). For both EEG and
EMG data, gradient and pulse artefacts were corrected in BrainVision Analyzer2 using sliding
window templates formed from the averages of 45 and 21 artefacts respectively, which were
subtracted from each occurrence of the respective artefacts. Data were subsequently
downsampled (600Hz), bandpass filtered (EEG: 0.5-120Hz, EMG: 0.5-45Hz) and epoched into
single-trials from -16s to 2s relative to the onset of the first auditory cue in each trial
(BrainVision Analyzer2). Through visual inspection of the data, noisy EEG channels and trials
that were contaminated with large motion artefacts, substantial EMG activity during the
baseline period, or showed a lack of abduction movement in the EMG signal, were removed.
This resulted in a group mean (±standard error [SE]) of 84 ± 2 trials remaining for further
analysis. Independent component analysis of the EEG data (ICA, EEGLAB,
https://sccn.ucsd.edu/eeglab/) was then used to remove eye-blinks/movements (Delorme and
Makeig, 2004; Jung et al., 2000), with an average of 2 ICs (SE = 1) removed per subject, and
data were re-referenced to an average of all non-noisy channels.
Individual, 4-layer (scalp, skull, CSF, & brain) boundary element (BEM) head models were
constructed from the T1 anatomical image of each subject using the Fieldtrip toolbox
(http://www.ru.nl/neuroimaging/fieldtrip) (Oostenveld et al., 2011). A Linearly Constrained
Minimum Variance (LCMV) beamformer (Robinson and Vrba, 1999; van Drongelen et al.,
14 subject’s gamma (55–80Hz) and beta (15-30Hz) frequency oscillations (filtered using 2nd order Butterworth filters implemented in Matlab) in response to abduction movements. The optimal
frequency band for the localisation of gamma ERS was determined based on an iterative
process of initially investigating time-frequency spectrograms created from broad gamma band
(30-100Hz) source localisation and observing that consistently, across subjects, the peak
gamma ERS was found in the 55-80Hz, gamma band range, in agreement with many previous
findings (Ball et al., 2008; Cheyne et al., 2008; Muthukumaraswamy, 2010; for reviews,
Cheyne and Ferrari, 2013; Cheyne, 2013; Muthukumaraswamy, 2013). For each subject and
frequency band (beta or gamma), source power during the active (0s to 1.5s) and passive (-9.0s
to -7.5s) time windows, defined relative to the first cue onset, were calculated. The passive
window definition in the baseline interval, during the first MR-quiet period that preceded the
visual probe cue of that trial, was chosen to avoid both the periods of MR acquisition and any
brain activity occurring due to the visual cue. Subsequently, pseudo T-statistic (T-statistic)
maps were computed as the ratio of the difference in source power between the active and
passive windows, divided by the sum of the noise power estimates inherent to the sensors
during both active and passive windows (Hillebrand and Barnes, 2005; Robinson and Vrba,
1999).
The maximum peak statistic location of the gamma power ERS and minimum peak
Ŧ-statistic location of the beta power ERD in the contralateral primary motor cortex (cM1)
defined the site of a gamma and a beta virtual electrode (VE). A broadband (1-120Hz)
timecourse of neural activity was then extracted from these two VE locations, by multiplying
the channel level data by the respective broadband beamformer weights. Time-frequency
spectrograms of gamma and beta VE data were calculated using a multitaper wavelet approach
(Scheeringa et al., 2011). Windows of 0.4s duration were moved across the data in steps of
15 spectral smoothing of ±10Hz. Using the mean of the passive window data as baseline the
spectrograms were converted to display change in activity relative to baseline. Separately for
each subject, VE timecourses were filtered into the gamma and beta bands, Hilbert transformed
and then the average power during the active window was calculated for each trial (Mayhew
et al., 2010; Mullinger et al., 2014). These single trial power values were then mean-subtracted
to form regressors of gamma and beta power, which represented the trial-by-trial variability in
single-trial stimulus response amplitudes, for subsequent GLM analysis of fMRI data. The
amplitude of rejected trials was set to the mean value (zero). EEG data recorded outside the
scanner were analysed using equivalent methodology, to provide comparison of data quality
with the inside scanner recordings.
fMRI
fMRI data were processed using FSL v5.0.9 (https://fsl.fmrib.ox.ac.uk/fsl/). Data from each
subject were corrected for physiological noise using a RETROICOR approach (Glover et al.,
1999) implemented using in-house Matlab code, motion corrected (MCFLIRT), spatially
smoothed (5mm FWHM Gaussian kernel), high-pass temporally filtered (100s cutoff),
registered to their T1 anatomical brain image (FLIRT), and normalised to the MNI 2mm
standard brain. GLM analyses were performed using FEAT v6.0. First-level analysis was
performed employing four regressors: 1) boxcar abduction movement, 2) boxcar visual probe
cue, 3&4) parametric modulation of single-trial gamma and beta neuronal responses,
respectively. All regressors were convolved with the double-gamma HRF. Both positive and
negative contrasts were assessed for each regressor. For each subject and frequency band,
first-level results were combined across all four runs using a second-first-level, fixed effects analysis to
16 at the third, group-level using a FLAME mixed-effects analysis (Woolrich et al., 2004). Since
our a-priori hypothesis was to investigate motor fMRI responses and their correlation with
gamma and beta EEG activity, a mask of motor cortex (Oxford–Harvard cortical atlas, FSL)
was applied as pre-threshold mask to all group-level statistical maps before cluster correction.
Main effect (boxcar model of the task) and the single trial EEG regressor correlation BOLD
Z-statistic images were threshold using Z > 2.3 and cluster corrected significance threshold of p
< 0.05.
Results
Stage 1: Feasibility testing
Safety testing
The temperature changes measured at all thermometer sensors during the GE-EPI sequence are
plotted in Figure 2. The greatest heating was observed in the ECG channel, which showed a
~0.5°C increase. This temperature increase occurred gradually over the first 10 minutes and
then stabilised and showed no further change. Nominal heating was observed in the other
channels. The higher SAR of the PCASL sequence resulted in a greater heating effect than the
GE-EPI, again the largest temperature increase was seen in the ECG channel (~0.9°C) with
increases in other channels (TP8 = ~0.8°C) also observed (Figure S1). As this GE-EPI
sequence, with parameters chosen to maximise SAR, showed no heating effect close to 1°C,
the use of the MB GE-EPI (with parameters resulting in lower SAR) with the EEG system was
regarded safe for the following experiments (Carmichael et al., 2008; Medicines and
17 Image quality: tSNR
The variation in BOLD tSNR with MB factor = 1-3 and slice spacing acquisition is summarised
in Table 1. These data indicate that the variability in tSNR between subjects was far larger than
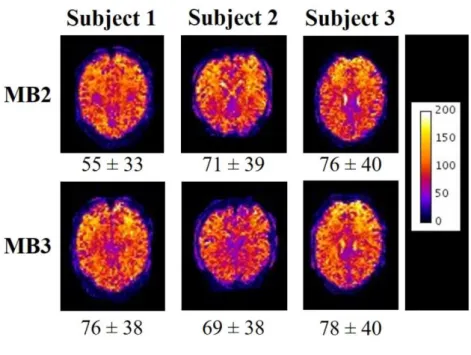
the variability of tSNR with imaging parameters. Figure 3 shows the spatial variation in tSNR
over a single slice for each subject for the two sparse imaging acquisition sequences tested,
which were the most promising sequences for our EEG-fMRI application. Visual inspection of
the images in Figure 3 and direct comparison of the mean and standard deviation of tSNR
within subjects shows no clear change in tSNR (12.6 ± 22% between MB factor 2 to 3) between
MB factors. Since, for sparse sequences, using a MB factor of 3 compared with 2 results in a
33% reduction in the time required to acquire the same number of slices the MB factor of 3
was chosen for the EEG-fMRI experiment, to maximise the duration of the MR quiet-period
for EEG measurements without degradation of the tSNR.
Study 2: EEG-fMRI motor study
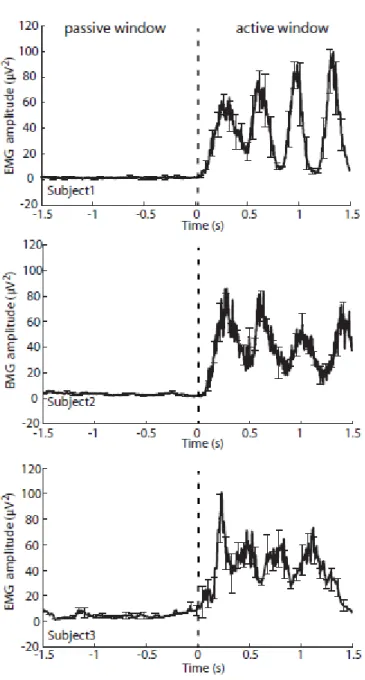
All subjects performed the abduction task as instructed, judged by visual inspection of the EMG
data showing increases in power during brisk finger movements which accurately timed to the
auditory cues, and EMG power returning to rest levels during the baseline periods showing
subjects remained still in these periods. Mean rectified EMG activity during the passive and
active periods is shown for a representative subject in Figure 4.
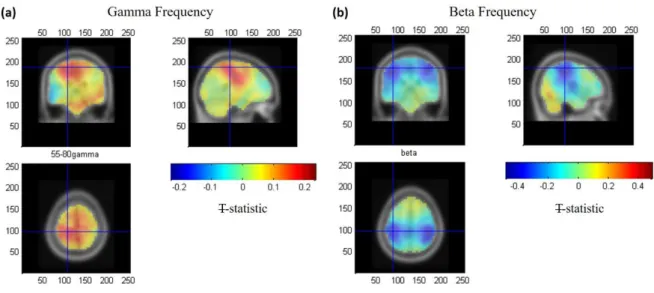
Figure 5 shows the group average T-statistic map of changes in both EEG gamma- and
beta-power during the active window compared to the passive window. An increase in gamma
power (ERS, positive T values, Fig. 5a) was only observed in contralateral M1, whereas a
decrease in beta power (ERD, negative T values, Fig. 5b) was observed in bilaterally in
18 in cM1 for the gamma ERS was found at: [-21±3, -31±3, 59±3] mm [MNI:x,y,z] (see Fig 5a,
crosshair) and the beta ERD was found at [-39±3, -32±2, 51±4] mm (see Fig 5b, crosshair),
where errors denote standard error over subjects. Both these locations lie in the post-central
gyrus, the gamma VE location was found to be significantly more medial (t(9) = 3.76, p=0.004
paired t-test) than the beta VE location, but no difference in the y (t(9) = 0.41, p=0.69) or z
(t(9) = 1.32, p=0.21) co-ordinates was observed.
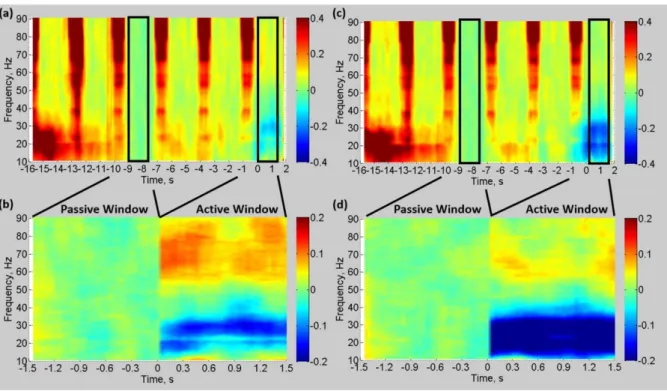
Figure 6 shows the group mean time-frequency spectrograms measured from cM1 for the
gamma (Fig 6a&b) and beta (Fig 6c&d) VE locations. Figures 6a&c display the mean
time-frequency spectrogram for the whole 18s duration of the abduction trial and preceding
inter-trial interval, with Figure 6b&d showing the active and passive periods only. The broadband
increases in power (red vertical stripes lasting ~750ms and occurring every 3s) show the effect
of the residual GAs caused by the MRI data acquisition on the EEG power spectrum. It is clear
that neuronal EEG responses above 20 Hz recorded during MRI data acquisition are corrupted
by residual GAs with signal degradation increasing with increasing frequency (Fig. 6a&c).
Note that, due to the way the trials were epoched, the increase in <30Hz power between -16s
and -14s represents the post-movement alpha/beta rebound. By selecting the active (0 to 1.5s)
and passive (-9 to -7.5s) time windows during MR quiet periods a reliable comparison of
neuronal signals between rest and task was made for both the gamma and beta bands (Fig.
6b&d). During the active window, when the FDI abduction movements were performed, ERS
of gamma band power (55-80Hz) and ERD of beta band power (15-30Hz) occurred compared
with the passive window of baseline resting fixation with no movement (Fig. 6b&d). As
expected due to the VE definition, stronger gamma power ERS was observed in the gamma
VE than the beta VE, and stronger beta power ERD was observed in the beta VE than in the
19 (Figure S2 & S3), show that very similar gamma and beta responses were measured in both
recordings, providing confidence in the quality of our data inside the scanner.
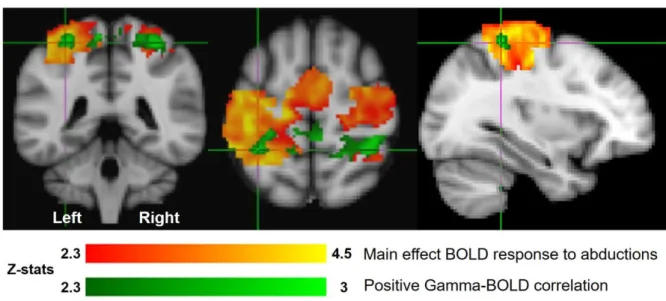
As expected across 10 subjects, we observed a significant main-effect (correlation with boxcar
regressor) positive BOLD response to the abduction movements in the motor cortex, with the
peak voxel (Z=5.12, p<1x10-19) lying within the masked region found at [-38, -32, 66] mm [MNI:x,y,z] in cM1, as shown in Figure 7, red-orange. With a second peak (Z=4.97, p<1x10 -19) found on the midline at [-4, -14, 70] mm [MNI:x,y,z]. In addition a positive correlation between single-trial gamma power ERS and the BOLD response was observed in cM1, with
the peak (Z=3.11, p<0.001) located at [-32, -42, 60] mm [MNI:x,y,z] (Fig 7, green) with
additional responses in the ipsilateral primary motor cortex with the peak (Z=3.02, p<0.01)
located at [34, -42, 60] mm [MNI:x,y,z] and on the midline with peak (Z=2.97, p<0.01) located
at [2, -36, 56] mm [MNI:x,y,z]. No significant negative correlations were observed with the
boxcar or gamma band regressors. No significant positive or negative correlations between
single-trial beta and BOLD responses were observed.
Discussion
Here, through a series of experiments we show that, with the right safety precautions and MRI
sequence choice, it is safe to simultaneously acquire EEG data with MB fMRI data, despite the
higher peak RF power required for MB acquisitions compared with conventional fMRI
acquisitions. We also show that, for the implementation of MB used here, there is no
measurable degradation of the fMRI signal tSNR when moving to a sparse acquisition with a
MB factor of 3 compared with the conventional continuous equi-spacing acquisition with no
MB factor, allowing for the presence of physiological noise. We finally show the considerable
20 gamma-BOLD coupling with a simple motor task. We were able to reliably detect the gamma
response to finger abductions within cM1 and found that this response was positively correlated
with the BOLD response in bilateral primary motor cortex with activation extending directly
posterior to the hand-knob area of the contralateral motor cortex.
Safety and signal quality considerations
We show that for a GE-EPI sequence using a MB factor of 4 resulting in a B1 RMS=1.09μT,
SAR/head=22% that the maximum heating observed over a 20 minute period was ~0.5 ̊C
(Figure 2) which is considerably less than the recommended 1 ̊C safety limit (Medicines and
Healthcare Products Regulatory Agency, 2015). Furthermore the majority of this 0.5 ̊C
temperature increase was observed within the first 5-6 minutes of scanning after which the
temperature remained relatively constant suggesting that there is not a linear heating effect over
time. Therefore even if data were continuously acquired for a longer period, which is
uncommon in neuroimaging studies, the risk to the subject is unlikely to increase greatly. A
similar pattern of heating was observed for the PCASL sequence where the greatest heating
occurred in the first few minutes before a plateau was reached (Figure S1). However, this
heating effect was far greater, up to ~0.9 ̊C over the electrodes and locations measured,
reflecting the increased B1 power used in that sequence (B1 RMS=1.58μT, SAR/head=46%).
As this temperature rise was only just within the safe limit for human tissue (Medicines and
Healthcare Products Regulatory Agency, 2015) and given that not all locations on the phantom
were monitored, we would strongly suggest sequences such as MB-PCASL should not be used
with concurrent EEG recordings. Although we didn’t record temperature data from occipital
electrodes due to practical limitations, we believe temperature increases at T7/T8 are likely to
21 both GE-EPI and PCASL scans was observed in the ECG lead. This lead is considerably longer
than the other leads in the EEG cap, which probably resulted in greater RF absorption in this
lead (Mullinger et al., 2008a) causing the larger heating effect observed here. Given the
potential to use the VCG system, supplied by the MRI manufacturer, to monitor the cardiac
cycle (Mullinger et al., 2008b) it would be possible to reduce the risk of heating effects by
removing the ECG lead and electrode from the EEG setup. However, given the increase in
temperature (~0.8 ̊C) in the Tp8 electrode, which also has a relatively long lead, the removal
of the ECG lead alone is unlikely to ensure that high SAR sequences can be run safely with
EEG system present. These findings are in general agreement with recent work that also
considered safety implication of MB (Foged et al., 2017). It is also important to note that
minimal heating effects were observed at the MRI scanner bore location suggesting that the
MR scanning was not increasing the ambient temperature of the bore. Therefore the observed
electrode heating specifically arose from the interaction between the EEG system and the RF
slice excitation pulses. These data highlight the potential dangers of using MB sequences for
EEG-fMRI where high SAR values can arise from the increased B1 (Collins and Wang, 2011)
and the need for specific safety testing of any sequences used. Since there are choices in how
the RF pulses required for MB sequences can be implemented, with varying effects on SAR
(Feinberg and Setsompop, 2013; Norris et al., 2011; Wong, 2012), it is important that MB
implementations by different MR manufactures and software providers are individually tested
before being used in human experiments.
It is known that the use of MB can reduce image quality and consequently degrade the temporal
stability of the signals acquired using EPI based sequences (Chen et al., 2015; Todd et al.,
2016). However, due to the ability of MB to shorten the TR, the increased temporal sampling
22 activation maps (Todd et al., 2016). MB fMRI has been shown to be useful in a number of
different applications since its conception only a few years ago, with the relative gains in
sampling rate and voxel size that it can provide offsetting any signal quality degradation
incurred (Boyacioğlu et al., 2015; Feinberg et al., 2010; Moeller et al., 2010; Olafsson et al.,
2015). Indeed, our own investigations showed that the variation in tSNR over subjects was far
greater than the variation in tSNR between the sequences tested with different MB factors and
slice acquisition schemes (Table 1). This suggests that the tSNR measures were dominated by
physiological noise and anatomical variability rather than imaging sequence differences. Even
when changes in tSNR within subjects between MB 2 and 3 were considered there no clear
reduction was seen with increasing MB factor (Figure 3) in these data. By using MB factor =
3 with sparse slice acquisition we were able to maintain whole-head coverage whilst obtaining
a 2.25s MR quiet period, within our 3s TR, in which to study EEG-BOLD coupling. Therefore
the relative gain in quiet period time far outweighed effects on tSNR which were encountered.
Benefits of MB fMRI for the simultaneous recording of high frequency EEG signals
The presence of residual GAs in EEG data at frequencies above 20 Hz shows the necessity of
an MR quiet period to provide the best SNR for studying beta and gamma band signals. These
residual artefacts are present despite strict adherence to best-current practice acquisition and
the implementation of hardware solutions (synchronisation (Mandelkow et al., 2006; Mullinger
et al., 2008) and optimal positioning (Mullinger et al., 2011)) and beamforming post-processing
(Brookes et al., 2009, 2008) which are all designed to minimise the residual GAs. Whilst the
magnitude of the residual GA appears to increase with frequency (Figure 6), it is actually
relatively constant across the frequency bands above 20 Hz (Figure S4c&d), but the relative
23 the underlying neuronal activity at higher frequencies resulting in Figure S4e&f. These residual
artefacts are likely to be caused by sub-millimetre movements of the subject’s head during data
acquisition causing small changes in the GA profile, preventing perfect correction by template
subtraction methods (Ritter et al., 2007; Yan et al., 2009). Given that such small head
movements cannot be eliminated during acquisition and the current lack of a post-processing
method to completely remove residual GAs from the EEG data, despite considerable effort by
a number of groups (Brookes et al., 2008; Freyer et al., 2009; Maziero et al., 2016; Moosmann
et al., 2009), the merit of an MR quiet period, that enables the study of higher frequency
neuronal activity unadulterated by concurrent fMRI acquisition, is clear.
Indeed, using a sparse MR sequence incorporating quiet periods has previously been
implemented to allow the study of gamma band activity during fMRI (Leicht et al., 2016;
Mulert et al., 2010; Scheeringa et al., 2011). We have extended these previous works by
showing that beta and gamma band activity from motor cortex can be measured in the MRI
environment. We observed an ERS of gamma band power during the abduction movements
compared with rest (Figs 5a and 6a&b) localised to cM1, in close agreement with previous
MEG studies (Ball et al., 2008; Cheyne, 2013; Darvas et al., 2010; Muthukumaraswamy,
2010). This gamma band response was accompanied by a decrease (ERD) in beta band power
(Figs 5b and 6c&d) which was observed in bilateral M1, in agreement with previous studies
collected outside an MRI environment (Darvas et al., 2013; Jurkiewicz et al., 2006;
Muthukumaraswamy et al., 2010). Interestingly, previous invasive and non-invasive
electrophysiological recordings have shown that the gamma ERS is more spatially focal to cM1
than the beta ERD (Darvas et al., 2013; Miller et al., 2007), which was also observed in our
data. In addition to the difference in the spatial localisation of the gamma/beta responses, we
24 The gamma ERS covered a relatively large frequency range (~50-80Hz) and, whilst it could be
seen for the entire movement period, it was strongest at initial movement onset (i.e. 0-0.5s Fig
6a). The beta ERD was found to be much stronger and was present consistently throughout the
entire movement period. Together these differences in spatial location and temporal response
profile suggest different neuronal populations are driving these two responses, in line with
previous findings (Darvas et al., 2010; Miller et al., 2007).
Given the considerable advantages of MRI for providing excellent spatial resolution of brain
activity (De Martino et al., 2015; Heidemann et al., 2012) it is highly desirable to take
advantage of this feature in the investigation of the origin of electrophysiological responses,
where non-invasive EEG/MEG recordings are limited. However, previous studies (Leicht et
al., 2016; Mulert et al., 2010; Scheeringa et al., 2011) have required considerable compromise
on spatial resolution (slice thickness ranging from 4-8mm with slice gaps of 0.4-1mm) and/or
brain coverage (between 35 and 120mm) to provide a sufficient quiet period to TR ratio
(ranging between 30-90% of time) and sampling rate of MRI responses (TRs between 3 and
3.63s). With the current implementation of MB we have shown that these trade-offs can be
minimised such that 3 mm isotropic voxels, with no slice gap and 99 mm brain coverage with
a quiet period to TR ratio of 75%, can be achieved with a TR of 3s.
BOLD responses and coupling to EEG responses and future research possibilities
Exploiting the advantages of EEG-MB fMRI has allowed us to show the potential of this
technique for non-invasively investigating brain function. We found that, out of all our
regressors, the boxcar model of the finger abductions showed the strongest correlation with the
25 [-38, -32, 66] mm, and supplementary motor area [-4, -14, 70] mm as well as bilateral S2. All
of which are regions expected to be activated in a simple sensorimotor task. Interestingly the
regions of gamma-BOLD correlation were smaller and more focal, with peak activity being
observed between the postcentral gyrus and superior parietal lobule both in contralateral
[-32,-42, 60] mm, ipsilateral [34, -[-32,-42, 60] mm regions, and a central peak found between precentral
and postcentral gyrus at [2, -36, 56] mm. The contralateral activation extends to directly
posterior to the hand-knob area of the left sensorimotor cortex, further suggesting this was a
localised, task specific response. The bilaterality of this correlation, given the gamma ERS was
lateralised to the left cM1, appears surprising, but falls consistently within the bilateral
somatosensory cortex and therefore is likely to arise due to the mutual correlation of BOLD
signals between the contralateral and ipsilateral regions of the somatosensory network for this
task.
It is unsurprising given the robust task employed that the BOLD response was well
characterised by a simple boxcar model and that this showed the strongest activations in the
motor network. However, single-trial variability in BOLD and gamma ERS response
amplitudes were well coupled in the somatosensory network. This finding supports previous
work showing a tight coupling of natural variability in BOLD and gamma responses in the
visual system (Logothetis, 2003; Scheeringa et al., 2011) and extends these findings into the
sensorimotor modality. It is likely that the BOLD-gamma coupling was most evident in the
sensory network where the variability to the task was the greatest and therefore least explained
by the boxcar constant main effect. We hypothesize that a greater amount of response
variability was elicited in the somatosensory network than the motor cortex as the subject’s
abduction movements showed such a high level of consistency in both timing and amplitude
(Fig 4), reflecting similar motor output. However, it is possible that the sensation of finger
26 surfaces were touched with the finger when subjects’ arms were slightly cramped for space
inside the scanner. Whilst this cannot be proven with these data, it provides a basis for further
investigation.
The lack of significant correlation between the beta ERD and BOLD responses appears a
surprising result given previous reports of negative beta-BOLD correlations (Ritter et al., 2009)
and the clear beta band responses which we observed (Fig 5b). However, here we considered
the variability in the EEG response which explained variance in the BOLD data in addition to
that explained by a constant amplitude boxcar model. Further inspection of our data with a
fixed effects cluster corrected Z>2.0 group analysis showed that beta-BOLD correlations were
observed in central and ipsilateral motor cortex, but these did not survive mixed effects Z>2.3.
Therefore it seems that the effect size was too weak for the beta correlation to arise in our data
sample. Beta ERD is widely observed during preparation and execution of movements (Engel
and Fries, 2010; Ritter et al., 2009; Zaepffel et al., 2013), however there is a sparsity of
evidence directly linking parameters of the beta ERD amplitude to the quality of motor
performance, leaving much still to be understood concerning beta oscillations precise
functional role (Engel and Fries, 2010; Kilavik et al., 2013; Pogosyan et al., 2009). Given the
beta ERD has been considered to be a simple gating mechanism (Fry et al., 2016; Stevenson et
al., 2011) required to allow neuronal activity involved in task execution to take place in other,
typically higher, frequency bands it is conceivable that the amplitude variability of the ERD is
less related to the task performance and reflects more of a binarised signal to permit the
27 In conclusion we show that EEG can be safely acquired concurrently with GE-EPI MB-fMRI
data and allows the investigation of neuronal and hemodynamic task responses with high
spatial, temporal and spectral resolution. We use a simple motor task in this work to show that
tight gamma-BOLD coupling is observed on an individual trial basis, agreeing with previous
invasive recordings in both animal and human visual/auditory cortex. In the future such
methodologies that allow detailed integration of a wide frequency range of neural signals may
be used to build a more complete understanding of pathways of feedforward and feedback
neural communication and of how such signals contribute to neurovascular coupling
mechanisms and the generation of the hemodynamic response.
Acknowledgements
We thank the Birmingham Nottingham Strategic Collaboration Fund for supporting this work
and MU and a University of Nottingham Anne McLaren Fellowship for funding KJM and a
University of Birmingham Fellowship for funding SDM.
References
Auerbach, E.J., Xu, J., Yacoub, E., Moeller, S., Ugurbil, K., 2013. Multiband accelerated
spin-echo echo planar imaging with reduced peak RF power using time-shifted RF
pulses. Magn Reson Med 69, 1261–1267. doi:10.1002/mrm.24719
Bagshaw, A.P., Aghakhani, Y., Bénar, C.G., Kobayashi, E., Hawco, C., Dubeau, F., Pike,
G.B., Gotman, J., 2004. EEG-fMRI of focal epileptic spikes: Analysis with multiple
haemodynamic functions and comparison with gadolinium-enhanced MR angiograms.
28 Ball, T., Demandt, E., Mutschler, I., Neitzel, E., Mehring, C., Vogt, K., Aertsen, A.,
Schulze-Bonhage, A., 2008. Movement related activity in the high gamma range of the human
EEG. Neuroimage 41, 302–310. doi:10.1016/j.neuroimage.2008.02.032
Bauer, M., Oostenveld, R., Peeters, M., Fries, P., 2006. Tactile spatial attention enhances
gamma-band activity in somatosensory cortex and reduces low-frequency activity in
parieto-occipital areas. J Neurosci 26, 490–501.
doi:10.1523/JNEUROSCI.5228-04.2006
Becker, R., Reinacher, M., Freyer, F., Villringer, A., Ritter, P., 2011. How Ongoing Neuronal
Oscillations Account for Evoked fMRI Variability. J. Neurosci. 31, 11016–11027.
doi:10.1523/jneurosci.0210-11.2011
Bénar, C.G., Schön, D., Grimault, S., Nazarian, B., Burle, B., Roth, M., Badier, J.M.,
Marquis, P., Liegeois-Chauvel, C., Anton, J.L., 2007. Single-trial analysis of oddball
event-related potentials in simultaneous EEG-fMRI. Hum. Brain Mapp. 28, 602–613.
doi:10.1002/hbm.20289
Boorman, L., Harris, S., Bruyns-Haylett, M., Kennerley, A., Zheng, Y., Martin, C., Jones, M.,
Redgrave, P., Berwick, J., 2015. Long-Latency Reductions in Gamma Power Predict
Hemodynamic Changes That Underlie the Negative BOLD Signal. J. Neurosci. 35,
4641–4656. doi:10.1523/JNEUROSCI.2339-14.2015
Boyacioğlu, R., Schulz, J., Koopmans, P.J., Barth, M., Norris, D.G., 2015. Improved
sensitivity and specificity for resting state and task fMRI with multiband multi-echo EPI
compared to multi-echo EPI at 7T. Neuroimage 119, 352–361.
doi:10.1016/j.neuroimage.2015.06.089
Brookes, M.J., Mullinger, K.J., Stevenson, C.M., Morris, P.G., Bowtell, R., 2008.
29 means of spatial filtering. Neuroimage 40, 1090–1104.
doi:10.1016/j.neuroimage.2007.12.030
Brookes, M.J., Vrba, J., Mullinger, K.J., Geirsdottir, G.B., Yan, W.X., Stevenson, C.M.,
Bowtell, R., Morris, P.G., 2009. Source localisation in concurrent EEG/fMRI:
applications at 7T. Neuroimage 45, 440–452. doi:S1053-8119(08)01160-9 [pii]
10.1016/j.neuroimage.2008.10.047
Brown, P., Salenius, S., Rothwell, J.C., Hari, R., 1998. Cortical correlate of the piper rhythm
in humans. J. Neurophysiol. 80, 2911–2917.
Buschman, T.J., Miller, E.K., 2007. Top-down versus bottom-up control of attention in the
prefrontal and posterior parietal cortices. Science 315, 1860–1862.
doi:10.1126/science.1138071
Buzsaki, G., Draguhn, A., 2004. Neuronal Oscillations in Cortical Networks. Science (80-. ).
304, 1926–1929. doi:10.1126/science.1099745
Carmichael, D.W., Thornton, J.S., Rodionov, R., Thornton, R., McEvoy, A., Allen, P.J.,
Lemieux, L., 2008. Safety of localizing epilepsy monitoring intracranial
electroencephalograph electrodes using MRI: Radiofrequency-induced heating. J. Magn.
Reson. Imaging 28, 1233–1244. doi:10.1002/jmri.21583
Castelhano, J., Duarte, I.C., Wibral, M., Rodriguez, E., Castelo-Branco, M., 2014. The dual
facet of gamma oscillations: Separate visual and decision making circuits as revealed by
simultaneous EEG/fMRI. Hum. Brain Mapp. 35, 5219–5235. doi:10.1002/hbm.22545
Chen, L., Vu, A.T., Xu, J., Moeller, S., Ugurbil, K., Yacoub, E., Feinberg, D.A., 2015.
Evaluation of highly accelerated simultaneous multi-slice EPI for fMRI. Neuroimage
30 Cheyne, D., Bells, S., Ferrari, P., Gaetz, W., Bostan, A.C., 2008. Self-paced movements
induce high-frequency gamma oscillations in primary motor cortex. Neuroimage 42,
332–342. doi:10.1016/j.neuroimage.2008.04.178
Cheyne, D., Ferrari, P., 2013. MEG studies of motor cortex gamma oscillations: evidence for
a gamma “fingerprint” in the brain? Front. Hum. Neurosci. 7, 1–7.
doi:10.3389/fnhum.2013.00575
Cheyne, D.O., 2013. MEG studies of sensorimotor rhythms: A review. Exp. Neurol.
doi:10.1016/j.expneurol.2012.08.030
Colgin, L.L., Denninger, T., Fyhn, M., Hafting, T., Bonnevie, T., Jensen, O., Moser, M.-B.,
Moser, E.I., 2009. Frequency of gamma oscillations routes flow of information in the
hippocampus. Nature 462, 353–357. doi:10.1038/nature08573
Collins, C.M., Wang, Z., 2011. Calculation of radiofrequency electromagnetic fields and their
effects in MRI of human subjects. Magn. Reson. Med. 65, 1470–1482.
doi:10.1002/mrm.22845
Crone, N.E., Miglioretti, D.L., Gordon, B., Lesser, R.P., 1998. Functional mapping of human
sensorimotor cortex with electrocorticographic spectral analysis II. Event-related
synchronization in the gamma band. Brain 121, 2301–2315.
doi:10.1093/brain/121.12.2301
Darvas, F., Rao, R.P.N., Murias, M., 2013. Localized high gamma motor oscillations respond
to perceived biologic motion. J. Clin. Neurophysiol. 30, 299–307.
doi:10.1097/WNP.0b013e3182872f40
Darvas, F., Scherer, R., Ojemann, J.G., Rao, R.P., Miller, K.J., Sorensen, L.B., 2010. High
31 doi:10.1016/j.neuroimage.2009.08.041
De Martino, F., Moerel, M., Xu, J., Van De Moortele, P.F., Ugurbil, K., Goebel, R., Yacoub,
E., Formisano, E., 2015. High-resolution mapping of myeloarchitecture in vivo:
Localization of auditory areas in the human brain. Cereb. Cortex 25, 3394–3405.
doi:10.1093/cercor/bhu150
Debener, S., Ullsperger, M., Siegel, M., Engel, A.K., 2006. Single-trial EEG-fMRI reveals
the dynamics of cognitive function. Trends Cogn. Sci. 10, 558–563.
doi:10.1016/j.tics.2006.09.010
Debener, S., Ullsperger, M., Siegel, M., Fiehler, K., von Cramon, D.Y., Engel, A.K., 2005.
Trial-by-trial coupling of concurrent electroencephalogram and functional magnetic
resonance imaging identifies the dynamics of performance monitoring. J Neurosci 25,
11730–11737. doi:10.1523/JNEUROSCI.3286-05.2005
Delorme, A., Makeig, S., 2004. EEGLAB: an open source toolbox for analysis of single-trial
EEG dynamics including independent component analysis. J Neurosci Methods 134, 9–
21. doi:10.1016/j.jneumeth.2003.10.009 S0165027003003479 [pii]
Eichele, T., Calhoun, V.D., Moosmann, M., Specht, K., Jongsma, M.L.A., Quiroga, R.Q.,
Nordby, H., Hugdahl, K., 2008. Unmixing concurrent EEG-fMRI with parallel
independent component analysis. Int. J. Psychophysiol. 67, 222–234.
doi:10.1016/j.ijpsycho.2007.04.010
Eichele, T., Specht, K., Moosmann, M., Jongsma, M.L.A., Quiroga, R.Q., Nordby, H.,
Hugdahl, K., 2005. Assessing the spatiotemporal evolution of neuronal activation with
single-trial event-related potentials and functional MRI. Proc Natl Acad Sci U S A 102,
32 Engel, A.K., Fries, P., 2010. Beta-band oscillations-signalling the status quo? Curr. Opin.
Neurobiol. doi:10.1016/j.conb.2010.02.015
Feinberg, D.A., Moeller, S., Smith, S.M., Auerbach, E., Ramanna, S., Gunther, M., Glasser,
M.F., Miller, K.L., Ugurbil, K., Yacoub, E., 2010. Multiplexed echo planar imaging for
sub-second whole brain FMRI and fast diffusion imaging. PLoS One 5, e15710.
doi:10.1371/journal.pone.0015710
Feinberg, D.A., Setsompop, K., 2013. Ultra-fast MRI of the human brain with simultaneous
multi-slice imaging. J. Magn. Reson. doi:10.1016/j.jmr.2013.02.002
Fell, J., Klaver, P., Lehnertz, K., Grunwald, T., Schaller, C., Elger, C.E., Fernandez, G.,
2001. Human memory formation is accompanied by rhinal-hippocampal coupling and
decoupling. Nat. Neurosci. 4, 1259–1264. doi:10.1038/nn759
Foged, M.T., Lindberg, U., Vakamudi, K., Larsson, H.B.W., Pinborg, L.H., Kjñr, T.W.,
Fabricius, M., Svarer, C., Ozenne, B., Thomsen, C., Beniczky, S., Paulson, O.B., Posse,
S., 2017. Safety and EEG data quality of concurrent high-density EEG and high-speed
fMRI at 3 Tesla. PLoS One 12. doi:10.1371/journal.pone.0178409
Freyer, F., Becker, R., Anami, K., Curio, G., Villringer, A., Ritter, P., 2009.
Ultrahigh-frequency EEG during fMRI: Pushing the limits of imaging-artifact correction.
Neuroimage 48, 94–108. doi:10.1016/j.neuroimage.2009.06.022
Fries, P., 2009. Neuronal gamma-band synchronization as a fundamental process in cortical
computation. Annu Rev Neurosci 32, 209–224.
doi:10.1146/annurev.neuro.051508.135603
Fry, A., Mullinger, K.J., O’Neill, G.C., Barratt, E.L., Morris, P.G., Bauer, M., Folland, J.P.,
33 and rate of force development. Hum. Brain Mapp. 37, 2493–2511.
doi:10.1002/hbm.23189
Gaetz, W., MacDonald, M., Cheyne, D., Snead, O.C., 2010. Neuromagnetic imaging of
movement-related cortical oscillations in children and adults: Age predicts
post-movement beta rebound. Neuroimage 51, 792–807.
doi:10.1016/j.neuroimage.2010.01.077
Glover, G.H., Li, T.Q., Ress, D., 1999. Image-based method for retrospective correction of
physiological motion effects in fMRI: RETROICOR. Magn Res Med 44 (1) 162-167.
doi:10.1002/mrm.1522-2594(200007)44
Goldman, R.I., Stern, J.M., Engel Jerome, J., Cohen, M.S., 2002. Simultaneous EEG and
fMRI of the alpha rhythm. Neuroreport 13, 2487–2492.
doi:10.1097/01.wnr.0000047685.08940.d0
Goldman, R.I., Wei, C.Y., Philiastides, M.G., Gerson, A.D., Friedman, D., Brown, T.R.,
Sajda, P., 2009. Single-trial discrimination for integrating simultaneous EEG and fMRI:
identifying cortical areas contributing to trial-to-trial variability in the auditory oddball
task. Neuroimage 47, 136–147. doi:10.1016/j.neuroimage.2009.03.062
Green, J.J., Boehler, C.N., Roberts, K.C., Chen, L.-C., Krebs, R.M., Song, A.W., Woldorff,
M.G., 2017. Cortical and Subcortical Coordination of Visual Spatial Attention Revealed
by Simultaneous EEG–fMRI Recording. J. Neurosci. 37, 7803–7810.
doi:10.1523/JNEUROSCI.0326-17.2017
Hall, S.D., Holliday, I.E., Hillebrand, A., Singh, K.D., Furlong, P.L., Hadjipapas, A., Barnes,
G.R., 2005. The missing link: Analogous human and primate cortical gamma
34 Heidemann, R.M., Ivanov, D., Trampel, R., Fasano, F., Meyer, H., Pfeuffer, J., Turner, R.,
2012. Isotropic submillimeter fMRI in the human brain at 7 T: combining reduced
field-of-view imaging and partially parallel acquisitions. Magn Reson Med 68, 1506–1516.
doi:10.1002/mrm.24156
Hermes, D., Miller, K.J., Wandell, B. a, Winawer, J., 2014. Stimulus Dependence of Gamma
Oscillations in Human Visual Cortex. Cereb. Cortex 1–9. doi:10.1093/cercor/bhu091
Hillebrand, A., Barnes, G.R., 2005. Beamformer Analysis of MEG Data. Int. Rev. Neurobiol.
doi:10.1016/S0074-7742(05)68006-3
Hoogenboom, N., Schoffelen, J.M., Oostenveld, R., Fries, P., 2010. Visually induced
gamma-band activity predicts speed of change detection in humans. Neuroimage 51,
1162–1167. doi:10.1016/j.neuroimage.2010.03.041
Hoogenboom, N., Schoffelen, J.M., Oostenveld, R., Parkes, L.M., Fries, P., 2006. Localizing
human visual gamma-band activity in frequency, time and space. Neuroimage 29, 764–
773. doi:10.1016/j.neuroimage.2005.08.043
Horovitz, S.G., Fukunaga, M., De Zwart, J.A., Van Gelderen, P., Fulton, S.C., Balkin, T.J.,
Duyn, J.H., 2008. Low frequency BOLD fluctuations during resting wakefulness and
light sleep: A simultaneous EEG-fMRI study. Hum. Brain Mapp. 29, 671–682.
doi:10.1002/hbm.20428
Howard, M.W., Rizzuto, D.S., Caplan, J.B., Madsen, J.R., Lisman, J.,
Aschenbrenner-Scheibe, R., Schulze-Bonhage, A., Kahana, M.J., 2003. Gamma Oscillations Correlate
with Working Memory Load in Humans. Cereb. Cortex 13, 1369–1374.
doi:10.1093/cercor/bhg084
EEG-35 fMRI: an introductory review. J Neurosci 32, 6053–6060.
doi:10.1523/JNEUROSCI.0447-12.2012
Jung, T.P., Makeig, S., Westerfield, M., Townsend, J., Courchesne, E., Sejnowski, T.J., 2000.
Removal of eye activity artifacts from visual event-related potentials in normal and
clinical subjects. Clin Neurophysiol 111, 1745–1758. doi:S1388-2457(00)00386-2 [pii]
Jurkiewicz, M.T., Gaetz, W., Bostan, A.C., Cheyne, D., 2006. Post-movement beta rebound
is generated in motor cortex: Evidence from neuromagnetic recordings. Neuroimage 32,
1281–1289.
Kilavik, B.E., Zaepffel, M., Brovelli, A., MacKay, W.A., Riehle, A., 2013. The ups and
downs of beta oscillations in sensorimotor cortex. Exp. Neurol.
doi:10.1016/j.expneurol.2012.09.014
Laufs, H., Kleinschmidt, A., Beyerle, A., Eger, E., Salek-Haddadi, A., Preibisch, C., Krakow,
K., 2003. EEG-correlated fMRI of human alpha activity. Neuroimage 19, 1463–1476.
Leicht, G., Vauth, S., Polomac, N., Andreou, C., Rauh, J., Mu??mann, M., Karow, A.,
Mulert, C., 2016. EEG-Informed fMRI Reveals a Disturbed Gamma-Band-Specific
Network in Subjects at High Risk for Psychosis. Schizophr. Bull. 42, 239–249.
doi:10.1093/schbul/sbv092
Logothetis, N.K., 2008. What we can do and what we cannot do with fMRI. Nature 453,
869–878. doi:10.1038/nature06976
Logothetis, N.K., 2003. The underpinnings of the BOLD functional magnetic resonance
imaging signal. J Neurosci 23, 3963–3971.
Logothetis, N.K., Pauls, J., Augath, M., Trinath, T., Oeltermann, A., 2001.
36 doi:10.1038/35084005
Magri, C., Schridde, U., Murayama, Y., Panzeri, S., Logothetis, N.K., 2012. The amplitude
and timing of the BOLD signal reflects the relationship between local field potential
power at different frequencies. J Neurosci 32, 1395–1407. doi:32/4/1395 [pii]
10.1523/JNEUROSCI.3985-11.2012
Mandelkow, H., Halder, P., Boesiger, P., Brandeis, D., 2006. Synchronization facilitates
removal of MRI artefacts from concurrent EEG recordings and increases usable
bandwidth. Neuroimage 32, 1120–1126. doi:10.1016/j.neuroimage.2006.04.231
Mantini, D., Perrucci, M.G., Del Gratta, C., Romani, G.L., Corbetta, M., 2007.
Electrophysiological signatures of resting state networks in the human brain. Proc Natl
Acad Sci U S A 104, 13170–13175. doi:10.1073/pnas.0700668104
Mayhew, S.D., Dirckx, S.G., Niazy, R.K., Iannetti, G.D., Wise, R.G., 2010. EEG signatures
of auditory activity correlate with simultaneously recorded fMRI responses in humans.
Neuroimage 49, 849–864. doi:10.1016/j.neuroimage.2009.06.080
Mayhew, S.D., Li, S., Kourtzi, Z., 2012. Learning acts on distinct processes for visual form
perception in the human brain. J. Neurosci. 32, 775–86.
doi:10.1523/JNEUROSCI.2033-11.2012
Mayhew, S.D., Ostwald, D., Porcaro, C., Bagshaw, A.P., 2013. Spontaneous EEG alpha
oscillation interacts with positive and negative BOLD responses in the visual-auditory
cortices and default-mode network. Neuroimage 76, 362–372.
doi:10.1016/j.neuroimage.2013.02.070
Maziero, D., Velasco, T.R., Hunt, N., Payne, E., Lemieux, L., Salmon, C.E.G., Carmichael,
37 voltages and gradient artefact instability in EEG using an fMRI prospective motion
correction (PMC) system. Neuroimage 138, 13–27.
doi:10.1016/j.neuroimage.2016.05.003
Medicines and Healthcare Products Regulatory Agency, 2015. Safety Guidelines for
Magnetic Resonance Imaging Equipment in Clinical Use.
Michels, L., Bucher, K., Lüchinger, R., Klaver, P., Martin, E., Jeanmonod, D., Brandeis, D.,
2010. Simultaneous EEG-fMRI during a working memory task: Modulations in low and
high frequency bands. PLoS One 5, 1–15. doi:10.1371/journal.pone.0010298
Miller, K.J., Leuthardt, E.C., Schalk, G., Rao, R.P.N., Anderson, N.R., Moran, D.W., Miller,
J.W., Ojemann, J.G., 2007. Spectral Changes in Cortical Surface Potentials during
Motor Movement. J. Neurosci. 27, 2424–2432. doi:10.1523/JNEUROSCI.3886-06.2007
Mobascher, A., Brinkmeyer, J., Warbrick, T., Musso, F., Wittsack, H.J., Saleh, A., Schnitzler,
A., Winterer, G., 2009. Laser-evoked potential P2 single-trial amplitudes covary with
the fMRI BOLD response in the medial pain system and interconnected subcortical
structures. Neuroimage 45, 917–926. doi:10.1016/j.neuroimage.2008.12.051
Moeller, S., Yacoub, E., Olman, C.A., Auerbach, E., Strupp, J., Harel, N., Ugurbil, K., 2010.
Multiband multislice GE-EPI at 7 tesla, with 16-fold acceleration using partial parallel
imaging with application to high spatial and temporal whole-brain fMRI. Magn Reson
Med 63, 1144–1153. doi:10.1002/mrm.22361
Moosmann, M., Schönfelder, V.H., Specht, K., Scheeringa, R., Nordby, H., Hugdahl, K.,
2009. Realignment parameter-informed artefact correction for simultaneous EEG-fMRI
recordings. Neuroimage 45, 1144–1150. doi:10.1016/j.neuroimage.2009.01.024