Original Article
Development and optimization of a
RP-HPLC method to quantify midazolam
in rat plasma after transdermal administration:
validation and application in pharmacokinetic study
Jinfeng Ding1, Lingyang Chen1, Donghang Cao1, Xiaodan Wang1, Mingcang Wang1, Yingnian Lu2
1Department of Anesthesiology, Taizhou Hospital of Zhejiang Province, 31700 Linhai, Zhejiang, P. R. China; 2Guangdong Key Laboratory for Research and Development of Natural Drugs, Guangdong Medical College, 524023 Zhanjiang, P. R. China
Received January 12, 2016; Accepted March 27, 2016; Epub June 15, 2016; Published June 30, 2016
Abstract: A reversed phase high performance liquid chromatographic assay coupled with UV detection (239 nm) has been developed and validated for the determination of midazolam in rat plasma samples after transdermal ad-ministration. A liquid-liquid extraction was used to extract the compound from plasma sample. The separation was performed on a Hypersil ODS C18 column using a mobile phase composed of acetonitrile and 0.1% triethylamine
aqueous solution (52:48, V/V), pumped at a flow rate 1.0 mL min-1. The calibration curves showed good
linear-ity with correlation coefficient higher than 0.998 for all analytes in the range 0.10-10.0 μg mL-1. Accuracy in the measurement of quality control (QC) samples was in the range 95-107% of the nominal values. The intra-day and
inter-day precisions in the measurement of QC samples were less than 10% coefficient of variation. The developed
method is suitable for quality control of midazolam in their mixtures and in transdermal delivery system pharma-ceutical preparations. The validated assay was found to be suitable for the pharmacokinetic study of midazolam in rats with transdermal administration.
Keywords: Midazolam, transdermal, pharmacokinetic, liquid chromatography
Introduction
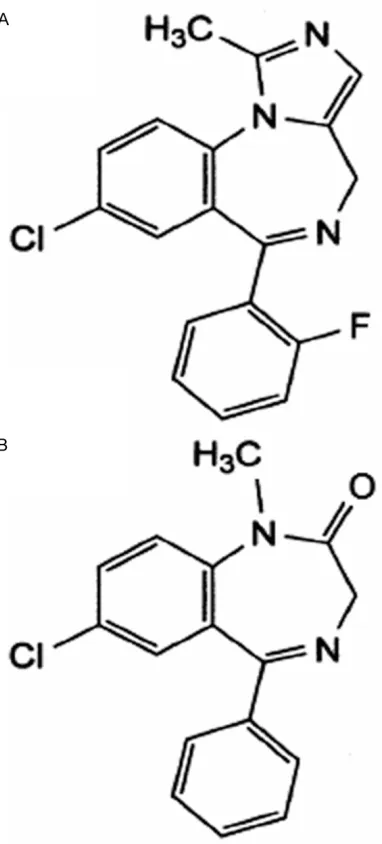
Midazolam (MDZ, CAS [59467-70-8]) is a short-acting benzodiazepine compound and its chemical structure is shown in Figure 1. MDZ is commonly used in intravenous anesthesia induction, short-term sedation and anticonvul-sant [1]. The compound shows the inhibitory action on the central nervous system results from its interactions with the GABAA receptors, which are present in several brain regions [2], therefore it is widely used as a premedicant medicine before surgery as for its relative safe-ty when compared with barbiturates as it do not lead to coma when used in high doses [3-5]. While the most important drawback of the drug applying in clinic is the necessity of repeated intravenous or intramuscular administration since the duration of elimination half-life in human is relatively short, which is disadvan-tage for patient compliance [6].
A transdermal patch contained Midazolam is developed in our laboratory. The transdermal drug delivery systems (TDDS) have been suc-cessfully developed to treat a variety of condi-tions from smoking cessation to pain [7], and the TDDS has a number of advantages over other administration, as it provides continuous administration of drug through the skin, which maintains constant plasma drug levels [8]. Continuous delivery of drug may reduce sys-temic side effects associated with high plasma drug levels [9]. The multiday dosing that is made possible by the sustained delivery of drugs with short half-life, which would require frequent dosing if given intravenous or intra-muscular administration, improves patient compliance [10].
fluids, such as in serum, plasma, urine or whole
blood. These techniques utilized high perfor-mance liquid chromatography (HPLC) with UV detection [11-14], HPLC-mass spectrometry (MS) [15-17], and gas chromatography-mass spectrometry (GC-MS) [18]. Although these methods utilizing MS detectors are more
spe-cific and sensitive than HPLC-UV assays, and
provide very low limits of detection, the essen-tial equipment may not be available in many laboratories. Most of the HPLC-UV methods suffer from various limitations, including inad-equate sensitivity; use of expensive solid phase extraction cartridges, long run times, or
[image:2.612.95.286.71.493.2]rigor-ous operating requirement of mobile phase [11-14, 19].
Herein, we present a HPLC-UV method for the assay of MDZ in rat plasma and its validation in transdermal drug delivery system. The method
offers the advantage of simplicity, specificity,
sensitivity, and low sample volume to perform pharmacokinetic studies of midazolam. The simplicity of our proposed method is facilitated by using a single-step liquid extraction proce-dure rather using the expensive solid phase extraction cartridges. The mobile phase was
modified with organic alkali rather than phos -phate, which made the two similar compounds, midazolam and diazepam, separate well. The sensitivity was good enough to monitor MDZ level in plasma for 24 h after transdermal administration. Therefore, we report an applica-tion of the method to determine MDZ pharma-cokinetics in rat after a single transdermal administration. To our knowledge this is the
first method described for the quantification of
MDZ in transdermal drug delivery system.
Experimental
Chemicals and reagents
Midazolam was purchased from the Enhua Pharmaceutical Co. Ltd. (Xuzhou, Jiangsu Pro- vince, China). The internal standard (I.S.) diaze-pam was purchased from National Institute for the Control of Pharmaceutical and Biological Products (Beijing, China). Methylene dichloride, acetonitrile (all HPLC grade), triethylamine, and sodium hydroxide were purchased from Dahua Chemic Regent Company (Guangzhou, China). Methanol was of HPLC grade from SIYOU Co. Ltd. (Tianjin, China). All other reagents and sol-vents used were of analytical grade and water was milli-Q grade.
Apparatus and chromatographic conditions
Liquid chromatography was carried out on an Agilent 1200 series HPLC apparatus which con-sisted of a quart pump, a degasser, a Rheodyne
model 7125 injector with 20 μL loop (Rheodyne
Inc., Cotata, CA, USA), a UV detector, a column oven and a LC1200 workstation (Agilent, PA, USA). The separations were performed on a Hypersil ODS C18 column of 250×4.6 mm i.d.,
with 5 μm particle size (Thermo, USA). The
mobile phase consisted of a mixture of acetoni-Figure 1. The chemical structures of (A) midazolam
trile and 0.1% triethylamine aqueous solution
(52:48, V/V), at a flow rate of 1.0 mL min-1. The
mobile phase was prepared daily and filtered under vacuum through a 0.45 μm membrane filter before use. The eluate was continuously
monitored using a UV detector at wavelength 239 nm. Separations were maintained at 25°C. Preparation of calibration standards and qual-ity control samples
A stock solution of MDZ (2 mg mL-1) was diluted
to a series of working standard solutions of
MDZ containing 1, 2, 4, 10, 20, 40, 100 μg mL-1
in methanol, and the internal standard working
solution of 2.0 μg mL-1 was prepared in
methanol.
Twenty microliters of these working MDZ solu-tions were added to 0.18 mL drug-free plasma to prepared the calibration standard samples
containing 0.1, 0.2, 0.4, 1.0, 2.0, 4.0, 10.0 μg
mL-1 of MDZ. Quality control (QC) samples with
low, medium, and high concentrations of 0.4,
4.0, and 10.0 μg mL-1 of MDZ were prepared in
the same.
Extraction of MDZ from plasma
0.2 mL plasma (blank plasma, sample plasma, and plasma spiked with MDZ for preparation of
calibration and QC samples) were added 10 μL I.S. working solution, 10 μL of 2 mol L-1 sodium
hydroxide, and 1 mL mixed organic solvents (n-hexane: methylene dichloride: isopropanol = 64:33:3, V/V/V) in turn. The mixture was vortex mixed for 1 min and centrifuged at 3,000 g for 10 min, and then the organic phase was trans-ferred into another tube and evaporated to dry-ness at room temperature with the aid of a gentle stream of nitrogen. The residue was
dissolved in 400 μL of methanol, and aliquot of 20 μL was injected into the LC system for
analysis.
Method validation
Specificity: Chromatograms obtained from blank plasma, spiked plasma, and plasma from treated rat, were compared to determine the level of interference of endogenous compo-nents with MDZ and I.S.
Linearity and sensitivity: For the evaluation of linearity, calibration curves were constructed
by plotting the peak area ratio of MDZ to I.S. vs
concentration of MDZ, and fitted by the least
square method with a 1/C2 weighting factor.
Calibration curves containing seven points we- re assayed in duplicate on three consecutive
days over the range 0.10-10.0 μg mL-1.
The LOQ was defined as the limit of quantifica -tion with a signal-to-noise ratio of >10, a
preci-sion of RSD <15% and RE <10%, and verified by five replicates [20].
Precision, accuracy and extraction recovery: QC samples at three different concentrations
(0.4, 4.0, and 10.0 μg mL-1 for MDZ) were
pre-pared and analyzed. The intra- and inter-day assays were repetitively carried out on the
plas-ma samples five times a day and once a day for
three sequential days, respectively. The accu-racy was calculated as relative error (RE, %) between nominal and measured concentra-tions. The precision was determined as the rel-ative standard deviation (RSD, %) of the mea-sured concentrations. The intra- and inter-day precisions were required to be below 15%, and the accuracy to be the range from -20% to 10%. (the VICH Steering Committee, European Medi- cines Agency, 2009).
To assess the plasma extraction recovery, two
series of five replicates of QC samples at low,
middle and high concentration were processed as described above, one with plasma and another with mobile phase. The extraction recovery was obtained by calculating the area ratio of spiked plasma samples to the corre-sponding samples with mobile phase instead. Pharmacokinetic study
A transdermal patch containing MDZ were prepared in our laboratory with the method
as follow. Briefly an acrylic resin composition
(Hecheng Pharmaceuticals trade Ltd., Nanjing, China) was dissolved in ethyl acetate at ambi-ent temperature. MDZ was solvambi-ent in a mixture solvent of ethanol and propanediol, and Azone as the penetration enhancer were then added to the above solution that was agitated at room temperature for 20 min, and then homogenized for 10 min. The mixture was applied to the
sur-face of a flexible backing membrane (Kangbeide
patch was cut to pieces (4×4 cm2, containing 9
mg of MDZ), covered by a protective membrane layer, and packed by aluminum-plastic mem- brane.
Forty-five Sprague-Dawley rats (body weights
250±20 g) purchased from Guangdong Medical College Laboratory Animal Center (Zhanjiang, China), were used to study the pharmacokinet-ics of MDZ patch. All experimental procedures were performed in accordance with guidelines on experimental (pre-clinical) study of new pharmacological substances (Sino Food and
Drug Administration, 2007). Rats were fixed
and patch was applied to the shaved skin.
Blood samples were collected at specific time
points till 48 h, and centrifuged at 13,000 rpm
for 10 min. Plasma (200 μL) was separated and
stored at -20°C till analyzed [21].
The plasma concentrations of MDZ at different times were expressed as means ± SD, and the mean concentration-time curve was plotted. All calculations of pharmacokinetic data were per-formed with the program of Drug and Statistics 3.0 (DAS, T.C.M. Shanghai, China).
Result and discussion
Optimization of chromatographic conditions
MDZ and diazepam, the I.S, are both typical benzodiazepine compounds with basic group in the molecules as for the presence of a imidaz-ole ring in the 1, 2-position (Figure 1). The
nitro-gen in the 2-position provides sufficient basici
-ty (pKa 6.15). In strong acidic solutions the
diazepine ring reversibly opens between the positions 4 and 5, producing a polar water-sol-uble primary amine derivative. At physiological pH values, approximately 96% of MDZ is bound to plasma proteins [22]. Therefore, during the extraction of MDZ and I.S. from plasma with organic solvents, sodium hydroxide solution (2 mol L-1) was added to increase the efficiency of
the extraction procedure. The extraction recov-ery of MDZ was increased up to 92% when alka-li was added into the plasma samples, in
con-trast it was only 68% when no basification of
the samples, and the extraction recovery of I.S. was increased from 64% to 90%.
The extraction solvents used by most of the HPLC reports for MDZ include using either diethyl ether, ethyl acetate, n-hexane or diethyl
ether/methylene chloride [23-25], while the combination of methylene dichloride and n-hex-ane in different proportions were previously tested and the mixed organic solvents (n-he- xane: methylene dichloride: isopropanol = 64:33:3, V/V/V) was found be an ideal extrac-tion solvent. In reported liquid-liquid extracextrac-tion method, the extraction solvent was diethyl ether [14]; moreover, the dosage of extraction solvent was 4 ml per sample, which was pro-fuse in organic solvent though the recovery is high up to about 100%. In this method, the dos-age of extraction solvent was 1 ml per sample, and the extraction recovery of MDZ and the I.S. was up to 92% and 90%, with a CV less than 13% and 11%, respectively. The recovery was suitable in the application of pharmacokinetic assay and the precision and accuracy were accordance with the claim (the VICH Steer- ing Committee, European Medicines Agency, 2009). Compared with other methods utilizing liquid-liquid extraction [14, 26], this method showed better or at least similar results in the determinations of MDZ.
Diazepam was used as the internal standard because its molecular structure was similar with MDZ, but unfortunately, the two similar compounds were hardly separated. So a suit-able mobile phase was necessary. For a sharp and symmetrical peak, the mobile phase was
should be alkali, 15 mM KH2PO4 was used to
triethylamine was selected finally. The mixture
of acetonitrile and 0.1% triethylamine aqueous
solution (52:48, V/V) was confirmed for the
optimal mobile phase; MDZ and I.S. were sepa-rated well with this mobile phase.
Method validation
Specificity: The specificity of the method was
demonstrated by comparing chromatograms of samples from blank plasma, drug-spiked plas-ma and sample plasplas-ma. The typical chroplas-mato- chromato-grams were obtained with a drug-free plasma, a naive plasma spiked with MDZ and a plasma
sample containing 0.56 μg mL-1 of MDZ (Figure
2). No peaks from endogenous plasma compo-nents or MDZ metabolites interfering with MDZ or internal standard were observed. The reten-tion times of MDZ and diazepam (internal
stan-Pharmacokinetic study
In vivo evaluation of plasma concentrations of MDZ was carried out in Sprague-Dawley rats on ventral surface, and the mean plasma
concen-tration-time curve profile was illustrated in
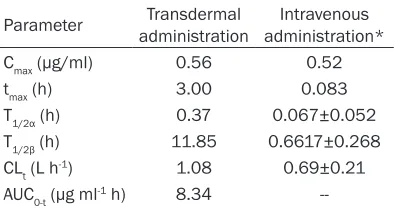
Figure 3. The corresponding pharmacokinetic
parameters were calculated and listed in Table 2. Plasma concentrations of MDZ after intrave-nous administration in rats were reported [27], and the values of AUC0-t, Cmax, tmax and t1/2 were listed in Table 2 to compare with that of trans-dermal administration.
The results in Table 2 showed that significant
[image:6.612.90.377.127.451.2]difference existed between some parameters although the values of Cmax in the two adminis-trations were similar. The distribution half-live (t ) of TDDS (0.37 hr) was longer a lot than Figure 2. LC chromatograms obtained from: A. A blank rat plasma; B. A rat plasma spiked with Midazolam reference
at 50 μg mL-1; C. A rat plasma spiked with Midazolam and Diazepam at 40 μg mL-1 and 1.0 μg mL-1, respectively; D. A rat plasma collected at 2 h after a transdermal administration of 9 mg Midazolam per patch, spiked with I.S. at 0.1
μg mL-1, Peaks: 1 = Midazolam, 2 = Diazepam (I.S.).
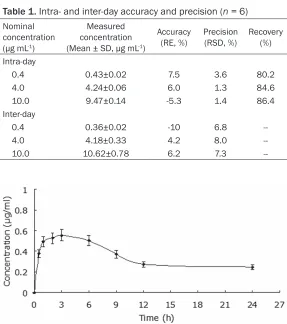
Table 1. Intra- and inter-day accuracy and precision (n = 6)
Nominal concentration (μg mL-1)
Measured concentration
(Mean ± SD, μg mL-1)
Accuracy
(RE, %) Precision(RSD, %) Recovery (%) Intra-day
0.4 0.43±0.02 7.5 3.6 80.2
4.0 4.24±0.06 6.0 1.3 84.6
10.0 9.47±0.14 -5.3 1.4 86.4
Inter-day
0.4 0.36±0.02 -10 6.8
4.0 4.18±0.33 4.2 8.0
10.0 10.62±0.78 6.2 7.3
--Figure 3. Mean plasma concentration-time profile for Midazolam in rat plas -ma after a transder-mal administration of 9 mg Midazolam per patch.
dard) were 6.1 and 7.9 min, respectively. The total run ti- me for an assay was approxi-mately 15 min.
Calibration curve and sensi-tivity: The calibration curve was constructed with a peak area ratio of MDZ to I.S. vs 5F plasma concentration. The mean regression equation is y = 0.0475x+0.1071 (r2 =
0.9983), in which x is the MDZ plasma concentration, with a
linear range of 0.10-10.0 μg
mL-1. The LOQ was 0.02 μg
mL-1 (S/N = 32, RSD = 2.6%,
RE = 1.6%).
Precision, accuracy and ex- traction recovery: The intra- and inter-day precision, accu-racy and extraction recovery were listed in Table 1, show-ing the method to be good of precision, accuracy and extra- ction recovery. Plasma
sam-ples were efficiently extracted
with the mixed organic
sol-vents under the confirmed
[image:6.612.92.377.150.402.2]that (0.06 hr) of intravenous administration, which could be attributed to the skin barrier for drug permeation. The elimination half-live (t1/2β) was about 11 hr in the TDDS applied in rats, by comparison, the t1/2β in intravenous administra-tion was about 0.6 hr, it indicated that the TDDS
can significantly prolong the effective therapeu -tic time. And more notably, there is two steady-state plasma levels was observed in the TDDS and the steady state levels were maintained hereabout the Cmax during 3-6 hr and the
sus-taining concentration of approximately 0.3 μg
mL-1 during 12-24 hr. After 6hr, the
concentra-tions of MDZ in plasma were determined decreasing and the drug was metabolized and eliminate until 24 hr, while it was clear after 2 hr in intravenous administration. These results indicated the TDDS could be controlled releas- ed and maintained a long effective drug con-centration, which are advantages for improving patient compliance and avoiding to frequently intravenous administration.
Conclusion
The described LC method with UV detection is the simple analytical method for the determina-tion of MDZ in rat plasma. It has been linear, precise and accurate in the concentration
range 0.10-10.0 μg mL-1; therefore it is suitable
for pharmacokinetic study of MDZ in trasder-mal delivery drug system. The transdertrasder-mal patch was found to have a prolonged release of MDZ and proved to be useful as a sustained release drug delivery system when compared to intravenous administration.
Acknowledgements
This research was financially supported by Guangdong Key Technologies R&D Program
(2009B030801331).
Disclosure of conflict of interest
None.
Address correspondence to: Mingcang Wang, De- partment of Anesthesiology, Taizhou Hospital of Zhejiang Province, 31700 Linhai, Zhejiang, P. R. China. E-mail: [email protected]
References
[1] Reves JG, Fragen RJ, Vinik HR, Greenblatt DJ. Midazolam: pharmacology and uses. Anesthe- siology 1985; 62: 310-324.
[2] Williams DA, Foye WO, Lemke TL. Foye’s Principle of Medicinal Chemistry, 6th edition.
Philadelphia, PA: Lippincott Williams & Wilkins;
2008.
[3] Trevor AJ, Katzung BG, Masters SB. Basic and
Clinical Pharmacology, 8th edition. New York, NY: Mc Graw-Hill; 2007.
[4] The British Pharmacopoeia Secretariat of the Medicines and Healthcare products Regulatory
Agency. British Pharmacopoeia, UK, 2009.
[5] Rang HP, Dale MM, Ritter JM, Flower RJ, Henderson G. Rang and Dale’s Pharmacology, 7th edition. Philadelphia, PA: Churchill Living- stone; 2011.
[6] Dundee JW, Halliday NJ, Harper KW, Brogden
RN. Midazolam: a review of its pharmacologi-cal properties and therapeutic use. Drugs 1984; 28: 519-543.
[7] Graziottin A. A review of transdermal hormonal contraception: focus on the ethinylestradiol/ norelgestromin contraceptive patch. Treat Endocrinol 2006; 5: 359-365.
[8] Burkman RT. The transdermal contraceptive system. Am J Obstet Gynecol 2004; 190: S49-53.
[9] Potts RO, Lobo RA. Transdermal drug delivery: clinical considerations for obstetrician-gyne-cologist. Obstet Gynecol 2005; 105: 953-961. [10] Brynhildsen J, Hammar M. Lipids and clotting
factors during low dose transdermal estradiol/ norethisterone use. Maturitas 2005; 50: 344-352.
[11] Samanidou VF, Pechlivanidou AP, Papado- yannis IN. Development of a validated HPLC method for the determination of four 1,4-
Benzodiazepines in human biological fluids. J
Sep Sci 2007; 30: 679-687.
[12] EI Mahjoub A, Staub C. High-performance liq-uid chromatographic method for the determi-nation of Benzodiazepines in plasma or ser- um using the column-switching technique. J Chromatogr B Biomed Sci Appl 2000; 742: 381-390.
[13] Bugey A, Staub C. Rapid analysis of Ben- zodiazepines in whole blood by
high-perfor-Table 2. Comparison of MDZ
pharmacokinet-ics between Transdermal administration and Intravenous administration in rats
Parameter administrationTransdermal administration*Intravenous
Cmax (μg/ml) 0.56 0.52
tmax (h) 3.00 0.083
T1/2α (h) 0.37 0.067±0.052 T1/2β (h) 11.85 0.6617±0.268 CLt (L h-1) 1.08 0.69±0.21
AUC0-t (μg ml-1 h) 8.34
[image:7.612.91.288.109.213.2]lithic column. J Pharm Biomed Anal 2004; 35: 555-562.
[14] Hamdy DA, Brocks DR. High performance liq-uid chromatographic assay for the simultane-ous determination of midazolam and ketocon-azole in plasma. J Pharm Biomed Anal 2010; 53: 617-622.
[15] Moore C, Coulter C, Crompton K, Zumwalt M.
Determination of Benzodiazepines in Oral Fluid Using LC-MS-MS. J Anal Toxicol 2007; 31: 596-600.
[16] Ogasawara A, Kume T, Kazama E. Effect of oral ketoconazole on intestinal first-pass effect of
midazolam and fexofenadine in cynomolgus monkeys. Drug Met Dis 2007; 35: 410-418. [17] Harris SR, Gedge JI, Nedderman AN, Roffey SJ,
Savage M. A sensitive HPLC-MS-MS assay for quantitative determination of midazolam in dog plasma. J Pharm Biomed Anal 2007; 35: 127-134.
[18] Aebi B, Sturny-Jungo R, Bernhard W, Blanke R, Hirsch R. Quantitation using GC-TOF-MS: ex-ample of Bromazepam. Forensic Sci Int 2002; 128: 84-89.
[19] Hasan H, Mohammad AK, Mohammad AM.
Development of a validated HPLC method for the separation and analysis of a Bromazepam, Medazepam and Midazolam mixture. J Pharm Anal 2012: 10.1016/j.jpha.2012.05.001 [20] Lu YN, Wu KF, Liang NC, Chen GG. LC method
for quantification of
ent-11a-hydroxy-15-oxo-kaur-16-en-19-oic-acid in rabbit plasma vali- dation and application to a pharmacokinetic study. Chromatographia 2009; 70: 1599-1603.
[21] Wang X, Lee WY, Zhou X, Or PM, Yeung JH.
A pharmacodynamic-pharmacokinetic (PD-PK)
study on the effects of Danshen (Salvia miltior-rhiza) on midazolam, a model CYP3A probe substrate in the rat. Phytomed 2010; 17: 876-883.
[22] Allonen H, Ziegler G, Klotz U. Midazolam kinet -ics. Clin Pharm Therap 1981; 30: 653-661. [23] Jurica J, Dostálek M, Konecný J, Glatz Z,
Hadasová E, Tomandl J. HPLC determination of midazolam and its three hydroxy metabolites in perfusion medium and plasma from rats. J Chromatogr B Anal Technol Biomed Life Sci 2007; 852: 571-577.
[24] Kato R, Yamashita S, Moriguchi J, Nakagawa M, Tsukura Y, Uchida K, Amano F, Hirotani Y, Ijiri Y, Tanaka K. Change of midazolam phar -macokinetics in Wistar rats treated with lipo-polysaccharide: relationship between total CYP and CYP3A2. Innate Immun 2008; 14: 291-297.
[25] Kurosawa S, Uchida S, Ito Y, Yamada S. Effect
of ursodeoxycholic acid on the pharmacokinet-ics of midazolam and CYP3A in the liver and intestine of rats. Xenobiotica 2009; 39: 162-170.
[26] Yasui-Furukori N, Inoue Y, Tateishi T. Sensitive determination of midazolam and 1’-hydroxymi-dazolam in plasma by liquid-liquid extraction and column-switching liquid chromatography with ultraviolet absorbance detection and its application for measuring CYP3A activity. J Chromatogr B Anal Technol Biomed Life Sci 2004; 811: 153-157.