294
©IJRASET: All Rights are Reserved
A Study on Flexural Behaviour of Rectangular
GPC Slabs with Simply Support using ANSYS
Software
Dakshayini S
1, Mr Shivaraj G Nayak
2, Dr Gopisiddappa
31M. Tech Student, Computer Aided Design of Structures, Department of Civil Engineering, PES College of Engineering, Mandya,
Karnataka
2Assistant Professor, Department of Civil Engineering, PES College of Engineering, Mandya, Karnataka, 3Professor, Department of Civil Engineering, PES College of Engineering, Mandya, Karnataka,
Abstract: Geopolymer concrete is one of the emerging construction materials as a substitute for conventional cement as it eliminates the usage of OPC. An Analytical study has been carried out to investigate flexural behaviour of high strength traditionally vibrated concrete (HSTVC) and high strength Geo polymer concrete (HSGPC) of twelve slabs with all edges were simply supports were analysed using ANSYS Software. Sizes of slabs were 1000X1500X65mm. ANSYS WORKBENCHV16.2 software was used to prepare and analyse non- linear finite element models. Load-deflection behaviour, ultimate load, and load enhancement beyond Johansen’s load were obtained and compared with experimental results. ANSYS results demonstrated a sensible concurrence of the test yield. From the analysis results, it was observed that the Ultimate load carrying capacity improved as reinforcement increased. This was consistent in both experimental and ANSYS.
Keywords: HSTVC Slab, HSGPC Slab, ANSYS, Load-deflection behaviour, Non-Linear Analysis, ANSYS
WORKBENCHV16.2.
I. INTRODUCTION
Slabs are structural component which can support whole area loadings like dead loads,live loads, floor finishes etc. The behaviour
of slabs is mainly governed by edge support condition i.e. simply support, fixed etc. and span length along both shorter and longer
directions in multi-floor system. Geopolymer was the name given by Daidovits in 1978 to materials which are characterized by
chains or networks or inorganic molecules. Geopolymer cement concrete is made from utilization of by-product materials such as fly ash and ground granulated blast furnace slag (GGBS). Geo Polymer concrete is more ecological. It has good compressive strength comparable to OPC. Since limestone is not present in the mix, corrosion is avoided in rebars. GPC has got good durability properties and thermal stability, less water absorption, very low creep and shrinkage, time of curing and water binder ratio the strength of GPC is controlled.
In this study high strength geo polymer concrete (HS-GPC) and high strength traditionally vibrated concrete (HS-TVC) slabs with simply supports i.e. isolated slabs are analysed using mechanical software called ANSYS WORKBENCHV16.2. The grade of concrete for both slabs are M60. The slabs are analysed to study the flexural behaviour and ultimate strength for both types of slabs and hence analysed results are compared with experimental results. Use of finite element methods to find out the ultimate loads of slabs and deflections of slabs are recent development. Using this software nonlinear analysis can be carried out by defining the nonlinear properties of materials. Studied using ANSYS finite element package has shown that it can be simulate the behaviour of reinforced concrete elements. The results obtained from ANSYS are compare with experimental results.
A. Objectives
1) To model the reinforced concrete slabs called as HSTVC slabs and HSSGPC with different percentage of steel using FEM.
2) To prove the properties of GPC are similar to conventional concrete.
3) To determine analytically the load-deflection behaviour, ultimate load using ANSYS WORKBENCHV16.2 and then determine
the load enhancement beyond Johansen’s load and load detraction behind Johansen’s load for each slabs from results.
4) To study the load-deflection behaviour and strength of GPC slabs and TVC slabs.
295
©IJRASET: All Rights are Reserved
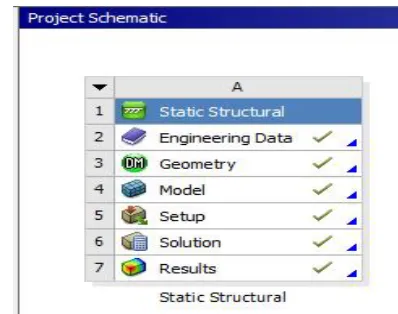
[image:2.595.191.390.184.341.2]Fig. 1 Step involving in processing of the model and analysis of slab
TABLE 1: Illustrates particulars of compressive strength, Young’s modulus, Poisson’s ratio and Density obtained from experimentally.
B. Geometry and Modelling
The Finite Element Analysis included modelling of traditionally vibrated concrete and geo polymer concrete slabs 1) Modeling of Reinforced Concrete and Steel Reinforcement
a) Model slab of size 1500mmx100mmx65mm was created in ANSYS using rectangular block.
b) Structural steel was used to model steel reinforcement in ANSYS. It truly is a 3D line element and having three degrees of
freedom at each node.
Slab (fck)(Mpa)
ELASTIC MODULUS Ec=5000fck (Mpa)
POISSON’S RATIO
DENSITY
(Kg/m3)
TVC1 63.43 39821.4766 0.2 2400
TVC2 63.43 39821.4766 0.2 2400
TVC3 63.43 39821.4766 0.2 2400
TVC4 63.43 39821.4766 0.2 2400
TVC5 63.43 39821.4766 0.2 2400
TVC6 63.43 39821.4766 0.2 2400
GPC1 57.09 37778.96 0.16 2700
GPC2 57.09 37778.96 0.16 2700
GPC3 57.09 37778.96 0.16 2700
GPC4 57.09 37778.96 0.16 2700
GPC5 57.09 37778.96 0.16 2700
296
[image:3.595.54.543.104.277.2]©IJRASET: All Rights are Reserved
[image:3.595.41.247.305.539.2] [image:3.595.41.505.307.538.2]Fig. 2 Concrete model in ANSYS Fig. 3 Concrete model in ANSYS
TABLE 2: Illustrates particulars of geometric details of slab. TABLE 3: Illustrates particulars reinforcement details of slabs
2) Model: Assign the properties of materials with respect to their behavior.
C. Connection
The model of slab was done with all corresponding engineering data and with required experimental data then the bond between two materials is taken as “NO SEPARATION”.
D. Meshing
To obtain satisfactory results from the Concrete element, a rectangular mesh was considered. Similar to that of ANSYS MAPDL, meshing will discretize the model into elements and nodes that will resemble the geometry.
E. Loading and Boundary Conditions
Displacement boundary conditions are needed to constraint the model to get a unique solution.All slabs were subjected to uniform
distributed loading. The loading points in the finite element versions also were precisely at the same locations as in the experimental set up.
Slab Dimensions of
slab in mm
Effective dimensions of slab
in mm
TVC-1 1500x1000x65 1400x900x65
TVC-2 1500x1000x65 1400x900x65
TVC-3 1500x1000x65 1400x900x65
TVC-4 1500x1000x65 1400x900x65
TVC-5 1500x1000x65 1400x900x65
TVC-6 1500x1000x65 1400x900x65
GPC-1 1500x1000x65 1400x900x65
GPC-2 1500x1000x65 1400x900x65
GPC-3 1500x1000x65 1400x900x65
GPC-4 1500x1000x65 1400x900x65
GPC-5 1500x1000x65 1400x900x65
GPC-6 1500x1000x65 1400x900x65
Slab
Dia of bars, in
mm
Spacing of bars in mm
Shorter direction
Longer direction
TVC-1 6 150 150
TVC-2 6 120 150
TVC-3 6 100 150
TVC-4 6 85 150
TVC-5 6 75 150
TVC-6 6 50 150
GPC-1 6 150 150
GPC-2 6 120 150
GPC-3 6 100 150
GPC-4 6 85 150
GPC-5 6 75 150
297
©IJRASET: All Rights are Reserved
[image:4.595.51.538.110.237.2]
Fig.4: Model with applied boundary conditions Fig.5: Model with load applied
F. Convergence Criterion
The convergence study was carried out on models to check mesh density. For this a finite element model is to be divided into a number of discrete elements, and the results will converge only if proper number of elements is used. In current study also a convergence study was conducted to determine the mesh density. For the full scale slab of 1500X1000X65 mm the slab. To attain precision in results element size was to be regarded as 20mm or below.
G. Nonlinear Solution in ANSYS
Properties assigned to steel and concrete elements are detailed in above steps. After application of loads at specific locations, the ANSYS programme runs and the results such as deformations of each load step, ultimate load etc. are obtained. Analysis setting in the solution information was such that number of steps the programme has to carry is defined. The time interval for each load step was also defined. The load step definition has no much role in ANSYS workbench. Workbench will consider default settings in the lack of load step definition. When the load steps are offered, the Newton-Raphson solver converges the solution to most exact level. The nonlinear algorithm and nonlinear convergence parameters were defined to obtain precise results.
III.RESULTS AND DISCUSSION
Load Vs deflection behaviour of both high strength traditionally vibrated concrete and high strength geo polymer concrete slabs in analytical studies are compared with experimental results and is tabulated as follows.
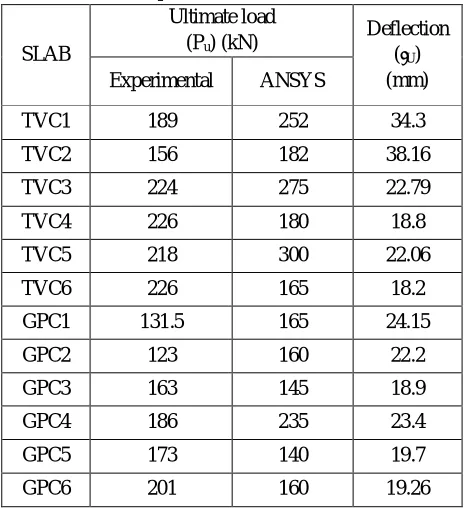
TABLE 4: Illustrates particulars reinforcement details of slabs
SLAB
Ultimate load
(Pu) (kN)
Deflection (ᵟU)
(mm)
Experimental ANSYS
TVC1 189 252 34.3
TVC2 156 182 38.16
TVC3 224 275 22.79
TVC4 226 180 18.8
TVC5 218 300 22.06
TVC6 226 165 18.2
GPC1 131.5 165 24.15
GPC2 123 160 22.2
GPC3 163 145 18.9
GPC4 186 235 23.4
GPC5 173 140 19.7
[image:4.595.182.415.478.733.2]298
©IJRASET: All Rights are Reserved
Fig.6 Load- deflection curve for TVC1 Fig.7 Deflection behaviour of TVC1 at ultimate load
1) ANSYS provided lesser deformation when compared with experimental work under the same loading conditions.
2) The ultimate load carried by analytical model was about 33% higher than experimental values.
Fig.8 Load- deflection curve for TVC2 Fig.9 Deflection behaviour of TVC2 at ultimate load
3) The ultimate load carried by analytical model was about 16% higher than experimental values.
Fig.10 Load- deflection curve for TVC3 Fig.11 Deflection behaviour of TVC3 at ultimate load
4) The ultimate load carried by analytical model was about 22% higher than experimental values.
299
©IJRASET: All Rights are Reserved
Fig.14 Load- deflection curve for TVC5 Fig.15 Deflection behaviour of TVC5 at ultimate load
7) The ultimate load carried by analytical model was about 37% higher than experimental values.
Fig.16 Load- deflection curve for TVC6 Fig.17 Deflection behaviour of TVC6 at ultimate load
8) The ultimate load carried by analytical model was about 36% lower than experimental values.
Fig.18 Load- deflection curve for GPC1 Fig.19 Deflection behaviour of GPC1 at ultimate load
9) The ultimate load carried by analytical model was about 25% higher than experimental values.
300
©IJRASET: All Rights are Reserved
10) The ultimate load carried by analytical model was about 32% higher than experimental values
Fig.20 Load- deflection curve for GPC3 Fig.21 Deflection behaviour of GPC3 at ultimate load
11) The ultimate load carried by analytical model was about 12% lower than experimental values.
Fig.22 Load- deflection curve for GPC4 Fig.23 Deflection behaviour of GPC4 at ultimate load
12) The ultimate load carried by analytical model was about 26% higher than experimental values.
Fig.24 Load- deflection curve for GPC5 Fig.25 Deflection behaviour of GPC5 at ultimate load
13) The ultimate load carried by analytical model was about 23% lower than experimental values.
301
©IJRASET: All Rights are Reserved
[image:8.595.44.546.119.254.2]
Fig.28 Load- deflection curve for TVC slabs Fig.29 Load- deflection curve for GPC slabs
[image:8.595.32.565.311.442.2]IV. PERCENTAGE OF STEEL vs ULTIMATE LOAD
TABLE 5: Percentage of steel vs ultimate load relation for TVC and GPC slabs
Percentage
of steel Slab
Ultimate load(KN)
EXP/AN Experimental
(EXP)
ANSYS (AN)
0.29 TVC1 189 252 1.33
0.36 TVC2 156 182 1.16
0.43 TVC3 224 275 1.23
0.51 TVC4 226 180 0.79
0.58 TVC5 218 300 1.38
0.87 TVC6 226 165 0.73
15) It is seen that in this case also when percentage of steel increased, ultimate load carrying capacity also increased for both
experimental and ANSYS results but as in case of TVC4 and TVC6 slabs percentage of steel increased, ultimate load carrying capacity decreased in ANSYS results when compared with experimental results.
16) It is seen that in this case also when percentage of steel increased, ultimate load carrying capacity also increased for both
experimental and ANSYS results but as in case of GPC3, GPC5 and GPC6 slabs percentage of steel increased, ultimate load carrying capacity decreased in ANSYS results when compared with experimental results.
V. COMPARISION OF LOAD ENHANCEMENT AND LOAD DETRACTION
The load enhancement and load detraction of Johansen’s yield line load is computed for both experimental and ANSYS cases.
[image:8.595.47.547.556.730.2]
Fig.30 Load enhancement and load detraction for TVC slabs Fig.31 Load enhancement and load detraction for TVC slabs Percentage
of steel Slab
Ultimate load(KN)
EXP/AN Experimental
(EXP)
ANSYS (AN)
0.29 GPC1 131.5 165 1.25
0.36 GPC2 123 160 1.3
0.43 GPC3 163 145 0.9
0.51 GPC4 186 235 1.26
0.58 GPC5 173 140 0.80
302
©IJRASET: All Rights are Reserved
17) It can be observed from the above table that load enhancement beyond Johansen’s Load was magnifying as the percentage of
steel increased. This phenomenon observed in both experimental and ANSYS results for both types of slabs. But it can also be observed from the above table that load detraction behind Johansen’s Load was reduce as the percentage of steel increased. This phenomenon observed in TVC6 slabs in ANSYS results.
18) It can be observed from the above table that load enhancement beyond Johansen’s Load was magnifying as the percentage of
steel increased. This phenomenon observed in both experimental and ANSYS results for both types of slabs. But it can also be observed from the above table that load detraction behind Johansen’s Load was reduce as the percentage of steel increased. This phenomenon observed in GPC5 and GPC6 slabs in ANSYS results.
VI. CONCLUSIONS
From the analytical results of HSTVC and HSGPC Slabs are compared with experimental results it can be conclude that,
A. The ultimate loads obtained from ANSYS model for TVC slabs were varied from 16% to 37% higher than the experimental
work. And for GPC slabs it was varied from 25% to 36% higher than experimental work. This may be attributed to the assumptions of perfect bond between the reinforcement and concrete in ANSYS model.
B. It can be concluded that up to 30% of ultimate load the behaviour was linear and later nonlinear behaviour is observed due to
reduced stiffness.
C. The midspan deflections obtained from ANSYS have been lesser than that of experimental work for same magnitude of load.
This may be due to the bond slip between the steel and concrete is disregarded in ANSYS.
D. Deflection decreased as the percentage of reinforcement increased when compared to experimentally obtained result. In some
slabs it showed increase in deflection.
E. Ultimate load carrying capacity improved as reinforcement increased. This was consistent in both experimental and ANSYS as
it is a expected behaviour of structural members. But in ANSYS it showed decreased load carrying capacity.
F. Load enhancement beyond Johansen’s yield line load was decreasing as percentage of reinforcement increased due to more
load steps. This is due to the fact that stiffness of the member reduces after the cracking loads till ultimate load.
G. The converged solution for the structural element will be realised only when small load steps are given because after initial
cracking, the ANSYS results will not converge for greater load steps.
REFERENCES
[1] M Chandrasekhar, M V Seshagiri Rao, Maganti Janardhana (2011). ‘Analytical Modelling on the Stress- strain Behaviour of Hybrid Fibre Reinforced Self Compacting Concrete’, International Journal of Mathematical Sciences, 2, pp. 19-24.
[2] Abdul AleemM.I1 and ArumairaP.D2 “Optimum mix for the geopolymer concrete”. Indian Journal of Science and Technology, Vol. 5 No. 3 (Mar 2012), ISSN: 0974- 6846.
[3] Priyanka, design of beams with simply supported conditions, concrete research, vol 2, pp1314-1022, 2012.
[4] Desai, Prakash, Kulkarni.A.B(Oct 2015), ‘Load-Deflection Behaviour of simply supported Rectangular Reinforced Concrete Slabs’, IABSE Proceedings, pp. 11-78.
[5] Vinay kumar B G and V Harish. “Experimental study on Deformation Behaviour of Partially Restrained steel Fibre Reinforced High Strength SCC Two Way Rectangular Slabs”. Jul-2015
[6] K Nehimiya and T Chandra Shekhar Rao.”Experimental Investigation on Studying the Flexural Behaviour of Geopolymer Concrete Slabs Under Fixed Boundary Conditions”. Feb-2016
[7] Dr Mohammed Rasheed and Nibras Nizar Abduhammed, 2012, behaviour of Self –Consolidating Concrete Two way slabs uniform loading, Iraqi Journal of Civil engineering