University of Warwick institutional repository
This paper is made available online in accordance with
publisher policies. Please scroll down to view the document
itself. Please refer to the repository record for this item and our
policy information available from the repository home page for
further information.
To see the final version of this paper please visit the publisher’s website.
Access to the published version may require a subscription.
Author(s): Julian W. Gardner, Senior Member, IEEE, and James
E. Taylor
Article Title: Novel Convolution-Based Signal Processing
Techniques for an Artificial Olfactory Mucosa
Year of publication: 2009
Link to published version :
Novel Convolution-Based Signal Processing
Techniques for an Artificial Olfactory Mucosa
Julian W. Gardner
, Senior Member, IEEE
, and James E. Taylor
Abstract—As our understanding of the human olfactory system has grown, so has our ability to design artificial devices that mimic its functionality, so called electronic noses (e-noses). This has led to the development of a more sophisticated biomimetic system known as an artificial olfactory mucosa (e-mucosa) that comprises a large distributed sensor array and artificial mucous layer. In order to exploit fully this new architecture, new approaches are required to analyzing the rich data sets that it generates. In this paper, we propose a novel convolution based approach to processing signals from the e-mucosa. Computer simulations are performed to inves-tigate the robustness of this approach when subjected to different real-world problems, such as sensor drift and noise. Our results demonstrate a promising ability to classify odors from poor sensor signals.
Index Terms—Convolution, electronic nose, signal processing.
I. INTRODUCTION
O
VER the past 20 years, significant advances have been made in the understanding of the mechanism by which odors are detected by the human olfactory system. This has led to the concurrent development of instruments designed to de-tect odors and commonly known as artificial or electronic noses (e-noses) [1].However, sensor-based electronic noses today generally suffer from significant weaknesses that limit their widespread application. Their sensing ability is heavily affected by envi-ronmental factors: general drift due to temperature, humidity and background noise, sensor variations and sensor poisoning. These problems, in addition to often wanting to detect very low concentrations (below PPM) of the odor in air [2], [3], make the design of an electronic nose difficult even with expensive autosamplers and the supply of clean air.
Faced with this challenge, novel devices are being designed to tackle these issues and improve detection thresholds and clas-sification success rates; examples include combining an elec-tronic nose array with a gas chromatography column or mass spectrometer. These analytical instruments are large and expen-sive and place significant limitations on the way in which their application and potential market.
Manuscript received October 23, 2008; accepted January 29, 2009. Current version published July 01, 2009. This work was supported in part by the En-gineering and Physical Sciences Research Council (EPSRC) and in part by the Sensors Research Laboratory, University of Warwick. The associate editor co-ordinating the review of this paper and approving it for publication was Prof. Fabien Josse.
The authors are with the School of Engineering, University of Warwick, Coventry, CV4 7AL, U.K. (e-mail: [email protected]; James.E. [email protected]).
[image:2.594.301.555.165.360.2]Digital Object Identifier 10.1109/JSEN.2009.2024856
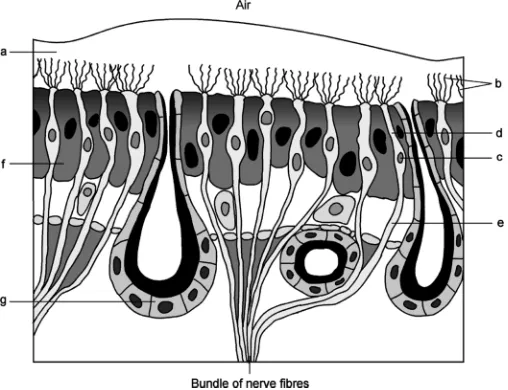
Fig. 1. Schematic structure of the olfactory organ. Located in the (a) mucous layer are the (b) olfactory cilia of the sensory cells. These cells consist of a (c) cellular body, (d) a dendrite, and (e) a neurite or axon. They are wedged in between support cells (f). The mucous layer is maintained by Bowman’s glands (g) [5].
More recently, it has been suggested that chromatography plays a role in odor discrimination within the biological ol-factory system, known as nasal chromatography [4]. This port suggests that the aqueous layer covering the olfactory re-ceptors in the olfactory epithelium (Fig. 1) acts as a retention layer as odors move along and through it, functioning similar to a stationary phase coated channel in a gas chromatographic system. Hence, different odors are partitioned and transported at different rates to olfactory receptor cells – leading to dif-ferent temporal signatures. This may even be further amplified by the expressing of different binding proteins within the olfac-tory epithelium.
While e-noses are becoming more common, the processing methods used to analyze and classify sensor data are generally time-invariant models. Statistical methods extract time indepen-dent features from the sensor signals, such as baseline (zero gas) and peak (analyte present) values or some simple parameter from them (difference, ratio, etc.). These static features are then passed into a pattern recognition algorithm, most commonly linear discriminant function analysis. Linear regression is then used to separate the groups of data and classify the results. Al-ternatively, nonlinear but still static methods such as artificial neural networks are used to classify these static features.
While these processing methods have proved to be sufficient for traditional e-nose devices, the new architecture of the e-mu-cosa provides novel data sets unlike those encountered in the
930 IEEE SENSORS JOURNAL, VOL. 9, NO. 8, AUGUST 2009
Fig. 2. Photograph of the embodiment of the artificial olfactory mucosa with 40 sensors distributed along a meandering coated channel [6].
Fig. 3. Sensor arrangement in the artificial olfactory mucosa [6].
field before – even when considering time-series approaches ap-plied to conventional e-noses. Thus, we require new approaches to data processing and information extraction within an artificial olfactory mucosa.
The artificial olfactory mucosa (Fig. 2), or e-mucosa, is a cur-rent example of this kind of novel device [6]. In summary, this device is a coated column with sensors placed at intervals along its length. The distribution and number of these sensors deter-mine the performance of the device. Fig. 3 illustrates the sensor arrangement in the artificial olfactory mucosa. The basic device shown here contains ten sensor tunings (s1 to s10) repeated four times (A to D).
The data produced by this device are now more information rich, containing information relating to both the spatially sepa-rated data from different sensors (classical sensor-based e-nose) and temporal differences between identical sensors at different locations (GC-like system). This novel spatio-temporal data set has been analyzed by treating the domains independently and treating them as individual features for the pattern recognition stage of processing. However, information relating to the rela-tionship between these two domains is lost. A novel method of processing is required to fully utilize the information contained within these novel data.
This paper explores a simplified subsystem of the e-mucosa, employing one sensor array at the start of the channel, and a second set at the end of the channel. This simplified e-mucosa, or perhaps a kind of “tandem electronic nose,” considerably re-duces the dimensionality of the problem to solve. The aim is then to apply novel convolution and signal combination tech-niques to this the signal generated and thereby improve classifi-cation by low-cost instruments in the field of artificial olfaction.
II. PROCESSINGMETHODS
The statistical processing of data is carried out in several stages. First, a signal preprocessing stage is used to prepare the data for processing. This can involve normalizing and/or fil-tering the data. The functions carried out here should be con-sidered carefully, as the quality of some aspects of the data will be improved while others are diminished. For example, normal-ization will make each set of data directly comparable; however weak signals dominated by noise will have their relative noise magnified greatly.
Features are then extracted from the data sets. The aim of this process is to determine a parameter that can be used to dif-ferentiate between the data from one input source and another. Multiple features can be extracted. This adds to the possibility of good discrimination, but also adds extra dimensionality to the data and the potential of redundancy in the data. This paper will only be considering single-feature processing methods.
The feature set is processed using a method that organizes data for pattern discrimination or classification. Various robust statistical methods for this process exist [7]. In the field of arti-ficial olfaction, principle components analysis and discriminant function analysis are commonly used [8], [9]. These functions present high-dimensional data sets in a manner so that there is maximum variance in a minimum number of dimensions.
Classification is the final step in the processing procedure. This is done statistically, utilizing methods such as linear met-rics and nearest neighbor linkage.
[image:3.594.39.287.287.576.2]A. Preprocessing (Normalization)
Since the magnitude of the sensor output can vary greatly, it is important to normalize each sensor’s raw data ( , where is the sensor index) so that one sensor can be compared to another in an unbiased manner. However, any noise on small signals will be amplified greatly and must be carefully considered.
Two normalization schemes were used, signed auto-scaling and auto-ranging. Auto-scaling takes the data and scales the magnitude linearly so that all data points lie between 0 and 1, and is signed to preserve the direction of the magnitude
(1)
Auto-ranging scales the data in a linear manner so that the range of the data is 1. The advantage here is to preserve any swing that may occur in more advanced problems, as multiple odors may cause sensors to respond in both directions
(2)
These normalized data were passed to the feature extraction stage, along with unmodified raw data for comparison and benchmarking
(3)
B. Feature Extraction
In order to extract features from the two sensor arrays high-lighted in Fig. 3, and , the normalized signals from these arrays must be combined. Each sensor output from is com-bined via a function with the equivalent sensor in . Different combinatorial functions will generate different characteristic signals. Convolution is often used in signal processing for combining and identifying similarities between signals [10]. An example of this kind of characteristic signal is shown in Fig. 4(b)
(4)
The product of the two data arrays can also form a charac-teristic signal. To preserve magnitude, a signed root product is used. Fig. 4(c) illustrated an example of this characteristic signal
(5)
The third characteristic signal considered is a simple differ-ence between two signals. The resulting characteristic signal is illustrated is Fig. 4(d)
(6)
In order to be used in the main processing step, a feature needs to be chosen and extracted from these characteristic signals. The area under the curve was chosen, as this feature contains infor-mation on the shape of the signal. Combination signals obtain
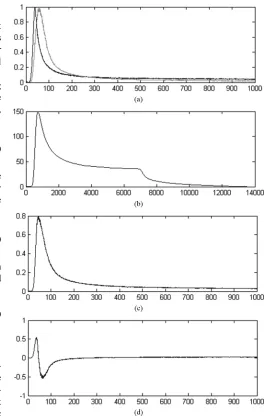
Fig. 4. (a) Normalized response from two sensors, S1A and S1B, in the sim-ulated artificial olfactory mucosa [11] to a 25 s pulse of toluene vapor in air. (b) Characteristic signal generated by the convolution of the two sensor re-sponses. (c) Characteristic signal generated by the signed root-product of the two sensor responses. (d) Characteristic signal generated by the difference of the two sensor responses.
their shape from the shape of the constituent signals, with varia-tions in the shape of the source signals altering the overall shape, and thus area, of the combined signal.
As the e-mucosa incorporates concepts of other traditional e-nose devices, these can also be extracted from the same data set and provide a point of comparison. For these devices, a suit-able feature needed to be chosen for extraction and use in the main processing step. Peak magnitude was selected due to its prevalent use within standard e-nose devices [1]–[3]. Both an e-nose ( ) and an advanced form of z-nose™ (an e-nose pre-ceded by a GC column) ( ) were extracted and processed, so both classes of device could be considered as comparison
[image:4.594.288.552.64.484.2]932 IEEE SENSORS JOURNAL, VOL. 9, NO. 8, AUGUST 2009
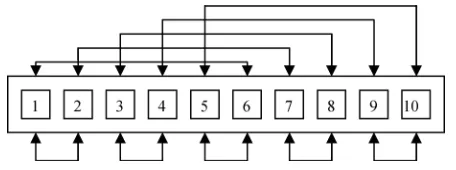
Fig. 5. Example of ten cross-convolution pairs available (from a possible 45) for a ten sensor array.
The final feature extraction considered is referred to as cross-convolution. Whereas the convolution method already presented convolutes two identical sensors in different arrays, cross-con-volution convolutes two different sensors in the same array. This process was applied to both and , and the area under the curve was extracted as the feature for future processing
(9)
(10)
where and are different sensor indices. This process creates a large number of possible convolution pairs, some examples of which are illustrated in Fig. 5. The rapidly increasing compu-tational cost as the number of sensors rises, and the addition of redundant noise make it impractical and undesirable to use all these possible convolutions in data processing. Thus, a subset of convolutions is chosen for the processing stage.
C. Data Processing
Once a feature array has been established from the feature extraction process, it is entered into a principle components analysis (PCA). This process establishes principle components along which variance of the data is maximized.
The first 2 or 3 principle components are then used to gen-erate a data plot. From the degree of separation observed in this plot and variance information obtained from the principle com-ponent analysis, the different processing methods can be easily compared.
III. SIMULATION
Utilizing data simulated during the development of the e-mucosa [6], [11], which simulated a 5 s pulse of three analytes (ethanol, toluene, and a 50/50 mixture of the two) passing through the system. The microchannel simulated has a cross-sectional geometry of 0.5 mm 0.5 mm and a length of 2.3 m, and was coated with parylene as the stationary phase. Forty sensors, in four groups of ten different tunings, were placed along the microchannel, as shown in Fig. 3. These sim-ulations were carried out in commercial software, MATLAB using a finite-element model [11].
This simulation would be used to determine strengths and weaknesses of the processing methods outlined previously. In order to provide a meaningful test, noise needed to be added to the e-mucosa simulation data. An e-nose system is subject to many kinds of noise, ranging from environmental factors,
variations in analyte concentration, variations in sensor sensi-tivity, changes in the sensors over time and poisoning of the sen-sors. These major noise sources were considered as part of three major categories of noise.
A. Additive Noise Signal-to-Noise Ratio (SNR)
Additive noise represents primarily background noise sources – sensor noise, background environmental factors and taints in the environment. This noise source was modeled as white Gaussian noise, with zero mean and a variance based on a per-centage of the sensor’s peak magnitude
(11)
where is the final noisy signal, the simulation signal and the noise signal
(12)
where is the noise value, and is a number series gener-ated by MATLAB’s random number generation function with a mean of 0 and variance of 1.
B. Sample Variance (SV)
Sample variance (SV) focuses on factors directly affecting the response of the sensors – sensor variation and sample variation. This noise source was modeled as a Gaussian value with a mean of 1 and a variance expressed as a percentage
(13)
where is the final noisy signal, the simulation signal, and the noise value
(14)
where is the noise value and is a number generated by MATLAB’s random number generation function with a mean of 0 and variance of 1.
C. Baseline Drift (BD)
Baseline drift (BD) is a major problem in e-nose systems. This represents variations in the sensor’s baseline, as a result of age, poisoning, and temperature. This noise source was modeled as a Gaussian value with a mean of 0 and a variance based on a percentage of the sensor’s peak magnitude
(15)
where is the final noisy signal, the simulation signal, and is the noise value
(16)
where is the noise value, and is a number generated by MATLAB’s random number generation function with a mean of 0 and variance of 1.
Fig. 6. PCA plot of 5 s pulses of ethanol, toluene, and a 50/50 mixture of the two, processed using auto-scaled sensor responses. Simulation noise: 5% sample variance. (a) e-mucosa, convolution characteristic signal feature. (b) Traditional e-nose, peak magnitude feature. (c) GC-coupled e-nose, cross-convolution feature.
The e-mucosa data set was replicated 20 times with each of these noise sources and the noise value set to 5%, producing
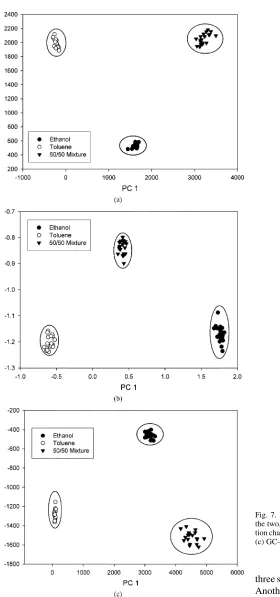
Fig. 7. PCA plot of 25 s pulses of ethanol, toluene, and a 50/50 mixture of the two, processed using auto-scaled sensor responses. (a) e-mucosa, convolu-tion characteristic signal feature. (b) Tradiconvolu-tional e-nose, peak magnitude feature. (c) GC-coupled e-nose, cross-convolution feature.
three sets of 20 samples, each set having one noise source added. Another three data sets, also of 20 samples each, were produced with binary combinations of noise sources ( ,
, ).
[image:6.594.325.527.72.560.2]934 IEEE SENSORS JOURNAL, VOL. 9, NO. 8, AUGUST 2009
TABLE I
t-SCORESBETWEENEACHPAIR OFANALYTEGROUPS(ETHANOL-TOLUENE, ETHANOL-50/50 MIX, TOLUENE-50/50 MIX) WITHRESPECT TO THE
FIRSTTWOPRINCIPLECOMPONENTS OF APRINCIPLECOMPONENTANALYSIS,FOREACH OF THESEVENFEATUREPROCESSINGMETHODS
DESCRIBED INSECTIONII USING ANAUTO-SCALINGNORMALIZATIONMETHOD
IV. SIMULATIONRESULTS
Each processing result was plotted with the first two principle components, examples of which can be seen in Fig. 6.
-scores between each pair of analytes were calculated for the first two principle components using a separate variance -test in Unistat 5.5 software. Table I provides a summary of results for the differing processing methods when using auto-scaling normalization.
Overall, our results showed that auto-scaling was the prefer-able normalization method. In the presence of significant sample variance and SNR noise, the e-mucosa and a con-volution or product characteristic signal showed a marked improvement over the traditional e-nose systems, obtaining a higher -score over the two principle component dimensions. However, these same methods show a weakness to very large amounts of baseline drift in the systemduringthe measurement period. This is actually unlikely as the measurement period is short (minutes) compared with conventional e-noses that need sensor stable over weeks or months. The difference signal per-formed poorly overall, although was superior to the convolution and product methods in the presence of baseline drift.
Cross-convolution performed well in all cases, showing improvement for sample variance and SNR noise sources (al-though not as much as the e-mucosa), and little to no weakness to baseline drift.
V. EXPERIMENTALDATA
A limited selection of experimental data was available from a prototype e-mucosa system [6]. This data set contains five repeats of data for ethanol, toluene, and a 50/50 mixture of the two at each of five different pulse lengths: 1, 5, 10, 25, and 50 s. While a small sample, attempts were made to analyze these data.
Based on the simulation results, the data were normalized using auto-scaling. The data were then processed using each of the seven processing methods. Fig. 7 illustrates some of the PCA results.
As expected from such a small sample, the results were of limited value. However, it can still be seen that convolution and cross-convolution processing produced PCA plots where the group crossover was significantly reduced.
VI. CONCLUSION
These results show that characteristic signals, such as those produced through combinatorial functions (such as convolution, product and difference) are suitable for use in a data processing and pattern recognition system. The performance of classifica-tion systems using these signals was comparable, or better, than a traditional data processing methodology for a classic e-nose device.
However, while being highly resistant to additive SNR noise and sample variance, this system showed a weakness to baseline drift in sensor outputs. The common mode effect and high noise estimate of 5% has significantly overestimated this problem, as sensors are unlikely to drift by such a large amount in the period of seconds or minutes that such tests would normally be carried out for a time-series approach. For example, 2.4% drift per day for a classical e-nose is only 0.01% for a 6 min e-mucosa sample time.
Finally, our experimental results on simple odors (ethanol and toluene) indicate that using convolution-based methods can pro-vide an improved image for classification, and work utilizing larger data sets will be presented in a separate article. The work extends to more interesting odors, such as essential oils and more complex odors, and ultimately tackling the odor segmen-tation problem.
REFERENCES
[1] J. W. Gardner and P. N. Bartlett, Electronic Noses: Principles and Ap-plications. Oxford, U.K.: Oxford Univ. Press, 1999.
[2] M. A. Ryanet al., “Monitoring space shuttle air quality using the jet propulsion laboratory electronic nose,”IEEE Sensors J., vol. 4, no. 3, pp. 337–347, Jun. 2004.
[3] R. C. Young, W. J. Buttner, B. R. Linnell, and R. Ramesham, “Elec-tronic nose for space program applications,”Sens. Actuators B, vol. 93, pp. 7–16, 2003.
[4] M. M. Mozell and M. Jagodowicz, “Chromatographic separation of odorants by the nose: Retention times measured acrossin vivoolfactory mucosa,”Science, vol. 181, pp. 1247–1249, 1973.
[5] P. Vroon, Smell: The Secret Seducer. New York: Strauss and Giroux, 1997, p. 28.
[6] S. L. Tan, “Smart Chemical Sensing: Towards a Nose-on-a-Chip,” Ph.D. dissertation, Univ. Warwick, School of Engineering, Coventry, U.K., 2005.
[7] R. Gutiérrez-Osuna, “Pattern analysis for machine olfaction: A review,”
IEEE Sensors J., vol. 2, no. 3, pp. 189–201, Jun. 2002.
[8] A. Perera, T. Yamanaka, A. Gutiérrez-Gálvez, B. Raman, and R. Gutiérrez-Osuna, “A dimensionality-reduction technique inspired by receptor convergence in the olfactory system,”Sens. Actuators B, vol. 116, pp. 17–22, 2006.
[9] M. Bicego, G. Tessari, G. Tecchiolli, and M. Bettinelli, “A comparative analysis of basic pattern recognition techniques for the development of small size electronic nose,”Sens. Actuators B, vol. 85, pp. 137–144, 2002.
[10] I. I. Hirschman and D. V. Widdler, The Convolution Trans-form. Princeton, NJ: Princeton Univ. Press, 1955.
[11] S. L. Tan, J. A. Covington, J. W. Gardner, and T. C. Pearce, “Finite ele-ment simulation of a biomimetic olfactory microsystem for spatio-tem-poral signal generation,” AsiaSim 2007 Springer, 2007, pp. 216–226.
Julian W. Gardner (M’90–SM’02). received the B.Sc. degree from Birmimgham University, Birmingham, U.K., in 1979, the Ph.D. degree from Cambridge University, Cambridge, U.K., in 1982, and the D.Sc. degree from Warwick University, Coventry, U.K., in 1997.
He is a Professor of Electronic Engineering in the School of Engineering, Warwick University. He is also Head of the Sensors Research Laboratory and Director of the Centre for Cognitive and Neural Sys-tems. He is Series Editor for a book series by Wiley-VCH. He has worked with over 20 companies in the past 15 years developing commercial e-nose instruments and a consultant for various companies. He is author or coauthor of over 400 technical papers and patents, as well as six tech-nical books in the area of microsensors and machine olfaction. His research interests include the modeling of silicon microsensors, chemical sensor array devices, biomimetic MEMS devices, and electronic noses.
Prof. Gardner was awarded the J. J. Thomson Medal for Outstanding Achievement in Electronics by the Institute of Engineering and Technology in 2007. He was elected a Fellow of the Royal Academy of Engineering in 2006 and is a Fellow of the IEE. He has served on many advisory panels on sensors, e.g., for EPSRC, DTI, and the IEE Professional Network on Microsystems and Nanotechnology.
James E. Taylorreceived the M.Eng. degree in elec-tronic engineering from the University of Warwick, Coventry, U.K., in 2005. He is currently working to-wards the Ph.D. degree in engineering at the Univer-sity of Warwick.
![Fig. 2. Photograph of the embodiment of the artificial olfactory mucosa with40 sensors distributed along a meandering coated channel [6].](https://thumb-us.123doks.com/thumbv2/123dok_us/9716409.472627/3.594.39.287.287.576/photograph-embodiment-articial-olfactory-sensors-distributed-meandering-channel.webp)