University of Twente
Master Thesis
Final Project
Fair Machine Learning
Author:
Jordy
Michorius
Supervisor 1:
Djoerd
Hiemstra
Supervisor 2:
Kevin
Macnish
Supervisor 3:
Victor
de Graaff
Contents
Acknowledgements 3
Abstract 3
1 Introduction 4
1.1 Problem Statement . . . 4
1.2 Word Definitions . . . 5
1.3 Research Questions . . . 6
2 Related Work 7 3 Existance of a bias 9 3.1 Data Analysis . . . 9
3.2 Classifier and learning a bias . . . 10
3.3 Dropping the banned feature . . . 11
4 Approach for reducing biases 14 4.1 Formula for bias reduction . . . 14
4.2 Approach . . . 15
5 Methodology 16 5.1 Datasets . . . 16
5.1.1 Titanic Dataset . . . 16
5.1.2 Financial Survey . . . 16
5.2 Preparation of data . . . 16
5.3 Selecting the banned feature and justification of the choice . . . . 17
5.3.1 Morally relevant vs morally irrelevant . . . 18
5.3.2 Correcting the wrongs in society . . . 18
5.3.3 Banned feature for each dataset . . . 18
5.4 Bias Reduction . . . 18
5.5 Performance of modified classifier . . . 19
6 Results 21 6.1 Titanic Dataset . . . 21
6.1.1 Amount of Flagged Features . . . 21
6.1.2 Top 5 Safe Features and Top 5 Flagged Features . . . 21
6.1.3 Accuracy of Classifier . . . 22
6.1.4 Fairness of Classifier . . . 23
6.2 Financial Survey . . . 24
6.2.1 Amount of Flagged Features . . . 24
6.2.2 Top 5 Safe Features and Top 5 Flagged Features . . . 24
6.2.3 Accuracy of Classifier . . . 26
7 Conclusion 28
7.1 How many features are flagged by using the proposed formula? . 28 7.2 What are the top 5 safe features and the top 5 flagged features? . 28 7.3 How does removing these flagged features from the training set
affect the accuracy of their classifier? . . . 29 7.4 Has the classifier now become more fair? . . . 29
Acknowledgements
I would like to thank Victor for proposing the usage of the KS-test for the bias reduction.
Abstract
In this research an approach for bias reduction, while still maintaining usability of the classifier, is proposed.
The approach for bias reduction requires all preprocessing to be done, include one-hot encoding and making the training and test set split. The approach then requires a banned feature, a feature that has for example been deemed morally irrelevant for the classification purpose. For the bias reduction, the proposal is to use the KS-score obtained from the two sample KS-test to determine how well a feature contributes to classification and how well it contributes to the bias of the banned feature. So that means that all features present in the dataset that are not the label(L) or the banned feature(B), that the following holds for feature X to be safe to use in the training dataset:
KS–score(X|L= 1, X|L= 0)> KS–score(X|B= 1, X|B= 0)
After all features are checked, the unsafe (or flagged) features need to be re-moved from both the training and the test set in order to make the classifier as fair as possible.
1
Introduction
1.1
Problem Statement
Big data is everywhere, businesses are collecting all sorts of data on their cus-tomers and their employees. Some data may be harmless, while other data may have significant impact on our lives. This impact can be the result of the em-ployment of classification algorithms to our person.
What this means is that businesses will use the collected data, to predict what will be most profitable. Should we hire either this person or that person? Should we market more towards children? If so, what would be the best prod-uct to produce? This may be considered nice and good for the company, but the classification algorithms used have severe drawbacks that can result in some (undesired) consequences.
In Weapons of Math Destruction[17], Cathy O’Neil goes into detail about how these classification algorithms (classifiers) begin to impact our lives. O’Neil mentions three properties of classifiers that make them into a weapon of math destruction:
• Damage, these classifiers can harm a person’s life(e.g. unemployment) • Scale, these classifiers are applied on a large scale and thus are able to
affect a lot of people.
• Transparency, is something these classifiers usually lack, there is no ex-planation for why the classifier made a certain decision.
Furthermore, it is possible that a classifier is trained on its own output, even if it is not known if its output is true or not. Making the classifier seem more like a self-fulfilling prophecy. This will in term create a classifier that will only pick those that match the classifier’s own narrow requirements.
This would in theory be considered ideal, because you have a machine doing the work for you. But in reality it can have disastrous consequences.
Let’s say for example a classifier is used to hire someone for a company. So every applicant will have their r´esum´e filtered through the classifier and based on that the classifier will make a list of appropriate candidates. Now let’s say there are 4 women and 2 men applying for the job that is available. And the classifier has found as a requirement that being male makes you more suitable for the job. That would mean that the classifier would (only) list the men as potential candidates. Thus almost instantly rejecting the 4 women that have applied.
contains a bias then they will learn said bias. In the job application example, it is clear that the classifier has a bias towards men, and thus given them an (perhaps unintended) advantage.
1.2
Word Definitions
In this subsection the definition of the words used later on will be given. This is done in order to reduce ambiguousness of words.
• Feature - A feature is a column in a dataset that contains values for each entry.
• Label - A label is a feature in a dataset that represents the classification of all entries.
• Classifier - A trained machine learning algorithm that can classify entries based on the input.
• Banned Feature - A feature that defines a bias, which should be removed from the dataset. For example, this could be someone’s gender.
• Policy - An intended nudging of the classifier which results in an intended advantage for certain entries in a dataset.
• Bias - An unwanted nudging of the classifier which results in a unfair advantages for certain entries in a dataset.
• Classification - The classifier predicting labels for the given input, a test set, based on the training set the classifier has been trained on.
• Biased Classifier - A classifier that has an existing bias in it, that results in unfair advantages for some entries.
• Flagged Feature/Value - A feature/value that is correlated to the banned feature and is not significant for classification. (It strengthens the bias more than it helps classification)
1.3
Research Questions
Now that the words have a clear definition, the research questions can now be formalised.
The research questions have been defined as the following:
1. How many features are flagged by using the proposed formula?
2. What are the top 5 safe features and the top 5 flagged features?
3. How does removing these flagged features from the training set affect the accuracy of their classifier?
2
Related Work
In the work of Char et al.[3], contains a description of why a bias may form a problem for machine learning in the health care sector. They describe the use of a biased classifier, as either unwanted or wanted. Unwanted as unintentional sneaked in, such as a racial bias. But also wanted biases, in order to for example increase profit.
The research of Liu et al.[12] focus on the delayed effect of making a bank-ing machine learnbank-ing algorithm fair. They define three end results: long-term improvement, stagnation and decline. With their fairness criteria as equal selec-tion rate and equal true positive rate, they have determined that the three end results are all possible outcomes. They also conclude that sometimes more back-ground data is required, which correspond to context sensitive machine learning.
In the article made by Ohm [16], we get an idea of how biases may be in-corporated into datasets. He argues that the anonymization is inherently linked to usefulness, the less anonymity is in the data the more useful it is. He also states that datasets can be combined to get less anonymized data. It may also be the case that combining dataset may result in biases, as more information is combined.
In The ethics of algorithms: Mapping the debate by Mittelstadt et al.[15] reasons for bias existence are given. These reasons are split in to categories, either unintentional or intentional. The unintentional inclusion of a bias can be due to requirements for which it is the best/most efficient option to program it that way. However the intentional inclusion may be the result of human prej-udice being intentionally incorporated in these programs. It also specifies that unfair results will lead to discrimination of certain groups using the program.
The research of Meschi and Scervini[14] shows that education per country is highly dependent on the country. It displays that especially regarding young people, there is an inequality in education, when comparing people from differ-ent countries. This may be considered a hidden bias when comparing people from different countries, when they are for example applying for a loan.
The research conducted by Leamerab et al.[10] shows that certain countries have a bigger economic inequality than others. These countries have relatively more poor people than the countries with less economic inequality. Therefore one could conclude that if you are born in these inequality countries, you are more likely to be poor. This can also be considered a hidden bias the same as with the education, meaning that if you are choosing someone, there may be a bias towards certain birth countries and thus becoming unfair.
• User-centric data ownership and management • Transparency of the algorithm and accountability • Living labs to experiment data-driven policies
However this research will not focus on these conditions or imposing them but on reducing biases in datasets to reduce the bias in classifiers.
In this chapter by Berendt and Preibusch[1], they propose Discrimination-Aware Data Mining(DADM) to combat discrimination in data. They have cre-ated a tool that will determine if data used in calculation is biased or not. However they state that discrimination in itself is not as clear as it would be as they have simplified it in their given examples, in practise discrimination is more complex.
In the article written by Persico[19] a model is proposed that could find biases in systems. In the article they also makes a comparison between the trade-off for using non-biased versus biased classifiers. This comparison sug-gests that sometimes it is could be desirable to use a biased classifier. Their research focuses specifically on discrimination, whereas this research will focus on removing hidden biases from a dataset for a given banned feature.
In the book of Calders et al.[2], they mention that a bias may be contained in a data set and this may be due to three different types of problems that these biases are there.
• Labels are incorrect, so for example that would mean that due to humans doing the labelling a certain human bias slips into the dataset.
• Sampling is biased, due to the possibility of under-representation or over-representation of a certain group.
3
Existance of a bias
In order to do bias reduction, there first needs to be a proof that a dataset can be biased and that a classifier trained on this dataset learns this bias. To prove that a bias can actually exist in a dataset, data analysis will be conducted on a dataset. And to also show that a classifier learns this bias, a classifier will be trained on this dataset and it will be used to predict a test set and a modified version of this test set.
In this case the Titanic dataset[20] will be analysed, because it is a relatively small dataset. This should make it easier to check if it contains a bias and what an example of a banned feature would be.
First up any policy should be made explicit, as these will be nudging the results in a way that is desired. In the case of the Titanic, there was a policy on board: ”Women and children first”[4], meaning that women and children should have priority over adult men for getting into a lifeboat. Therefore the survival rate of women and children should be higher then adult men.
For the Titanic dataset the banned feature has been chosen to be the pas-senger class. The feature contains 3 values: 1,2,3, which represent the paspas-senger class of a entry. The passenger class has been chosen because it could repre-senting someone’s wealth.
3.1
Data Analysis
By assuming the passenger class is banned feature, an analysis can be done on the dataset. First the dataset needs to be modified, because it does not specify what is a child and what is not. The assumption has been made that people that are 16 years or older are considered adults. Therefore an additional column needs to be inserted into the dataset, which tells if a person is a woman and/or a child or not. Some entries in the dataset do not have an age, these entries are considered adults.
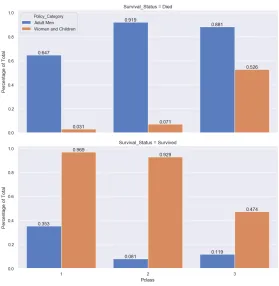
Figure 1: Survival rate per passenger class, split based on children and women and adult men
It can be seen that there is imbalance between survival rates of passenger classes. This imbalance is more prominent with the women and children then it is with the men, e.g. more women and children survive in passenger class 1 compared to passenger class 3. Nevertheless, both are affected by the passenger class, which means that the passenger class does influence the survival rate and thus making the dataset contain a bias.
3.2
Classifier and learning a bias
But now the question is, will the classifier also learn this bias? As mentioned before a classifier will be trained on a training set. This classifier will then be used to predict two test sets, one original and one modified version of the origi-nal. The difference between these two is that the modified test set only contains one passenger class, everyone in this test set has been upgraded to first class.
Figure 2: Comparison of survival rates of all passengers on the normal testset and on the modified testset, split between women and children and adult men
For adult men, the passenger class does not seem to influence their survival rate. However the survival spread shows that more women and children survive if they are in the first passenger class. Therefore it can be confirmed that a dataset can be biased and if a biased dataset is used to train a classifier than this classifier will learn that bias too.
3.3
Dropping the banned feature
Figure 3: Comparison of survival rates of all passengers, split between women and children and adult men
This can be seen in Figure 3, which shows the survival spread of both classi-fiers. There is no difference between the original and dropped dataset regarding adult men, the spread has stayed the same. However for women and children it has become slightly fairer, as passenger class 3 has more surviving women and children and passenger class 2 has slightly less compared to the original.
This spread does seem to indicate that there still is something influencing the outcome based on the passenger class, even though the passenger class has been removed and thus should no longer affect the outcome. This can be referred to as something called a hidden bias. Other features in the dataset may be correlated to the passenger class and while these feature not fully representing the passen-ger class, they can still influence the classification with their passenpassen-ger class bias.
Prime Free Day Delivery. According to Ingold and Soper[7], this Same-Day Delivery service was unavailable for some/most of the black residents’ ZIP codes in multiple cities. Amazon claims it does not take into account the racial features of a customer, but the authors beg to differ. Amazon does claim that they take the ZIP codes of their customers into consideration, which according to the article contributed to this racial bias.
4
Approach for reducing biases
Based on the Section 3, it can be assumed that if a classifier has a bias or is biased towards something, this results from the dataset that is used. As a dataset contains one or more biases, the suggestion for reducing biases would be to reduce the bias in a dataset.
As was already seen before in Figure 3, simply dropping the banned fea-ture may not be enough. Because what can be the case in these datasets is that some features are correlated to others. Meaning that while these features do not necessarily reflect the banned feature, they may still contribute to the banned feature’s bias. So what is required for the reduction of biases in dataset is at least a given banned feature, and based on this banned feature the proposed approach should find the banned feature’s correlated features.
However there may be a problem with removing all correlated features as it may make the classifier worse in terms of accuracy. Therefore only the cor-related features should be removed that are better at classifying entries as the banned feature than they are at classifying the label. These feature shall be called flagged features.
So in short what is required is a formula that if given a banned feature, it should tell if the other features in the dataset can be used or not. Whether a feature may be used or not, should be based on if they are better at classifying entries on the banned feature compared to classifying entries on the label.
This formula should be able to deal with binary and non binary features and it should be able to handle categorical and ordinal features. It is also assumed that this formula will only be applied to binary classification.
4.1
Formula for bias reduction
So with these requirements, the formula that should be able to calculate the classification contribution is the two sample Kolmogorov–Smirnov test[13], of which only the score (D-statistic)[8] is relevant for this bias reduction approach.
So the condition at which a feature X may be used is:
KS–score(X|L= 1, X|L= 0)> KS–score(X|B= 1, X|B= 0)
4.2
Approach
The following approach is being proposed in order to reduce the bias of a given banned feature in it’s dataset:
1. Preprocess the data, e.g. converting categorical features by using one-hot encoding.
2. Make the train test split, as doing this beforehand will not reveal any additional information from the test set when the KS-score is calculated.
3. For all features X in the training set, do the following:
(a) Calculate the KS-score for X and label L and the KS-score for X and banned feature B.
(b) Compare both scores to see if X is a flagged feature or a safe feature based on:
KS–score(X|L= 1, X|L= 0)> KS–score(X|B= 1, X|B= 0)
4. Remove all flagged features from the training and test set.
5
Methodology
Now that the idea for bias reduction has been introduced and explained, it is time to apply it to practical examples. These practical examples are the Titanic dataset and a Financial survey[22], both obtained from Kaggle. However before bias reduction can be applied, a dataset first needs to be processed in such a way that the classifier can interpret it. This means dropping columns that are of no use for the classifier, converting string to integers, etc. For the programming language Python[6] has been chosen, due to being used a lot for data analysis and thus having a lot of data analysis libraries available.
5.1
Datasets
5.1.1 Titanic Dataset
The Titanic dataset contains the information of passengers aboard of the Ti-tanic, for example it contains the name, age, sex and passenger class of a person. The classification of this dataset is done based on whether someone has survived or not. The Titanic dataset contains 891 entries and 10 features (excluding the label).
5.1.2 Financial Survey
This dataset was a survey held by the American government on people’s financial well-being[21]. While no classification purpose was specified, it is possible to do so. Namely the goal of this classification will be to predict if someone can always make ends meet at the end of the month. This means that only the person that can consistently make ends meet will be classified as label 1 and a person that does not classified as label 0. Furthermore the dataset contains 6394 entries and 215 features (excluding the label).
5.2
Preparation of data
By following the approach proposed in Section 4.2, the first thing to do is to preprocess the data. That means in order to use a dataset, modifications need to be made to the existing dataset.
The Titanic dataset contains missing values, that need to be filled. These missing values are present in the following features: Age, Cabin and Embarked. How these values are filled may influence the KS-score.
For the Cabin and Embarked features, it is assumed that the missing val-ues are categorical features. A missing value can therefore represent a new categorical value: ”Unknown”.
for an adult to have a unknown Age only 1 person dies, whereas for a child it means that 3 people need to die to have an unknown age. To also not make the missing values interfere with other ages, a value should be chosen that does not occur in the dataset and has a higher value then 16.
Therefore all missing values have been given value 999.
Furthermore both datasets contain features with too many unique values. These need to be dropped as these will not contribute to the classification in a significant way. This means that for the Titanic dataset the featuresNameand
Ticket are dropped and for the Financial survey only the feature finalwt has been dropped. Therefore the feature count has become 8 for the Titanic and 214 for the Financial survey.
Since aboard of the Titanic a policy was enforced, this policy of Women and children first should also become a feature in the dataset. So that means a featureWomanorchildwas added, and its value was based on if the person was female or younger than 16 years old. So this policy feature brings the feature count of the Titanic up to 9.
Furthermore all string values need to be converted to integer values due to the classifier only being able to use numbers. However this step can be combined with the one hot encoding process, to make the columns that are created retain their original value. The one-hot encoding should only be applied to non binary categorical features. What this means for the count of features is that Titanic dataset went from 9 features to 161 features and for the Financial survey the feature count was increased from 214 to 859 features. These resulting datasets are what will be referred to as the original datasets.
The final step of preprocessing the data before bias reduction is making a training and test set split. But instead of making a single train test split, 5-fold cross validation will be used. This should give a more accurate represen-tation of how well the classifier will perform. Creating the folds will be done using sklearn’s[18] StratifiedKFold[24], this should make each fold represent the dataset. Due to how the classifier is selected, 5-fold cross validation needs to be done twice; once for calculating the flagged features/values and once for the actual classification of the data. Therefore a random seed has been set(42), to ensure the same folds are created each time.
5.3
Selecting the banned feature and justification of the
choice
feature would require some ethical reasoning on why this specific feature should not be used.
5.3.1 Morally relevant vs morally irrelevant
One of the reasons for selecting a feature as the banned feature is that it is morally irrelevant[5]. So this means that for the classification task at hand, the banned feature is not morally relevant. For classifying candidates for a job application, an example of a morally relevant feature would be social interaction and a morally irrelevant feature would be the ability to play chess.
5.3.2 Correcting the wrongs in society
Another way of selecting a banned feature is selecting it to correct the wrongs in society. This means that the banned feature is something that is biased towards a particular group in society, and the desire is to remove this bias as much as possible from the dataset.
One example of this is wealth, as society suffers from inequality in wealth distribution[9]. As the inequality indicates it describes the (increasing) gap between the rich and the poor. By selecting wealth as a banned feature, the approach for bias reduction should make the classifier fairer e.g. the prediction spread of rich and poor is more levelled.
5.3.3 Banned feature for each dataset
For Titanic dataset, the banned feature will be the passenger class of a person. The passenger class could represent wealth, which as said before is a problem in society and thus selecting it would be an attempt to right the wrongs in society. But it can also be considered morally irrelevant, because money should lose its value in a life or death situation. The passenger class as mentioned in Section 3 contains 3 values: 1, 2, 3.
The banned feature for this dataset will be the race of a person. This choice is based upon the race not being morally relevant with making ends meet. The race of a person should not influence if a person can make ends meet or not, as making ends meet should be about a person’s financial management. The race contains 4 values: White, Black, Other, Hispanic.
5.4
Bias Reduction
This reduction can now be done with banned feature B. All of the features in the training set are checked if they are safe with the following condition:
KS–score(X|L= 1, X|L= 0)> KS–score(X|B= 1, X|B= 0)
Since both banned features are not binary, the one-hot encoded features need to be used. This means that for the Titanic the condition needs to be checked 3 times and for the Financial survey 4 times.
Since 5 fold cross validation is used, if a feature is flagged once, it is con-sidered flagged for all training and test sets create from the 5 folds. Flagged features will be removed from a copy of the original dataset in order to create a modified version of the original dataset.
Furthermore the KS scores can be used to calculated a score with which features can be ranked. This score would be the difference between the KS-score of X and L and the maximum value of the KS-KS-scores of X and B:
Ranking score=KS–score(X|L= 1, X|L= 0)−max(KS–score(X|B= 1, X|B = 0))
A positive Ranking score would indicate a safe feature and a negative score or a score with value equal 0.0 would indicate a flagged feature. Since 5 fold cross validation is used, the mean of the 5 calculated Ranking scores is taking to calculate the final score. If a feature has a score of 0.0 at least once in these 5 calculated Ranking scores, it will be assigned 0.0 instead as mean.
5.5
Performance of modified classifier
Now that the modified set have become fairer, a classifier can be trained. This is done by using the tpot[23] library, as it will try to find the most suitable classifier for the original dataset. For the Titanic dataset tpot has chosen a ExtraTreesClassifier[25] and for the Financial survey a RandomForestClassifier[26] has been chosen.
For each classifier, two version of this classifier will be trained: an original version which is trained on the original training set and a modified version which is trained on the modified training set. Both of these classifiers will then be used to predict their own version of the test set.
In order to see how the modified classifier compares to the original classi-fier, the accuracy of their predictions will be calculated and compared. This will tell how well the classifier can predict the test set based on the given training set.
has become overall. What can also be looked at is the relative fairness, so how fair has banned feature value B1 become compared to the other banned feature values.
6
Results
In this section the results obtained from Section 5 will be listed per dataset.
6.1
Titanic Dataset
6.1.1 Amount of Flagged Features
The Titanic dataset contains 161 features after one-hot encoding. 3 of these features represent the banned feature, the passenger class. That means 158 features are left to be checked.
By applying the approach, it has determined that 154 features are flagged and thus leaving the total amount of safe features at 4.
6.1.2 Top 5 Safe Features and Top 5 Flagged Features
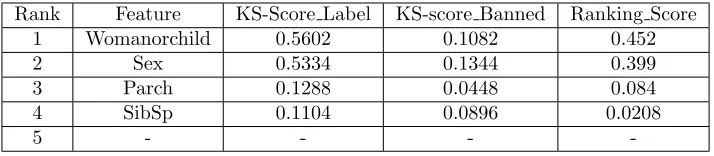
Rank Feature KS-Score Label KS-score Banned Ranking Score
1 Womanorchild 0.5602 0.1082 0.452
2 Sex 0.5334 0.1344 0.399
3 Parch 0.1288 0.0448 0.084
4 SibSp 0.1104 0.0896 0.0208
5 - - -
-Table 1: Top 5 Safe Features
In Table 1 the Top 5 Safe Features can be seen. The feature that indi-cates the policy, Womanorchild, is the most safe feature. What is interesting is that Sex influences the score the most, while the age cutoff at 16 years old only adding about~0.05 to the Ranking Score. Furthermore, it seems that the features indicating the amount of parents/children(Parch) and the amount of siblings/spouse(SibSp) on board also help classification better than helping the banned feature’s bias. The table also shows that there is no 5th Safe Feature.
Rank Feature KS-Score Label KS-score Banned Ranking Score
1 Fare 0.3042 0.8184 -0.5142
2 Cabin 999 0.2736 0.7734 -0.4998
3 Age 0.1036 0.2628 -0.1592
4 Embarked C 0.1352 0.270 -0.1348
5 Embarked Q 0.014 0.1324 -0.1184
Table 2: Top 5 Flagged Features
[image:22.612.133.490.314.392.2]Age feature is ranked at rank 3 and thus is contributing to the Passenger class bias, while combining the entries that are younger then 16 with adult women, resulted in an increase of the Ranking score for the policy. The table also shows that embarking on Cherbourg(Embarked C) and Queenstown(Embarked Q) will cause better classification for passenger class than for survival.
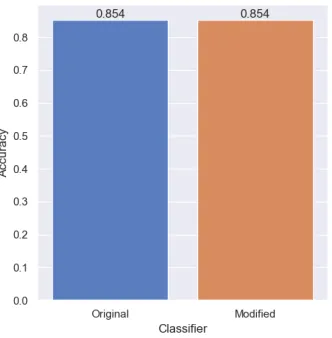
[image:23.612.223.388.232.403.2]6.1.3 Accuracy of Classifier
Figure 4: Comparison of the accuracy score of both classifiers
6.1.4 Fairness of Classifier
Figure 5: Comparison of survival rates of all passengers, split between women and children and adult men according to the two classifiers
Version Overall Fairness Passenger Class 1 Passenger Class 2 Passenger Class 3
Original 0.03642 0.15200 0.10000 0.08400
[image:25.612.135.535.124.164.2]Modified 0.00000 0.00000 0.00000 0.00000
Table 3: Titanic Fairness Adult Men
Version Overall Fairness Passenger Class 1 Passenger Class 2 Passenger Class 3
Original 0.23957 0.52300 0.55400 1.01500
[image:25.612.132.539.203.243.2]Modified 0.10242 0.22700 0.24800 0.43300
Table 4: Titanic Fairness Women and Children
Based on Table 3 and 4, both policy groups became much fairer when com-paring the modified version to the original. Both overall fairness and relative fairness received a lower score for the modified version compared to the origi-nal. The Adult men became completely fair, and the women and children came closer to becoming fair.
6.2
Financial Survey
6.2.1 Amount of Flagged Features
The Financial survey dataset contains 859 features after one-hot encoding. The banned feature, Race, contains 4 values and thus the banned feature is repre-sented by 4 features after one-hot encoding. So that means that the dataset contains 855 features which need to be evaluated.
By applying the formula, 612 features have been flagged. This leaves the dataset with 243 features that have been deemed safe to use.
6.2.2 Top 5 Safe Features and Top 5 Flagged Features
Rank Feature KS-Score Label KS-score Banned Ranking Score
1 FWBscore 0.6254 0.1606 0.4648
2 FWB2 1 11 0.5402 0.1342 0.406
3 FWB2 3 12 0.5186 0.1514 0.3672
4 FS1 7 53 0.3494 0.030 0.3194
5 FWB1 5 14 0.398 0.0788 0.3192
Table 5: Top 5 Safe Features
1AnsweredNever to the statement”Giving a gift...would put a strain on my finances for
the month”
Table 5 contains the top 5 safe features. What is notable is that out of the 5 features listed in the table only one originally was a feature. TheFWBscore
is the Financial well-being scale score, which indicates how well someone does financially. The other features indicate that if the answers given in the survey are positive in regards to financial well-being, that these answers would predict if someone is making ends meet. What is interesting about scores is that these features are more closer to each other compared to the scores in Table 1.
Rank Feature KS-Score Label KS-score Banned Ranking Score
1 PCTLT200FPL 05 0.0696 0.3216 -0.252
2 PPREG4 46 0.0038 0.2378 -0.234
3 HSLOC 17 0.0312 0.2408 -0.2096
4 PPREG9 98 0.0164 0.2172 -0.2008
[image:26.612.132.510.229.307.2]5 PPREG4 39 0.0174 0.2088 -0.1914
Table 6: Top 5 Flagged Features
The ranking of the top 5 flagged features is displayed in Table 6. In this table all of the features ranked are actually answers given to questions in the Financial survey. What is interesting is that 4 of these features have to do with the location of a person. Regarding the scores these are even closer, than those in the Table 5.
5AnsweredLess than 40% of county population below 200% of poverty levelto the
state-ment for”County pct less than 200% of poverty level (ACS 2015 5-year SF)”
6AnsweredWest to the question for”Census Region in the US”
7AnsweredU.S. and territories to the question”Where did you live at age 17?” 8AnsweredPacific to the question for”Census Division in the US”
6.2.3 Accuracy of Classifier
[image:27.612.223.389.182.351.2]Unlike the Titanic classifier, the financial classifier retained the same accuracy according to Figure 6.
Figure 6: Comparison of the accuracy score of both classifiers
6.2.4 Fairness of Classifier
Figure 7: Comparison of always making ends meet of all people according to the two classifiers
In Figure 7 the classifier had his spread changed. It seems that Black,
[image:27.612.135.486.437.585.2]Version Overall Fairness White Black Other Hispanic Original 0.04892 0.29900 0.16700 0.16700 0.22500 Modified 0.04791 0.30100 0.15500 0.15500 0.21900
Table 7: Financial survey Fairness
This is also what Table 7 shows. The overall fairness and most of the relative fairness go down, which means that the classifier has become fairer. However only forWhitethe relative fairness score increased with 0.002, which means that
7
Conclusion
Based on the results of Section 6, the research questions can now be answered.
7.1
How many features are flagged by using the proposed
formula?
The Titanic dataset had 158 features before bias reduction excluding the label and the banned features. After doing bias reduction the dataset has been re-duced to 4 features and thus 154 features have been flagged due to being related to the banned feature, the passenger class. That means that~97% of the origi-nal dataset’s features have been removed.
For the Financial survey the amount of safe features is 243. This means that of the 855 features contained within the original Financial survey dataset, excluding the label and the banned features, 612 features have been flagged as being related to the race feature, which is~72%.
[image:29.612.203.406.396.480.2]7.2
What are the top 5 safe features and the top 5 flagged
features?
Table 8: Top 5 Safe Features Rank Titanic Dataset Financial Survey
1 Womanorchild FWBscore
2 Sex FWB2 1 1
3 Parch FWB2 3 1
4 SibSp FS1 7 5
5 - FWB1 5 1
In Table 8 can be seen what the top 5 safe features are for the Titanic dataset and the Financial survey. For the Titanic the policy is the safest feature and for the finanical survey the FWBscore is the safest feature. For Titanic dataset there is no 5th ranked feature, only 4 features have been deemed safe to use.
Table 9: Top 5 Flagged Features Rank Titanic Dataset Financial Survey
1 Fare PCTLT200FPL 0
2 Cabin 999 PPREG4 4
3 Age HSLOC 1
4 Embarked Q PPREG9 9 5 Embarked C PPREG4 3
[image:29.612.202.409.558.642.2]Cabin seem to strongly indicate what passenger class these entries belong to, and for the Financial survey the top 5 flagged features mostly contain location based question answers.
7.3
How does removing these flagged features from the
training set affect the accuracy of their classifier?
The Titanic’s modified classifier dropped in accuracy, as can be seen in Figure 4. But the accuracy of the Financial classifier stayed the same, as was seen in Figure 6.
This would mean that by applying this bias reduction approach, the classifier can keep the same accuracy or become less accurate compared to the original.
7.4
Has the classifier now become more fair?
8
Future Work
Now that has been proven that the proposed bias reduction works for at least two datasets, some further research is required.
First up is looking into how to apply the bias reduction approach to multi-label classification. Mean that instead of looking at binary multi-labels, 0 and 1, one will look at multiple labels, 1,2,3..., to see how the KS score can be applied to this.
Secondly a research could look into the possibility of combining categorical data. In some cases it may be so that the original category is not acceptable, but if values are combined these values may be used. So for example, a category ”Species” contains the species of an entry. Values would look like: pigeon, cat, mouse, human, sparrow, dog. Suppose human andcat are flagged, that means these values may not be used. But if the ”Species” category would have been split into mammals and birds, it could be possible that both mammals and birds features are safe to use. So basically this is looking into combining values of a categorical feature to create safe features.
References
[1] B. Berendt and S. Preibusch. Better decision support through exploratory discrimination-aware data mining: foundations and empirical evidence. Ar-tificial Intelligence and Law, 22(2):175–209, June 2014.
[2] T. Calders and I. ˇZliobait˙e. Why unbiased computational processes can lead to discriminative decision procedures. InDiscrimination and Privacy in the Information Society, pages 43–57. Springer, 2013.
[3] D. S. Char, N. H. Shah, and D. Magnus. Implementing machine learning in health care — addressing ethical challenges. New England Journal of Medicine, 378(11):981–983, 2018. PMID: 29539284.
[4] T. de Castella. Costa concordia: The rules of evacuating a ship. http: //www.bbc.com/news/magazine-16576289. ”Last Accessed: 2018-2-15”.
[5] D. C. Emmons. Moral relevance. Ethics, 77(3):224–228, 1967.
[6] P. S. Foundation. Official python website. https://www.python.org/. ”Last Accessed: 2018-7-12”.
[7] D. Ingold and S. Soper. Amazon Doesn’t Consider the Race of Its Customers. Should It? https://www.bloomberg.com/graphics/ 2016-amazon-same-day/. ”Last Accessed: 2018-2-15”.
[8] T. W. Kirkman. Kolmogorov-smirnov test. https://web.archive. org/web/20180118063805/http://www.physics.csbsju.edu:
80/stats/KS-test.html, 1996. ”Last Accessed: 2018-8-2”.
[9] T. Koechlin. The rich get richer. Challenge (05775132), 56(2):5 – 30, 2013.
[10] E. E. Leamerab, H. Maula, S. oRodrigueza, and P. K. Schott. Does natural resource abundance increase latin american income inequality? Journal of Development Economics, 59(1):3–42, June 1999.
[11] B. Lepri, J. Staiano, D. Sangokoya, E. Letouz´e, and N. Oliver.The Tyranny of Data? The Bright and Dark Sides of Data-Driven Decision-Making for Social Good, pages 3–24. Springer International Publishing, 2017.
[12] L. T. Liu, S. Dean, E. Rolf, M. Simchowitz, and M. Hardt. Delayed impact of fair machine learning. arXiv preprint arXiv:1803.04383, 2018.
[13] S. Massa. Lecture 13: Kolmogorov smirnov test & power of tests. https://web.archive.org/web/20171215144618/http://www. stats.ox.ac.uk/~massa/Lecture%2013.pdf, February 2016. ”Slide 5, Last Accessed: 2018-8-2”.
[15] B. D. Mittelstadt, P. Allo, M. Taddeo, S. Wachter, and L. Floridi. The ethics of algorithms: Mapping the debate. Big Data & Society, 3(2):2053951716679679, 2016.
[16] P. Ohm. Broken promises of privacy: Responding to the surprising failure of anonymization. Ucla L. Rev., 57:1701, 2009.
[17] C. O’Neil. Weapons of Math Destruction : How Big Data Increases In-equality and Threatens Democracy. Crown Random House, first edition, 2016.
[18] F. Pedregosa, G. Varoquaux, A. Gramfort, V. Michel, B. Thirion, O. Grisel, M. Blondel, P. Prettenhofer, R. Weiss, V. Dubourg, J. Vanderplas, A. Pas-sos, D. Cournapeau, M. Brucher, M. Perrot, and E. Duchesnay. Scikit-learn: Machine learning in Python.Journal of Machine Learning Research, 12:2825–2830, 2011. http://scikit-learn.org/stable/index.html.
[19] N. Persico. Racial profiling? detecting bias using statistical evidence.Annu. Rev. Econ., 1(1):229–254, 2009.
[20] Kaggle Inc. Titanic dataset.https://www.kaggle.com/c/titanic. ”Last Accessed: 2017-12-06”.
[21] Consumer Financial Protection Bureau. Description of the financial survey. https://s3.amazonaws.com/files.consumerfinance.gov/f/ documents/cfpb_nfwbs-puf-codebook.pdf. ”Last Accessed: 2018-7-17”.
[22] Consumer Financial Protection Bureau. Financial well-being survey data. https://www.kaggle.com/anthonyku1031/nfwbs-puf-2016-data. ”Last Accessed: 2018-7-20”.
[23] Epistasis Lab at University of Pennsylvania. TPOT. https://github. com/EpistasisLab/tpot. ”Last Accessed: 2018-2-15”.
[24] scikit-learn developers. sklearn method for stratifiedkfold. http: //scikit-learn.org/stable/modules/generated/sklearn.model_ selection.StratifiedKFold.html. ”Last Accessed: 2018-8-1”.
[25] scikit-learn developers. sklearn’s extratreesclassifier. http: //scikit-learn.org/stable/modules/generated/sklearn.ensemble. ExtraTreesClassifier.html. ”Last Accessed: 2018-8-1”.