University of Warwick institutional repository: http://go.warwick.ac.uk/wrap
This paper is made available online in accordance with
publisher policies. Please scroll down to view the document
itself. Please refer to the repository record for this item and our
policy information available from the repository home page for
further information.
To see the final version of this paper please visit the publisher’s website.
Access to the published version may require a subscription.
Author(s): Nathan S. Barrow, Jonathan R. Yates, Steven A. Feller,
Diane Holland, Sharon E. Ashbrook, Paul Hodgkinson and Steven P.
Brown
Article Title: Towards homonuclear J solid-state NMR correlation
experiments for half-integer quadrupolar nuclei: experimental and
simulated 11B MAS spin-echo dephasing and calculated 2JBB
coupling constants for lithium diborate
Year of publication: 2011
Link to published article:
CREATED USING THE RSC ARTICLE TEMPLATE (VER. 3.1) - SEE WWW.RSC.ORG/ELECTRONICFILES FOR DETAILS
ARTICLE TYPE www.rsc.org/xxxxxx | XXXXXXXX
Towards homonuclear
J
solid-state NMR correlation experiments for
half-integer quadrupolar nuclei: experimental and simulated
11
B MAS
spin-echo dephasing and calculated
2
J
BB
coupling constants for lithium
diborate
Nathan S. Barrow,
aJonathan R. Yates,
bSteven A. Feller,
cDiane Holland,
aSharon E. Ashbrook,
dPaul
5Hodgkinson
eand Steven P. Brown*
aReceived (in XXX, XXX) Xth XXXXXXXXX 201X, Accepted Xth XXXXXXXXX 201X First published on the web Xth XXXXXXXXX 201X
DOI: 10.1039/b000000x
Magic-angle spinning (MAS) NMR spin-echo dephasing is systematically investigated for the spin
10
I= 3/211B nucleus in lithium diborate, Li2O.2B2O3. A clear dependence on the quadrupolar frequency ( PAS
Q
/2= 3CQ/[4I(2I– 1)]) is observed: the B3 (largerCQ) site dephases more slowly than the B4 site at all investigated MAS frequencies (5 to 20 kHz) at 14.1 T. Increasing the MAS frequency leads to markedly slower dephasing for the B3 site, while there is a much less evident effect for the B4 site. Considering samples at 5, 25, 80 (natural abundance) and 100 %11B isotopic
15
abundance, dephasing becomes faster for both sites as the11B isotopic abundance increases. The experimental behaviour is rationalised using density matrix simulations for two and three dipolar-coupled11B nuclei. The experimentally observed slower dephasing for the largerCQ(B3) site is reproduced in all simulations and is explained by the reintroduction of the dipolar coupling by the so-called “spontaneous quadrupolar-driven recoupling mechanism” having a different dependence
20
on the MAS frequency for different quadrupolar frequencies. Specifically, isolated spin-pair simulations show that the spontaneous quadrupolar-driven recoupling mechanism is most efficient when the quadrupolar frequency is equal to twice the MAS frequency. While for isolated spin-pair simulations, increasing the MAS frequency leads to faster dephasing, agreement with experiment is observed for three-spin simulations which additionally include the homogeneous nature of the
25
homonuclear dipolar coupling network. First-principles calculations, using the GIPAW approach, of the2J11B-11Bcouplings in lithium diborate, metaborate and triborate are presented: a clear trend is revealed whereby the2J11B-11Bcouplings increase with increasing B-O-B bond angle and B-B distance. However, the calculated2J11B-11Bcouplings are small (0.95, 1.20 and 2.65 Hz in lithium diborate), thus explaining why no zero crossing due toJmodulation is observed experimentally,
30
even for the sample at 25 %11B where significant spin-echo intensity remains out to durations of ~200 ms.
Introduction
Solid-state magic-angle-spinning (MAS) NMR experiments,
35
that use J couplings to establish two-dimensional through-bond homonuclear correlations, e.g., TOBSY,1-2 refocused
INADEQUATE,3-5 and double-quantum (DQ) filtered- or
sensitive absorptive refocused (SAR)- COSY6-7 are being increasingly widely utilised for spin I = 1/2 nuclei, e.g.,13C,
40
15
N, 19F, 29Si, and 31P. Spectra have been presented for a variety of organic and inorganic systems, e.g., celluloses,3,8 phosphates,9-10a C60fullerene,
11
molecules exhibiting NH…N hydrogen bonding,12-13a surfactant-templated silicate layers,14 and a fluorinated hydroxy-silicate.15
45
While approximately two-thirds of all NMR-active nuclei are quadrupolar (I ≥ 1), there are very few examples of
solid-state NMR experiments that utilise, observe or probe J
couplings between two half-integer quadrupolar nuclei.16
Specifically, splittings due to 1J11B-11B, 1
J11B-14N and 1
J
55Mn-50
55Mn couplings have been observed in MQMAS spectra,17
while heteronuclear27Al-17O spectra have been presented for experiments that rely on 1J17O-27Al couplings for coherence transfer,18-19 and the 2J17O-17O coupling in
17
O-labelled glycine.HCl has been determined from MAS spin-echo
55
experiments.20 To the best of our knowledge, there are no published examples of two-dimensional MAS homonuclearJ
correlation experiments for quadrupolar nuclei. It is to be noted, however, that through-space dipolar couplings between
quadrupolar nuclei have been used to establish
two-60
dimensional homonuclear correlations, e.g., spin-diffusion exchange experiments or double-quantum or higher multiple-quantum (MQ) experiments.21-22
This paper sets out to determine whether J homonuclear
correlation experiments are feasible for half-integer
65
quadrupolar nucleus, 11B (I = 3/2), in the model polycrystalline compound, lithium diborate, Li2O.2B2O3.
11 B is an important nucleus for solid-state NMR applications to materials science with MAS as well as high-resolution methods such dynamic-angle spinning (DAS), double rotation
5
(DOR) and MQ MAS experiments and 2D exchange and heteronuclear experiments having been performed for, e.g., vitreous B2O3,23-26 borate and borosilicate glasses,27-30 including potential hosts for nuclear waste immobilisation, 31-32
BN and BCN ceramics and precursors,33-35 organoboron
10
compounds36-38and boranes of interest for hydrogen storage.39 Edén and Frydman have previously shown how the interplay of dipolar and quadrupolar interactions affect 11B lineshapes40 and two-dimensional 11B-11B spin-diffusion experiments.41For two dipolar-coupled spinI= 1/2 nuclei, the
15
well-known rotational-resonance phenomena arise from the non-commutation (and hence incomplete refocusing under MAS) of the homonuclear dipolar coupling and the chemical shift anisotropy (CSA).42-43 In analogy to this, Edén and Frydman have introduced the term “spontaneous
quadrupolar-20
driven recoupling” for the incomplete removal by MAS of the homonuclear dipolar coupling between two quadrupolar (I > 1/2) nuclei that arises from the non-commutation of the dipolar and quadrupolar couplings. This analysis builds upon work by Gan and Robyr44and Facey et al.45for the case of a
25
dipolar coupling between two2H (spinI= 1) nuclei.
Specifically, Edén and Frydman have shown by simulation and experiment that the central-transition linewidth can depend on the MAS frequency, and can even be observed to increase as the MAS frequency is increased (see Fig. 3 of
30
Ref.40 for 7Li (spinI = 3/2) NMR of Li2SO4, LiOH.H2O and Li2C2O4and 79Br (spin I = 3/2) NMR of KBr). Facey et al. have shown that line broadening is also observed in2H (spinI
= 1) MAS NMR spectra of strongly dipolar coupled deuterium pairs in transition metal dihydrides.45 (Note that for the case
35
of an isolated half-integer quadrupolar nucleus experiencing only the quadrupolar interaction, the linewidth is independent of the MAS frequency.) Defining the quadrupolar frequency46 as PAS
Q
= 3CQ/[2I(2I– 1)], i.e., QPAS/2=CQ/4 forI= 3/2,
maximum experimental line broadening in the 7Li MAS
40
spectra presented in Fig. 3 of Ref.40is observed when PAS Q /r ~ 2. (Note that Edén and Frydman use a parameterisation in terms ofQ= 2CQ/[2I(2I– 1)], i.e.,Q= (2/3) QPAS, hence
Ref.40 states that the maximum line broadening is observed whenQ/r= 1.2-1.3.)
45
This lineshape broadening due to quadrupolar-driven
recoupling is most pronounced for two coupled nuclei with identical isotropic chemical shifts (e.g., see Fig. 6 of Ref.40). This is analogous ton= 0 rotational-resonance as observed in spinI= 1/2 MAS experiments for the case where two
dipolar-50
coupled nuclei have the same isotropic chemical shifts.47-50 The simulations in Ref.40 also show a dependence on the relative orientation of the three tensors (the quadrupolar tensors for the two spins and the internuclear vector that defines the dipolar coupling), with an enhanced effect for a
55
mutually perpendicular arrangement. Note that a quadrupolar-driven recoupling effect is observed for the case of parallel quadrupolar tensors (that are not colinear with the dipolar
coupling); this is different to the spin I = 1/2n=0 rotational resonance effect, where no effect is observed if the two CSA
60
tensors are parallel.42-43
In this study, the effect of11B-11B dipolar couplings on11B
spin-echo dephasing is investigated using samples of
polycrystalline lithium diborate, Li2O.2B2O3, with three different degrees of 11B depletion/enrichment: 5%, 25% and
65
100%. (At natural abundance, 80% of boron nuclei are 11B, with the remainder (20%) being 10B.). The experimental results are complemented by two- and three-spin density-matrix simulations and first-principles calculations of the2J
BB couplings.
70
Experimental and computational details
Synthesis of lithium diborate samples
Polycrystalline lithium diborate, Li2O.2B2O3, at natural abundance in 11B was prepared by mixing together 4.369 g of lithium carbonate (Alfa Aesar #013418, 99 %) and 8.233 g of
75
boron oxide (Alfa Aesar #089964, 99.98 %). After agitating the mixture to ensure homogeneity, the reactants were transferred to a platinum-rhodium crucible and placed in a normal-atmosphere electric furnace at 100C. The temperature was ramped at 5C/ min for 3 h to 1000 C. This temperature was chosen as it is
80
above the congruent melting temperature of lithium diborate (917
2C).51After 20 min at 1000C, the melt was poured onto a room-temperature steel plate.
Li2CO3+ 2B2O3 Li2O.2B2O3+ CO2
85
Polycrystalline lithium diborate samples with varying degrees of11B depletion/enrichment were prepared by mixing lithium carbonate (Sigma-Aldrich #255823, 99 %), boric-10B
acid (Sigma-Aldrich #426156, 99%) and boric-11B acid
90
(EaglePicher #Bl-EV-95-10, 99.3%) in the correct
stoichiometric ratio: for 100%11B, 3.651 g11B(OH)3& 1.087 g Li2CO3; for 25%11B, 1.486 g11B(OH)3, 4.388 g10B(OH)3& 1.771 g Li2CO3; for 5%
11
B, 0.299 g 11B(OH)3, 5.584 g 10B(OH)
3 & 1.779 g Li2CO3. The reagents were thoroughly
95
mixed in a gold (5%)-platinium crucible and placed in a normal-atmosphere electric furnace at 1000C. After 15 min, the crucible was removed and weight-loss measurements were performed to check that the expected reaction had occurred. The crucible was returned to the furnace at the higher
100
temperature of 1100 °C to decrease the viscosity of the melt before pouring. After 5 min, the melt was poured onto a room-temperature steel plate and allowed to crystallise.
Li2CO3+ 4B(OH)3 Li2O.2B2O3+ CO2+ 6H2O
105
For all samples, crystallinity and phase purity were checked by Raman spectroscopy and powder X-ray diffraction (see Fig. S1 in the ESI).
Solid-state NMR experiments 110
11
using a 3.2 mm probe.11B chemical shifts were referenced to the primary reference, boron trifluoride diethyl etherate, BF2.Et2O,52using sodium borohydride, NaBH4, (42.06 ppm) as a secondary reference.53
Spin-echo experiments were performed using a 90 /2
5
180 /2 tacqpulse sequence, where the /2 durations are an integer number of rotor periods. Except where otherwise stated, the central-transition selective 90 and 180 pulses were of duration 12.5 and 25s, respectively. The selection of the +1 to 1 coherence-transfer pathway was achieved by a
10
16-step phase cycle that selectedp=1 (4 steps) andp=
2 (4 steps) on the 90 and 180 pulses, respectively. The application of the pulse sequence was preceded by a pulse comb, consisting of thirty-three 90pulses of duration 2.1s separated by free-precession periods of 11 s, followed by a
15
relaxation delay of 32 s.
For all spin-echo experiments, the magic angle was set by
maximising the number of spinning sidebands in a 79Br
spectrum of KBr. This enables the angle to be set to within better than 0.1º of the magic angle.54 While more accurate
20
setting of the magic angle can be achieved, that is important for, e.g., satellite-transition (ST) MAS experiments55-56or the observation of very-narrow13C CP MAS resonances,57this is sufficient to avoid noticeable effects on spin-echo dephasing times due to changes in satellite transition rotational
25
resonance conditions58 or the introduction of residual dipolar couplings.59-60
The spin-echo intensities were obtained by taking, after Fourier transformation, integrals over the chemical shift
range: 20 to 6 ppm for the B3 site and 6 to −3 ppm for the B4 30
site. Integration is necessary to ensure that, for the case of modulation by a J coupling, only in-phase lineshapes with a cosine spin-echo () modulation are considered, i.e., there is no contribution from anti-phase lineshapes which have a sine spin-echo () modulation. The first recorded integrated
spin-35
echo intensity, corresponding to one rotor period, was normalised to one. Errors on the fitted parameters are determined from the covariance matrix, as described in Ref. 61.
Density-matrix simulations 40
Spin-echo dephasing curves were simulated using
pNMRsim.62 Evolution under the combined effect of the
dipolar coupling and the quadrupolar coupling (with zero asymmetry parameter) during the rotor-synchronised spin-echo periods was simulated explicitly in the density-matrix
45
formalism using the Liouville-von Neumann equation,63-66 starting with an initial state of x magnetisation on the two-coupled spins. (The ESI shows that second-order quadrupolar-dipolar and quadrupolar-CSA cross terms17,67-68are small, and they are thus not included in the simulations.) Evolution
50
during the 180 pulse was not explicitly considered, rather perfect +pto –p coherence transfer was simulated by simple exchange of density matrix elements. This ensures that the block diagonal nature of the density matrix is maintained throughout, allowing time-efficient simulation.63,69 The
55
resulting signal was read out by using a detection operator corresponding to central-transition single-quantum coherence
(p = 1). Powder averaging was performed over a total of 2400 different values of the,andangles according to the ZCW scheme.70-72 The details of the approach used for the
60
efficient simulation of spin-echo signals, together with a sample input file, are presented in the ESI.
First-principles calculation of2JBBcouplings
First-principles calculations were performed using the
65
CASTEP software package, which implements
density-functional theory using a plane-wave basis set and the pseudopotential approach, and is thus applicable to periodic systems. Magnetic resonance parameters were calculated using the GIPAW73-76approach which enables the calculation
70
of chemical shifts, electric field gradients and J couplings. Calculations were performed using the experimental X-ray diffraction crystal structure of lithium diborate (ICSD reference code: 65930), as well as geometry optimised (CASTEP) structures (both at X-ray diffraction and optimised
75
lattice parameters). The resulting NMR parameters were found to be rather similar – for example, the maximum change in the calculated isotropic J coupling on performing a full variable cell optimisation was 0.2 Hz for2J11-11Band 1 Hz for 1
J11B-17O. Calculated values reported in this article used the
80
experimental X-ray diffraction crystal structure. All
calculations used the Perdew-Burke-Ernzerhof (PBE)
implementation of the generalized gradient approximation to the exchange-correlation functional.77 Geometry optimisation used ultra-soft pseudopotentials,78and a plane-wave cut-off of
85
600 eV and a maximum k-point spacing of 0.1 Å–1.
Calculations of all NMR parameters used Trouiller-Martins norm-conserving pseudopotentials79with a plane-wave cut-off of 1000 eV and ak-point spacing of 0.1 Å–1. TheJcouplings are computed by considering one nucleus as a perturbation;
90
this breaks translational symmetry and for small primitive cells it can be necessary to multiply the size of the original crystal unit cell until the values of the couplings are converged. It was found that the primitive cell of lithium diborate was of sufficient size to give well converged J 95
coupling without needing to consider such a supercell. The calculation time for the J couplings was 4 hours on a
dual-quad core Intel E5540 (2.53 GHz) at the Oxford
Supercomputer Centre.
Experimental results
10011
B-11B dipolar couplings in lithium diborate
As shown in Fig. 1, crystalline lithium diborate exhibits superstructural diborate units.80Each diborate unit consists of two three-coordinated boron atoms and two four-coordinated
boron atoms. Boron−boron distances are presented in Table 1, 105
which also lists the corresponding homonuclear 11B-11B dipolar coupling constants,djk,
2 0
3
2
4
11B jk
jk
d
r
Fig. 1 Schematic representation of the diborate units in the crystal structure of lithium diborate.80Three- and four-coordinated boron atoms are shown in blue and green, respectively, while oxygen atoms are red. The labelling of boron and oxygen atoms as used in Tables 1 and 5, 5
respectively, is indicated.
The root-sum-squared dipolar coupling is defined (see eqns. 3 and 6 of Ref.81) as :
2
rss jk
j k
d
d
(2)where is the probability that a boron nucleus is the 11B
10
[image:5.595.47.283.58.229.2]isotope. For= 1, corresponding to 100%11B enrichment,drss equals 1.613 and 1.818 kHz for the B3 and B4 sites, respectively (considering boron atoms out to 10 Å).
Table 1Boron-boron distancesaand corresponding11B-11B dipolar coupling constants as determined for the crystal structure of lithium 15
diborate80
Nuclei Separation / Å djk/ Hz
B4(1)–B4(2) 2.36 −937 B3(1)–B4(1) 2.44 −848 B4(2)–B3(2) 2.44 −848 B3(1)–B4(2) 2.49 −801 B4(1)–B3(2) 2.49 −801 B3’(1)–B4(2) 2.50 −791 B4(1)–B3’(2) 2.50 −791 B3(1)–B3(2) 3.58 −269
aBracketed numbers are used to differentiate between different boron
atoms in the same superstructural diborate group (see Fig. 1). B4-B4 and B4-B3 distances up to 2.50 Å are listed, noting that each B3 has a B-O-B connectivity to a B4 in a different superstructural group and vice versa. 20
The shortest B3-B3 distance is tabulated.
In this paper, experimental data is presented for lithium diborate samples with four different degrees of 11B isotopic abundance (5%, 25%, 80% and 100%). Table 2 presents the
25
probabilities of a B3 11B nucleus having 0, 1, 2, or 3 11B neighbours and a B4 11B nucleus having 0, 1, 2, 3, or 4 11B neighbours for these 11B isotopic abundances. The reduced probability of11B-11B dipolar coupling for less than 100%11B
isotopic abundance is reflected in the √ scaling in eqn (2):
30
[image:5.595.298.544.85.175.2]For 5%, 25% and 80% (natural abundance)11B, the root-sum-squared dipolar couplings are reduced to 22% (= 0.05), 50% (= 0.25) and 89% (= 0.80) of the values stated above.
Table 2The probability of a three- and four- coordinate11B nucleus being connected (via B-O-B bonds) to a given number of11B nucleia
35
11B Site Zero One Two Three Four
5% B3 85.7% 13.5% 0.7% 0.0%
5% B4 81.5% 17.1% 1.4% 0.0% 0.0%
25% B3 42.2% 42.2% 14.1% 1.6%
25% B4 31.6% 42.2% 21.1% 4.7% 0.4%
80% B3 0.8% 9.6% 38.4% 51.2%
80% B4 0.2% 2.6% 15.4% 41.0% 41.0%
100% B3 - - - 100%
100% B4 - - - - 100%
a
Connectivity probabilities as for crystalline lithium diborate,80where each boron forms only B-O-B bonds to other boron atoms.
11
B MAS NMR spectra of lithium diborate
11
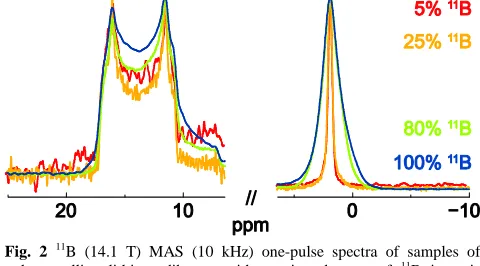
B (14.1 T) MAS (10 kHz) NMR spectra of the four polycrystalline lithium diborate samples with different
40
degrees of11B isotopic abundance are compared in Fig. 2. The narrow lineshape at ~2 ppm and the second-order quadrupolar broadened site centred at ~14 ppm are assigned to the B4 and B3 sites, respectively, for which the quadrupolar parameters areCQ= 0.5 MHz andQ= 0.5 (B4) andCQ= 2.60 MHz and
45
Q= 0.2 (B3).82-83Increasing11B isotopic abundance leads to a broadening of both resonances that is most evident for the B4 site that exhibits negligible second-order quadrupolar
broadening. This 11B isotopic abundance dependent
broadening is a consequence of MAS not fully averaging to
50
zero over one rotor period the evolution under multiple homonuclear dipolar couplings, with this being due to the non-commutation of the dipolar Hamiltonian with itself at different times42 this effect is well known in 1H MAS NMR.81,84-85For the B4 peak at ~2 ppm, it is evident that there
55
is not a smooth change in the linewidth upon increasing11B isotopic abundance, with the 5% and 25% vs. 80% and 100% linewidths being similar. We presume that this difference lies in the non-linear dependence of the local homonuclear coupling strength on the degree of 11B isotopic enrichment/
60
depletion: in the 5 and 25% samples, the probability of a B4 site having two or more direct 11B neighbours is less than 30%, while it is close to or equal to 100% for the 80 and 100% samples (see Table 2).
65
Fig. 2 11B (14.1 T) MAS (10 kHz) one-pulse spectra of samples of polycrystalline lithium diborate with varying degrees of 11B isotopic abundance: 5 % (red), 25 % (orange), 80 % (natural abundance, green) and 100 % (blue). 32, 24, 8 and 16 transients were coadded using recycle delays of at least 60 s and a small flip angle. The11B probe background 70
[image:5.595.43.270.446.544.2] [image:5.595.301.541.536.669.2]11B MAS NMR spin-echo dephasing curves for lithium
diborate
This section considers11B MAS NMR spin-echo experiments performed at 14.1 T for polycrystalline lithium diborate. At this magnetic field, the B3 and B4 lineshapes are resolved
5
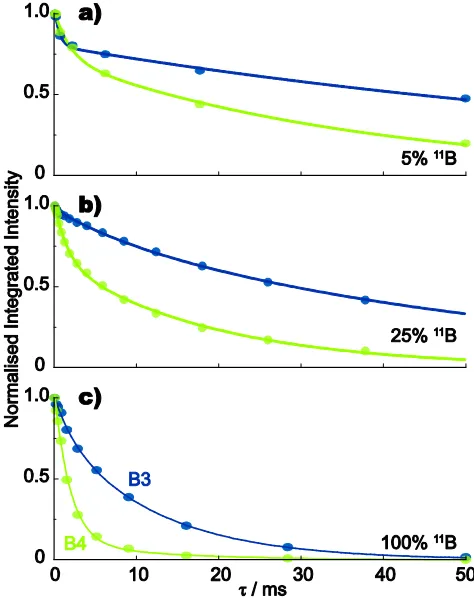
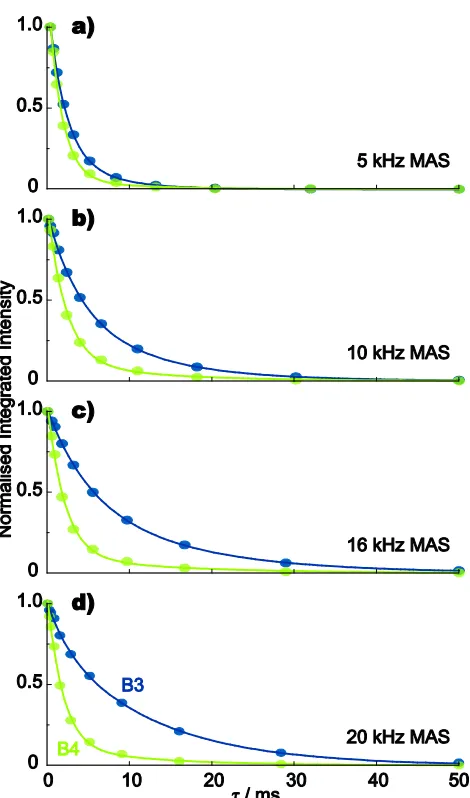
(see Fig. 2), such that separate dephasing behaviour can be determined for the B3 and B4 sites. Fig. 3 compares the spin-echo dephasing behaviour at 20 kHz MAS for samples with three different degrees of 11B isotopic abundance: 5%, 25% and 100%, while Fig. 4 compares the spin-echo dephasing
10
behaviour of the 100%11B sample at MAS frequencies of 5, 10, 16, and 20 kHz.
Tables 3 and 4 present best fits of the spin-echo data in Figs. 3 and 4, respectively. Specifically, it is found (see Fig. S2 in the ESI) that the data is better fit to a bi-exponential
15
function as compared to a mono-exponential function, i.e.,
2 2
/ /
( )
(
Ta(1
)
Tb)
S
A pe
p e
(3)where the parameter p corresponds to the proportion of the faster dephasing component (T2a <T2b ). In order to quantify 20
the observed trends in Figs. 3 & 4, Tables 3 and 4 list a composite T2[a b ]that is defined as:
2[a b] 2a (1 ) 2b
T pT p T (4)
It is to be emphasised that a bi-exponential fit is a phenomenological description of the underlying coherent spin
25
dynamics in the powder-averaged dipolar coupled multi-spin systems.81In this context, it is to be noted that quadrupolarT1 relaxation is also expected to be multi-exponential in the solid state,86 as discussed recently in the context of 17O (I = 5/2)
MAS exchange experiments.87 We also note that
bi-30
exponential relaxation (attributed to the central and satellite transitions) is observed in solution-state NMR of half-integer quadrupolar nuclei if there is restricted motion such that the motional correlation times are comparable to or larger than the inverse of the Larmor frequency.88-89
35
Table 3Fit parametersafor spin-echo dephasing curves for
polycrystalline lithium diborate with varying degrees of11B abundance (20 kHz MAS, see Fig. 3)
Site 11B A p
2a
T / ms T2b / ms T2[a b]/ ms B3 5% 1.04±0.02 0.23±0.02 0.6±0.1 92.7±6.6 71.5 B3 25% 0.98±0.01 0.11±0.02 7.8±2.1 51.8±1.6 47.0 B3 100% 1.02±0.01 0.20±0.05 2.2±0.7 12.1±0.7 10.1 B4 5% 1.02±0.02 0.29±0.04 1.9±0.6 37.2±4.2 27.0 B4 25% 1.03±0.01 0.35±0.02 1.6±0.1 19.0±0.7 12.9 B4 100% 1.07±0.02 0.90±0.07 1.9±0.2 12.4±9.9 3.0
aFit to the bi-exponential function in eqn (3), with 2[a b]
T defined in eqn 40
(4).
Considering the experimental spin-echo dephasing curves in Figs. 3 and 4 and the fits in Tables 3 and 4, the key observations are:
45
The B3 (largerCQ) site dephases more slowly than the B4 site (smallerCQ) at all investigated MAS frequencies.
Dephasing becomes faster for both B3 and B4 sites as the 11
B isotopic abundance increases.
Increasing the MAS frequency leads to markedly slower 50
dephasing for theB3site, while there is a muchless evident effectfor theB4site.
Fig. 311B (14.1 T) MAS (20 kHz) spin-echo (90 /2180 /2 55
tacq) dephasing curves for samples of polycrystalline lithium diborate with varying degrees of11B isotopic abundance: (a) 5%, (b) 25%, and (c) 100%. 640 (5%), 384 (25%) and 96 (100%) transients were coadded for each spin-echo duration,. For both B3 (blue) and B4 (green) sites in all samples, the signal-to-noise ratio for this first point was at least 100:1. 60
[image:6.595.311.548.166.465.2]Best fits to the bi-exponential function in eqn (3) are shown as solid lines (see Table 3).
Table 4Fit parametersafor spin-echo dephasing curves for polycrystalline lithium diborate with 100%11B abundance at varying MAS frequencies (see Fig. 4)
65
SiteMAS /
kHz A p T2a / ms T2b / ms T2[a b]/ ms B3 5 1.19±0.01 0.79±0.12 2.0±0.2 5.8±1.8 2.8 B3 10 1.04±0.01 0.53±0.19 3.8±0.8 10.3±2.1 6.9 B3 16 1.02±0.01 0.52±0.13 4.8±0.8 13.6±1.8 9.0 B3 20 1.02±0.01 0.20±0.02 2.2±0.7 12.1±0.7 10.1 B4 5 1.29±0.04 0.95±0.07 1.6±0.2 9.4±12.5 2.0 B4 10 1.11±0.02 0.88±0.10 2.2±0.3 11.4±8.7 3.3 B4 16 1.08±0.02 0.90±0.08 2.1±0.3 13.8±12.6 3.3 B4 20 1.07±0.02 0.90±0.07 1.9±0.2 12.4±9.9 3.0
aFit to the bi-exponential function in eqn (3), with 2[a b]
[image:6.595.309.551.585.682.2]Fig. 4 11B (14.1 T) spin-echo dephasing curves for a sample of polycrystalline lithium diborate with 100% 11B isotopic abundance, recorded at MAS frequencies of: (a) 5 kHz, (b) 10 kHz, (c) 16 kHz and (d) 20 kHz. 96 transients were coadded for each spin-echo duration,. For 5
both B3 (blue) and B4 (green) sites in all samples, the signal-to-noise ratio for this first point was at least 200:1. Best fits to the bi-exponential function in eqn (3) are shown as solid lines (see Table 4).
Simulations of spin-echo dephasing
With the aim of understanding the experimentally observed
10
phenomena, this section presents density-matrix simulations of spin-echo dephasing curves for, first, an isolated pair of dipolar-coupled11B nuclei and, second, an equilateral triangle arrangement of three dipolar-coupled11B nuclei. For the first case of two dipolar-coupled11B nuclei, the simulations show
15
the effect of changing the MAS frequency for the spontaneous quadrupolar-driven recoupling mechanism. The three-spin simulations provide insight into the actual experimental situation for 11B NMR of lithium diborate, where there is a competing effect of the non-commutation of multiple dipolar
20
couplings.
Simulations of isolated pairs of dipolar-coupled11B nuclei
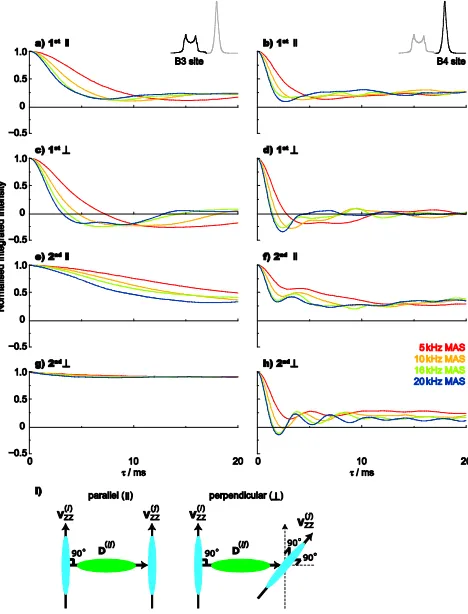
Fig. 5 presents simulated spin-echo dephasing curves at
different MAS frequencies (from 5 to 20 kHz) for pairs of dipolar-coupled11B nuclei, whereCQequals (a,c,e,g) 2.6 MHz
25
and (b,d,f,h) 0.5 MHz, as in the case of the B3 and B4 sites in lithium diborate, respectively. Simulations are presented for the consideration of the quadrupolar interaction as (a-d) a first- or (e-h) a second-order perturbation of the Zeeman Hamiltonian. In (a,b) and (e,f), the quadrupolar tensors for the
30
two spins were co-linear and perpendicular to the dipolar tensor (i.e., the internuclear vector), while in (c,d) and (g,h), the two quadupolar tensors were perpendicular with respect to each other and to the dipolar tensorthis is illustrated in Fig. 5i.
35
The following observations are apparent from a
consideration of the simulated spin-echo dephasing curves in Fig. 5. Comparing the simulations for different MAS frequencies, faster dephasing is observed upon increasing the MAS frequency from 5 to 20 kHz. This is the opposite trend
40
as compared to the above experimental behaviour – this is further considered below in the discussion of three-spin simulations. When comparing analagous simulations in Fig. 5, it is evident that faster dephasing is always observed for the B4 as compared to the B3 site. This latter observation is in
45
agreement with the experimental behaviour. (In addition, Fig. S6 in the ESI shows that increasing the dipolar coupling,djk, leads to a faster dephasing.)
The simulated spin-echo dephasing curves in Fig. 5 are different for the case of first- and second-order quadrupolar
50
interactions, with the differences being more pronounced for the larger-CQ B3 site, where there is evident second-order quadrupolar broadening of the11B MAS NMR lineshape (see Fig. 2). Specifically, for the B3 simulations (compare Fig. 5a & 5e and 5c & 5g), the dephasing is noticeably slower when
55
second-order quadrupolar effects are considered. In this context, we note that, for the case of first-order quadrupolar interactions, simulations including and omitting the spin-echo 180º pulse are identical. In other words, the spin-echo simulations are identical to simulations of the NMR signal due
60
to the evolution of transverse magnetisation as created in a one-pulse experiment. Thus, for first-order quadrupolar interactions, the spin-echo simulations will exactly reproduce the trends observed by Edén and Frydman for the case of11B MAS lineshapes.40 This observation is not surprising given
65
that the first-order quadrupolar Hamiltonian is bilinear in the spin operator,I, and is thus invariant under a 180º pulse. (The first-order quadrupolar coupling can be refocused in a quadrupolar echo experiment, 90x – – 90y – .
90-91 ) By contrast (as shown in Fig. S7), including the spin-echo 180º
70
pulse has a very marked effect when second-order
quadrupolar effects are considered, since otherwise the signal dephases rapidly under the influence of the anisotropic second-order quadrupolar broadening.
Given the difference between the B3 and B4 cases in Fig. 5,
75
it is informative to investigate further by simulation the effect of the magnitude of the quadrupolar interaction on the rate of spin-echo dephasing. As a measure of the degree of spin-echo dephasing, we use here the simulated spin-echo intensity at = 0.55 ms, where the first point (corresponding to= 0 ms) in
80
[image:7.595.48.283.56.455.2]faster dephasing corresponds to a smaller number, while no dephasing corresponds to a value of 1. Specifically, Fig. 6
plots the degree of spin-echo dephasing for different
quadrupolar coupling strengths at a MAS frequency of 20 kHz. Note that when PAS
Q
/2=CQ= 0, there is no dephasing
5
since MAS perfectly refocuses, over a complete rotor period, the evolution due to a dipolar coupling alone for the case of a pair of nuclei.
Fig. 5 Simulated (14.1 T) spin-echo dephasing curves for a pair of 10
dipolar-coupled (|djk| = 500 Hz) 11B nuclei with the same isotropic chemical shift, whereCQequals (a,c,e,g) 2.6 MHz (B3 site) and (b,d,f,h) 0.5 MHz (B4 site). Simulations were performed for MAS frequencies of 5 kHz (red), 10 kHz (orange), 16 kHz (green) and 20 kHz (blue) for evolution under (a-d) first- or (e-h) second-order quadrupolar interactions 15
(Q= 0). In (a,b) and (e,f), the quadrupolar tensors for the two spins were co-linear and perpendicular to the dipolar tensor (i.e., the internuclear vector), while in (c,d) and (g,h), the two quadrupolar tensors were perpendicular with respect to each other and to the dipolar tensor. (i) An illustration of parallel and perpendicular quadrupolar tensor arrangements 20
that shows the relative orientation of the largest magnitude component of the two electric field gradient tensors,Vzz, with each other and with the dipolar coupling tensor,D. For the perpendicular arrangement,Vzz(j)is out of the plane formed byVzz(i)and the dipolar coupling internuclear vector.
Fig. 6 shows four separate curves corresponding to the four
25
cases in Fig. 5, i.e., first- or second-order quadrupolar interaction and parallel or perpendicular quadrupolar tensors. For all four curves, fastest dephasing is observed when
PAS Q
/2is approximately equal to twice the MAS frequency. This corresponds to the same condition for observing
30
maximum line broadening in MAS spectra noted by Edén and
Frydman,40 where the mechanism of “spontaneous
quadrupolar-driven recoupling”, i.e., the incomplete removal by MAS of the homonuclear dipolar coupling between two
quadrupolar (I > 1/2) nuclei that arises from the
non-35
commutation of the dipolar and quadrupolar couplings, is most efficient. The observation that both maximum MAS line broadening and maximum spin-echo dephasing occur when
PAS Q
/2 is approximately equal to twice the MAS frequency is unsurprising, since, firstly, the small value of the
40
quadrupolar frequency for the observed dip corresponds to the case where second-order quadrupolar effects are negligible (note that the first- and second-order curves for the same arrangement of the quadrupolar tensors are overlayed in this region of the plot), and, secondly, it was noted above that
45
spin-echo simulations are identical, for first-order quadrupolar interactions, to simulations of the NMR signal due to the evolution of transverse magnetisation as created in a one-pulse experiment. Slightly faster dephasing is observed at this position of most efficient “spontaneous quadrupolar-driven
50
recoupling” for a perpendicular as compared to a parallel arrangement of the quadrupolar tensors – this trend is also apparent in Fig. 5 – with the same observation having been made by Edén and Frydman in the context of simulated MAS line broadening.40 For PAS
Q
/2 > 225 kHz (CQ > 900 kHz),
55
the consideration of the quadrupolar interaction to second-order causes a slower dephasing as compared to the case of considering only the first-order quadrupolar interaction. Note that the plot in Fig. 6 only goes out to PAS
Q
/2= 375 kHz (CQ = 1.5 MHz); at larger quadrupolar frequencies, the difference
60
becomes more evident (see the above discussion of the B3 case in Fig. 5).
Fig. 6The dependence of MAS (20 kHz, 14.1 T) spin-echo dephasing on 65
the quadrupolar coupling strength, QPAS/2(equal toCQ/4 forI= 3/2), simulated for a pair of dipolar-coupled (|djk| = 500 Hz)11B nuclei with the same isotropic chemical shift. The degree of spin-echo dephasing is determined as the simulated spin-echo intensity at= 0.55 ms: As such, a smaller value corresponds to faster dephasing, and a value of unity 70
corresponds to no dephasing. The four lines correspond to first-order quadrupolar interaction, parallel quadrupolar tensors (red); first-order quadrupolar interaction, perpendicular quadrupolar tensors (yellow); second-order quadrupolar interaction, parallel quadrupolar tensors (green); second-order quadrupolar interaction, perpendicular quadrupolar 75
tensors (blue).
Fig. 7 shows how the extent of spin-echo dephasing depends on the MAS frequency in simulations of isolated pairs of dipolar-coupled11B nuclei for four different values of the quadrupolar frequency and the case of second-order
80
quadrupolar interaction and perpendicular quadrupolar
tensors. (Fig. S8 in the ESI presents analagous plots for the first-order limit and/or perpendicular quadrupolar tensors.) Note that PAS
Q
/2= 130 kHz and 640 kHz correspond toCQ = 0.5 MHz and 2.6 MHz, respectively, i.e., theCQ values for
[image:8.595.56.290.154.461.2] [image:8.595.311.551.403.504.2]the B4 and B3 sites in lithium diborate. Considering the curves for PAS
Q
/2= 60 kHz (red) and 130 kHz (orange), it is evident, as noted above, that fastest dephasing is observed when the MAS frequency is approximately equal to half the
quadrupolar frequency, PAS
Q
/2. Remembering that the
5
fastest MAS frequencies currently experimentally feasible are less than 100 kHz, different behaviour for these simulations of isolated spin pairs is observed for small and large quadrupolar interactions. For sites with small quadrupolar interactions, as the MAS frequency, r, is increased, spin-echo dephasing
10
becomes faster until PAS Q
~ 2r, with the dephasing then becoming slower for further increases in the MAS frequency. For sites with large quadrupolar interactions, the isolated pair simulations show minimal dependence of the spin-echo dephasing on the MAS frequency (for currently
15
experimentally feasible MAS frequencies of less than 100 kHz).
Fig. 7The dependence of spin-echo dephasing on the MAS frequency, as simulated at 14.1 T for a pair of dipolar-coupled (|djk| = 500 Hz) 11B 20
nuclei with the same isotropic chemical shift. Four different values of the quadrupolar frequency,QPAS/2(equalsCQ/4 forI= 3/2) are considered. The plots are for the case of second-order quadrupolar interaction and perpendicular quadrupolar tensors. The degree of spin-echo dephasing is determined as the simulated spin-echo intensity at= 0.55 ms.
25
Simulations of three dipolar-coupled11B nuclei
For spin-echo MAS NMR of homonuclear dipolar-coupled networks of spinI= 1/2 nuclei, it is known that the spin-echo linewidth decreases (i.e., slower dephasing) as the MAS frequency increases, e.g., see Fig. 2 of Ref.81 and Fig. 5 of
30
Ref.16 for 1H and 31P spin-echo MAS NMR experiments,
respectively. To achieve a realistic modelling of the
experimental results, it is necessary to consider a model
system that additionally takes into account the
non-commutation of multiple dipolar couplings. Fig. 8, thus,
35
presents simulated spin-echo dephasing curves for an
equilateral triangle arrangement of three dipolar-coupled 11B nuclei for MAS frequencies of 5 and 20 kHz. The simulations are for the case of second-order quadrupolar interactions, with the quadrupolar tensors for the three spins co-linear and
40
perpendicular to the internuclear vectors that define the dipolar couplings.
A first observation is that faster dephasing is observed for the smaller-CQ B4 site at both MAS frequencies, with the same observation having been made for the isolated spin-pair
45
simulations presented above. Different behaviour as compared to the isolated spin-pair simulations is observed, however, when considering the effect of increasing the MAS frequency. For the larger-CQ B3 site, slower dephasing is evident at 20
kHz MAS as compared to 5 kHz MAS. This is the opposite
50
trend as compared to the isolated spin-pair simulations in Figs. 5 and 7, but is in agreement with the experimental results in Fig. 4 and Table 4. For the smaller-CQB4 site, the dephasing is similar at 20 kHz MAS as compared to 5 kHz MAS, with this distinction between the B3 and B4 site
55
behaviour again matching the experimental results.
Fig. 8Simulated (14.1 T) spin-echo dephasing curves for an equilateral triangle arrangement of three dipolar-coupled (|djk| = 354 Hz for each pair 60
of11B nuclei, such thatd
rss= 500 Hz)11B nuclei with the same isotropic chemical shift, whereCQequals 2.6 MHz (blue line, B3 site) or 0.5 MHz (green line, B4 site). Simulations were performed for MAS frequencies of 5 kHz (top) and 20 kHz (bottom) for evolution under second-order quadrupolar interactions (Q= 0), where the quadrupolar tensors for the 65
three spins were co-linear and perpendicular to the plane of the dipolar tensors (i.e., the internuclear vectors).
Comparison of experiment and simulation
Experimentally, for 11B spin-echo MAS NMR of
polycrystalline lithium diborate with 100% 11B abundance
70
(Fig. 4 and Table 4), it is observed that increasing the MAS frequency leads to markedly slower dephasing for the B3 site, while there is a much less evident effect for the B4 site. While the isolated spin-pair simulations in Fig. 5 show faster dephasing as the MAS frequency is increased, the three-spin
75
simulations in Fig. 8 show that slower dephasing is observed for the B3 site as the MAS frequency is increased, with the rate of dephasing for the B4 site varying little as the MAS frequency changes. The three-spin simulations are, thus, in agreement with experiment, i.e., as expected, the three-spin
80
system is the more realistic model of the experimental situation.
There are thus two competing effects that explain the observed dependence of the spin-echo dephasing rate on the MAS frequency. On the one hand, there is the spontaneous
85
[image:9.595.40.284.73.371.2]dipolar and quadrupolar couplings. As shown in the isolated
spin-pair simulations, spontaneous quadrupolar-driven
recoupling is associated with faster dephasing as the MAS frequency is decreased (for the case here where PAS
Q /2 is bigger than the fastest MAS frequency). On the other hand,
5
considering only homonuclear dipolar couplings, increasing the MAS frequency will lead to slower dephasing. The different experimental effect for the B3 and B4 sites in lithium diborate is explained by the different sensitivity of the spontaneous quadrupolar-driven recoupling mechanism to the
10
MAS frequency for sites with different quadrupolar couplings. (Note that the root-sum-squared dipolar couplings, drss, are similar for the B3 (1.613 kHz) and B4 (1.818 kHz) sites.) Specifically, the simulations in Fig. 7 showed that there is a more pronounced effect associated with changing the MAS
15
frequency (in the range 5 to 20 kHz) for the case of the B4 site with the smaller quadrupolar coupling. Thus, for the B4 site, where the experimental dephasing rate shows no marked dependence on the MAS frequency, it seems that the two competing effects cancel each other out. By comparison, for
20
the B3 site, the influence of homonuclear dipolar couplings dominates, and slower experimental dephasing is observed as the MAS frequency is increased. This differing behaviour is reproduced in the three-spin simulations that take into account
both the spontaneous quadrupolar-driven recoupling
25
mechanism and the effect of non-commuting homonuclear dipolar couplings.
For 11B spin-echo MAS NMR of crystalline lithium
diborate, faster dephasing is always observed, for the considered MAS frequencies of 5 to 20 kHz, for the B4 site
30
that has the smaller quadrupolar coupling. The same
behaviour is observed in two- and three-spin simulations (compare the yellow and green lines in Fig. 7 that correspond to the CQ values for the B4 and B3 sites, respectively, in lithium diborate, as well as Fig. 8) and can only be explained
35
by the spontaneous quadrupolar-driven recoupling
mechanism.
Experimentally, it is observed that11B spin-echo dephasing times increase as the percentage of11B decreases (see Fig. 3 and Table 3), as is to be expected due to the decrease in the
40
effect of the homonuclear dipolar couplings, as quantified by thedependence of the root-sum-squared dipolar couplings,
drss, in eqn (2). It is to be noted that the longest dephasing times of ~12 ms for23Na (100% natural abundance) NMR of
Na2SO458 and 27Al (100% natural abundance) NMR of
45
CaAl2O7 18
and AlPO4berlinite 92
reported in the literature are of the same duration as the longest dephasing time obtained from fits in this paper for lithium diborate at 100 % 11B abundance sample (see Table 4). The11B spin-echo dephasing times determined here are three to four times shorter than the
50
30 to 50 ms values observed in spin-echo experiments for the spin I = 1/2 nucleus 31P (100 % natural adundance, (31P)/
(11B) = 1.3) in inorganic phosphates for MAS frequencies between 10 and 20 kHz (see Table 4 in Ref,10Fig. 5 in Ref.16 and Table 5 in Ref.93). Longer spin-echo dephasing times of
55
24 to 100 ms have been determined for 17O spin-echo MAS NMR of partially 17O-labelled glycine.HCl and uracil,20 with these longer dephasing times being of the same magnitude as
those obtained from fits in this paper for lithium diborate at 5 and 25%11B abundance sample (see Table 3).
60
First-principles NMR calculations of
J
couplings
There is a growing literature of examples where homonuclear
J couplings are determined from spin-echo MAS NMR
experiments for spinI= 1/2 nuclei such as13C,15N, 29Si and 31
P.10,16,47,61,93-98In these cases, cosine modulation due to a J 65
coupling leads to clear zero crossings (at=n/2J, wheren= 1, 3,… for a 90 /2 180 /2 tacq pulse sequence) allowing theJ coupling constants to be determined to a high accuracy. While there is still significant signal intensity for the B3 site at a spin-echo duration of 166.6 ms for the 11B
70
MAS NMR spin-echo data in Fig. S2 of the ESI for polycrystalline lithium diborate with 25% 11B isotopic abundance, no zero crossing is detectable. In the context of this observation, calculations of NMR parameters provide valuable insight in combination with experiment, e.g., for J 75
couplings99-102as well as11B chemical shift and electric field gradient tensors.103-104 This section presents first-principles calculations of the2JBBcouplings in lithium diborate.
First-principles calculations of the2JBBcouplings in lithium diborate were performed as described in Refs.76,105 using the
80
CASTEP software package, which implements density
functional theory using a plane-wave basis set and the pseudopotential approach, and is thus applicable to periodic systems. Specifically, Table 5 lists the 2J11B-11B isotropic couplings for the four B-O-B bonds formed by each B4 atom
85
in the lithium diborate crystal structure (see Fig. 1). As presented in the ESI, the calculations also determine the four
separate contributions (Fermi contact, spin dipolar,
paramagnetic orbital and diamagnetic orbital: the Fermi contact term is found to be the dominant term) as well as theJ 90
anisotropy (< 2 Hz) and the orientation of the J tensor with respect to the internuclear vector that defines the dipolar coupling (for B4-O-B3 J couplings, the largest principal component is found to be close (within 3) to perpendicular to the internuclear vector). The ESI also presents calculated
95
1
J11B-17O couplings that should be experimentally measurable in a17O-labelled sample, noting that the1J31P-17O coupling in OPPh3 has been determined experimentally.106-107
The calculated isotropic2J11B-11Bcouplings range from 1.0 to 2.7 Hz for the three distinct B4-O-B3 linkages between
100
diborate units to 0.1 Hz for the coupling between two tetrahedral B sites (B4-O-B4). Further calculations (see ESI) have confirmed that these small2J11B-11Bare common to other boron-oxygen structural units: the coupling between the two trigonal B atoms in lithium metaborate is 3.2 Hz and the
B3-105
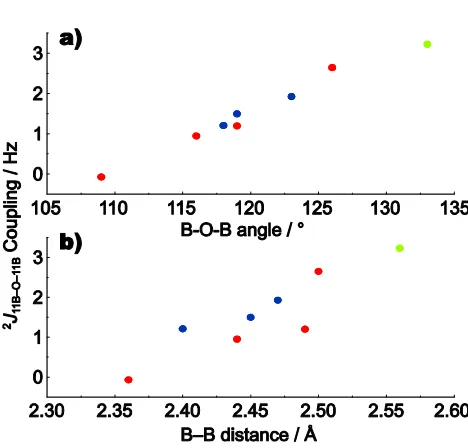
O-B4 couplings in lithium triborate range from 1.2 to 1.9 Hz. Importantly, Fig. 9 reveals a strong correlation between the 2
J11B-11Bisotropic couplings and the B-O-B angle (Fig. 9a) and a weaker yet still evident correlation with the B-B distance (Fig. 9b), namely theJcoupling increases as the B-O-B angle
110
increases from a tetrahedral towards a linear arrangement (with a concomitant increase in the B-B distance). A similar trend for calculatedJ couplings has been observed for2J
29Si-29Siand2J31P-31Pcouplings with respect to the Si-O-Si (see Fig. 5a of Ref.98 and Fig. 2b of Ref.108) and P-O-P (see Fig. 9 in
Ref.93) bond angle, respectively. Moreover, it is to be noted that the experimental observation of larger2J29Si-29Siand
2
J
31P-31P couplings correspond to compounds exhibiting larger Si-O-Si (e.g., 3.6 to 8.0 Hz for angles between 139º and 150º in parawollastonite98and 6.3 to 23.5 Hz for angles between 137º
5
and 173º in the zeolite Sigma-2108) and P-O-P (e.g., 9 to 30 Hz for angles between 139º to 157º in (MoO2)2P2O7, see Tables 4 & 5 in Ref.93) bond angles, as compared to the B-O-B bond angles that are in the range 109º to 126º for lithium diborate.
[image:11.595.46.280.197.259.2]10
Table 5Calculated2J
11B-11Bcouplingsafor lithium diborateb
∠B-O-B / ° r(B-B) / Å 2J
11B-O-11B/ Hz
B4-O1-B3 126 2.50 2.65
B4-O3-B3 119 2.49 1.20
B4-O2-B3 116 2.44 0.95
B4-O4-B4 109 2.36 0.07
aNote that only the magnitude and not the sign of aJcoupling can be determined by the cosine modulation in the experimental spin-echo approach.bThe four B-O-B bonds formed by each B4 atom are labelled as in Fig. 1.
15
Fig. 9 The dependence of calculated2J
BBcouplings on (a) the B-O-B angle and (b) the B-B distance for lithium diborate (red), lithium metaborate (green) and lithium triborate (blue).
20
The absence of an evident zero crossing due to a J
modulation in the experimental spin-echo data for lithium diborate with 25%11B abundance in Fig. S2 (that goes out to a spin-echo duration of 250 ms) can be rationalised on the basis
of the first-principles calculations shown in Table 5.
25
Specifically, three different 2J11B-11B couplings of 2.65 Hz, 1.20 Hz and 0.95 Hz are calculated for the three distinct B3-O-B4 linkages. These small calculated couplings correspond to a first zero crossing (= 1/2J) at 189 ms, 417 ms and 526 ms. Given the probabilities of a11B nucleus having one, two
30
or three11B neighbours of 42%, 14% and 2% (see Table 2 for 25%11B abundance), it can be calculated that only 25% of all 11
B nuclei (42*0.33 + 14*0.67 + 2*1.00 = 25%) give rise to a spin-echo modulation characterised by the largest 2J11B-11B
coupling (calculated as 2.65 Hz) for which a zero crossing
35
would be expected for a spin-echo duration of 200 ms. As such (see Ref.96for an analagous discussion of13C spin-echo modulation for a cellulose sample with ~10% 13C labelling), the observed spin-echo modulation will be dominated by the 75% of11B nuclei that do not exhibit a zero crossing at 200
40
ms.
Summary
To the best of our knowledge, there are no published examples of two-dimensional MAS homonuclearJcorrelation solid-state NMR experiments for quadrupolar nuclei. In this
45
context, this paper has explored by experiment and simulation the factors affecting spin-echo dephasing in 11B MAS NMR for the model compound, lithium diborate. The observed trends with respect to MAS frequency,11B isotopic abundance and CQ are rationalised in terms of two phenomena. On the
50
one hand, the reintroduction of the dipolar coupling due to the non-commutation of the dipolar and quadrupolar couplings (so-called spontaneous quadrupolar-driven recoupling, as described by Edén and Frydman40-41) is most efficient when the quadrupolar frequency, PAS
Q
/2 = 3CQ/[4I (2I – 1)], is
55
equal to twice the MAS frequency. On the other hand, the
effect of multiple homonuclear dipolar couplings are
progressively removed by faster MAS.
For the 11B depleted samples, long spin-echo dephasing times are observed: for 25% 11B, observable intensity is
60
evident at spin-echo durations of ~200 ms. However, we were not able to observe a zero crossing due to aJmodulation. This is consistent with first-principles calculations, where the three 2
J11B-11B couplings in lithium diborate are calcuated as 0.95, 1.20 and 2.65 Hz. Interestingly, calculations for lithium
65
diborate, lithium metaborate and lithium triborate reveal a clear trend whereby the calculated2J11B-11Bcouplings increase from 0.95 to 3.23 Hz with increasing B-O-B bond angle (116º to 133º) and B-B distance (2.40 to 2.56 Å). A similar trend has been observed for the dependence on 2J
29Si-29Siand 2J
31P-70
31P couplings with respect to the Si-O-Si98,108 and P-O-P93 bond angle in silicates and phosphates; for silicates and phosphates, the bond angles are larger (>140º) and 2J29Si-29Si and 2J
31P-31P couplings have been experimentally measured and utilised.
75
In conclusion, this paper has shown that, while 11B spin-echo dephasing times can be favourably long, it is the small 2
J11B-11Bcouplings that are a consequence of the small B-O-B bond angles observed in borates that are hampering the development of 11B homonuclear J correlation solid-state
80
NMR experiments. Such experiments may become feasible as
ever faster MAS frequencies deliver longer spin-echo
dephasing times.
Acknowledgements
Funding from EPSRC is acknowledged. NSB thanks the
85
University of Warwick for a USA travel grant. Three Euler angle orientation sets were provided by Matthias Ernst (ETH Zürich). Anne-Christine Uldry is thanked for carrying out
[image:11.595.48.282.307.531.2]calculations of J couplings were performed at the Oxford Supercomputer Centre.
Notes and references
aDepartment of Physics, University of Warwick, Coventry, CV4 7AL,UK.
E-mail: [email protected]
5
bDepartment of Materials, University of Oxford, Parks Road, Oxford OX1
3PH, UK.
cPhysics Department, Coe College, Cedar Rapids, IA 52402, USA. d
School of Chemistry, University of St Andrews and EaStCHEM, St Andrews, Fife KY16 9ST, UK.
10
eDepartment of Chemistry, University of Durham, South Road, Durham,
DH1 3LE, UK.
† Electronic Supplementary Information (ESI) available: Additional experimental results: Powder X-ray diffraction and Raman spectra; comparing fits to a mono- and bi-exponential function; nutation spectra 15
for the B3 and B4 sites in lithium diborate; spin-echo curves comparing the case where therfamplitude was calibrated so as to give a 180pulse duration of 25s for the B3 or B4 site; spin-echo curves comparing the case of a 4.2s as compared to a 25s 180pulse duration; correlation coefficients for the fits of spin-echo dephasing curves. Additional 20
simulation details and results: the effect of changing the dipolar coupling; the effect of including/ omitting the 180pulse for first- and second-order quadrupolar interactions; the dependence of NMR spin-echo dephasing on the MAS frequency as in Fig. 7 for first-order quadrupolar interaction and/ or perpendicular quadrupolar tensors; a representative pnmrsim input 25
file. Estimated magnitudes of second-order quadrupolar/dipolar and quadrupolar/CSA cross terms. Additional J coupling calculations: determination of the four separate contibutions to the calculated isotropic
J couplings; definition and calculation of J anisotropy and relative orientation; calculation of1J
BO; calculations for lithium metaborate and 30
lithium triborate. See DOI: 10.1039/b000000x/
1. M. Baldus and B. H. Meier,J. Magn. Reson. Ser. A, 1996,121, 65. 2. A. S. D. Heindrichs, H. Geen, C. Giordani and J. J. Titman,Chem.
Phys. Lett., 2001,335, 89. 35
3. A. Lesage, M. Bardet and L. Emsley,J. Am. Chem. Soc., 1999,121, 10987.
4. F. Fayon, D. Massiot, M. H. Levitt, J. J. Titman, D. H. Gregory, L. Duma, L. Emsley and S. P. Brown,J. Chem. Phys., 2005,122, 194313.
40
5. S. Cadars, J. Sein, L. Duma, A. Lesage, T. N. Pham, J. H.
Baltisberger, S. P. Brown and L. Emsley,J. Magn. Reson., 2007,188, 24.
6. L. J. Mueller, D. W. Elliott, K. C. Kim, C. A. Reed and P. D. W. Boyd,J. Am. Chem. Soc., 2002,124, 9360.
45
7. D. Lee, J. Struppe, D. W. Elliott, L. J. Mueller and J. J. Titman,Phys. Chem. Chem. Phys., 2009,11, 3547.
8. H. Kono, T. Erata and M. Takai,Macromolecules, 2003,36, 5131. 9. F. Fayon, G. Le Saout, L. Emsley and D. Massiot,Chem. Commun.,
2002, 1702. 50
10. P. Guerry, M. E. Smith and S. P. Brown,J. Am. Chem. Soc., 2009,
131, 11861.
11. G. Grasso, T. M. de Swiet and J. J. Titman,J. Phys. Chem. B, 2002,
106, 8676.
12. S. P. Brown, M. Perez-Torralba, D. Sanz, R. M. Claramunt and L. 55
Emsley,J. Am. Chem. Soc., 2002,124, 1152.
13. T. N. Pham, S. Masiero, G. Gottarelli and S. P. Brown,J. Am. Chem. Soc., 2005,127, 16018.
14. S. Cadars, N. Mifsud, A. Lesage, J. D. Epping, N. Hedin, B. F. Chmelka and L. Emsley,J. Phys. Chem. C, 2008,112, 9145. 60
15. J. M. Griffin, J. R. Yates, A. J. Berry, S. Wimperis and S. E. Ashbrook,J. Am. Chem. Soc., 2010,132, 15651.
16. D. Massiot, F. Fayon, M. Descamps, S. Cadars, P. Florian, V. Montouillout, N. Pellerin, J. Hiet, A. Rakhmatullin and C. Bessada,
C. R. Chim., 2010,13, 117. 65
17. S. Wi and L. Frydman,J. Chem. Phys., 2000,112, 3248. 18. D. Iuga, C. Morais, Z. H. Gan, D. R. Neuville, L. Cormier and D.
Massiot,J. Am. Chem. Soc., 2005,127, 11540.
19. S. K. Lee, M. Deschamps, J. Hiet, D. Massiot and S. Y. Park,J. Phys. Chem. B, 2009,113, 5162.
70
20. I. Hung, A. C. Uldry, J. Becker-Baldus, A. L. Webber, A. Wong, M. E. Smith, S. A. Joyce, J. R. Yates, C. J. Pickard, R. Dupree and S. P. Brown,J. Am. Chem. Soc., 2009,131, 1820.
21. S. E. Ashbrook and M. J. Duer,Concepts Magn. Res. A, 2006,28A, 183.
75
22. M. Edén,Solid State Nucl. Magn. Reson., 2009,36, 1.
23. R. E. Youngman and J. W. Zwanziger,J. Non-Cryst. Solids, 1994,
168, 293.
24. S. J. Hwang, C. Fernandez, J. P. Amoureux, J. Cho, S. W. Martin and M. Pruski,Solid State Nucl. Magn. Reson., 1997,8, 109.
80
25. G. Ferlat, T. Charpentier, A. P. Seitsonen, A. Takada, M. Lazzeri, L. Cormier, G. Calas and F. Mauri,Phys. Rev. Lett., 2008,101, 066504. 26. I. Hung, A. P. Howes, B. G. Parkinson, T. Anupold, A. Samoson, S.
P. Brown, P. F. Harrison, D. Holland and R. Dupree,J. Solid State Chem., 2009,182, 2402.
85
27. L. van Wullen and G. Schwering,Solid State Nucl. Magn. Reson., 2002,21, 134.
28. L. S. Du and J. F. Stebbins,J. Phys. Chem. B, 2003,107, 10063. 29. P. M. Aguiar and S. Kroeker,Solid State Nucl. Magn. Reson., 2005,
27, 10. 90
30. M. Murakawi, T. Shimizu, M. Tansho, T. Akai and T. Yazawa,
Chem. Lett., 2010,39, 32.
31. B. G. Parkinson, D. Holland, M. E. Smith, A. P. Howes and C. R. Scales,J. Non-Cryst. Solids, 2005,351, 2425.
32. D. Caurant, O. Majerus, E. Fadel, A. Quintas, C. Gervais, T. 95
Charpentier and D. Neuville,J. Nucl. Mater., 2010,396, 94. 33. C. Gervais, F. Babonneau, J. Maquet, C. Bonhomme, D. Massiot, E.
Framery and M. Vaultier,Magn. Reson. Chem., 1998,36, 407. 34. C. Gervais, J. Maquet, F. Babonneau, C. Duriez, E. Framery, M.
Vaultier, P. Florian and D. Massiot,Chem. Mater., 2001,13, 1700. 100
35. M. Murakawi, T. Shimizu, M. Tansho, A. Vinu, K. Ariga, T. Mori and K. Takegoshi,Solid State Nucl. Magn. Reson., 2007,31, 193. 36. D. L. Bryce, R. E. Wasylishen and M. Gee,J. Phys. Chem. A, 2001,
105, 3633.
37. M. A. M. Forgeron, D. L. Bryce, R. E. Wasylishen and R. Rosler,J.
105
Phys. Chem. A, 2003,107, 726.
38. S. E. Ashbrook, N. G. Dowell, I. Prokes and S. Wimperis,J. Am. Chem. Soc., 2006,128, 6782.
39. A. C. Stowe, W. J. Shaw, J. C. Linehan, B. Schmid and T. Autrey,
Phys. Chem. Chem. Phys., 2007,9, 1831. 110
40. M. Edén and L. Frydman,J. Chem. Phys., 2001,114, 4116. 41. M. Edén and L. Frydman,J. Phys. Chem. B, 2003,107, 14598. 42. M. M. Maricq and J. S. Waugh,J. Chem. Phys., 1979,70, 3300. 43. M. H. Levitt, D. P. Raleigh, F. Creuzet and R. G. Griffin,J. Chem.
Phys., 1990,92, 6347. 115
45. G. Facey, D. Gusev, R. H. Morris, S. Macholl and G. Buntkowsky,
Phys. Chem. Chem. Phys., 2000,2, 935.
46. S. P. Brown and S. Wimperis,J. Magn. Reson., 1997,128, 42. 47. A. Kubo and C. A. McDowell,J. Chem. Phys., 1990,92, 7156. 48. R. Challoner, T. Nakai and C. A. McDowell,J. Chem. Phys., 1991, 5
94, 7038.
49. K. Eichele, G. Wu and R. E. Wasylishen,J. Magn. Reson. Ser. A, 1993,101, 157.
50. S. Dusold, E. Klaus, A. Sebald, M. Bak and N. C. Nielsen,J. Am. Chem. Soc., 1997,119, 7121.
10
51. B. S. R. Sastry and F. A. Hummel,J. Am. Ceram. Soc., 1958,41, 7. 52. R. K. Harris and E. D. Becker,J. Magn. Reson., 2002,156, 323. 53. S. Hayashi and K. Hayamizu,Bull. Chem. Soc. Jpn., 1989,7, 2429. 54. J. S. Frye and G. E. Maciel,J. Magn. Reson., 1982,48, 125. 55. C. Huguenard, F. Taulelle, B. Knott and Z. H. Gan,J. Magn. Reson., 15
2002,156, 131.
56. S. E. Ashbrook and S. Wimperis,J. Magn. Reson., 2002,156, 269. 57. S. Antonijevic and G. Bodenhausen,Angew. Chem.-Int. Edit., 2005,
44, 2935.
58. H. T. Kwak, P. Srinivasan, J. Quine, D. Massiot and Z. H. Gan, 20
Chem. Phys. Lett., 2003,376, 75.
59. G. Pileio, Y. Guo, T. N. Pham, J. M. Griffin, M. H. Levitt and S. P. Brown,J. Am. Chem. Soc., 2007,129, 10972.
60. G. Pileio, S. Mamone, G. Mollica, I. M. Montesinos, A. Gansmuller, M. Carravetta, S. P. Brown and M. H. Levitt,Chem. Phys. Lett., 25
2008,456, 116.
61. T. N. Pham, J. M. Griffin, S. Masiero, S. Lena, G. Gottarelli, P. Hodgkinson, C. Fillip and S. P. Brown,Phys. Chem. Chem. Phys., 2007,9, 3416.
62. P. Hodgkinson,"pNMRsim: a general simulation program for large
30
problems in solid-state NMR" URL:
http://www.dur.ac.uk/paul.hodgkinson/pNMRsim/.
63. P. Hodgkinson and L. Emsley,Prog. Nucl. Magn. Reson. Spectrosc., 2000,36, 201.
64. M. Edén,Concepts Magn. Res. A, 2003,17A, 117. 35
65. M. Edén,Concepts Magn. Res. A, 2003,18A, 1. 66. M. Edén,Concepts Magn. Res. A, 2003,18A, 24.
67. J. McManus, R. Kemp-Harper and S. Wimperis,Chem. Phys. Lett., 1999,311, 292.
68. S. E. Ashbrook, J. McManus, M. J. Thrippleton and S. Wimperis, 40
Prog. Nucl. Magn. Reson. Spectrosc., 2009,55, 160.
69. V. E. Zorin, M. Ernst, S. P. Brown and P. Hodgkinson,J. Magn. Reson., 2008,192, 183.
70. S. K. Zaremba,Ann. Mat. Pura. Appl., 1966,73, 293. 71. H. Conroy,J. Chem. Phys., 1967,47, 5307. 45
72. V. B. Cheng, H. H. Suzukawa and M. Wolfsberg,J. Chem. Phys., 1973,59, 3992.
73. C. J. Pickard and F. Mauri,Phys. Rev. B, 2001,63, 245101. 74. J. R. Yates, C. J. Pickard and F. Mauri,Phys. Rev. B, 2007,76,
024401. 50
75. www.gipaw.net.
76. S. Joyce, J. Yates, C. Pickard and F. Mauri,J. Chem. Phys., 2007,
127, 204107.
77. J. P. Perdew, K. Burke and M. Enzernhof,Phys. Rev. Lett., 1999,77, 3865.
55
78. D. Vanderbilt,Phys. Rev. B, 1990,41, 7892.
79. N. Trouillier and J. L. Martins,Phys. Rev. B, 1991,43, 1993. 80. S. F. Radaev, L. A. Muradyan, L. F. Malakhova, Y. V. Burak and V.
I. Simonov,Kristallografiya, 1989,34, 1400.
81. V. E. Zorin, S. P. Brown and P. Hodgkinson,J. Chem. Phys., 2006, 60
125, 144508.
82. M. R. Hansen, T. Vosegaard, H. J. Jakobsen and J. Skibsted,J. Phys. Chem. A, 2004,108, 586.
83. N. S. Barrow, S. E. Ashbrook, S. P. Brown and D. Holland,Phys. Chem. Glasses-Eur. J. Glass Sci. Technol. Part B, 2009,50, 201. 65
84. V. E. Zorin, S. P. Brown and P. Hodgkinson,Mol. Phys., 2006,104, 293.
85. S. P. Brown,Prog. Nucl. Magn. Reson. Spectrosc., 2007,50, 199. 86. E. R. Andrew and D. P. Tunstall,Proc. Phys. Soc., 1961,1, 11. 87. P. Hodgkinson and M. R. Hampson,Solid State Nucl. Magn. Reson., 70
2006,30, 98.
88. G. Jaccard, S. Wimperis and G. Bodenhausen,J. Chem. Phys., 1986,
85, 6282.
89. S. P. Brown and S. Wimperis,Chem. Phys. Lett., 1994,224, 508. 90. J. H. Davis, K. R. Jeffrey, M. Bloom, M. I. Valic and T. P. Higgs, 75
Chem. Phys. Lett., 1976,42, 390.
91. S. Antonijevic and S. Wimperis,J. Magn. Reson., 2003,164, 343. 92. J. P. Amoureux and J. Trebosc,J. Magn. Reson., 2006,179, 311. 93. S. E. Lister, A. Soleilhavoup, R. L. Withers, P. Hodgkinson and J. S.
O. Evans,Inorg. Chem., 2010,49, 2290. 80
94. G. Wu and R. E. Wasylishen,Inorg. Chem., 1992,31, 145. 95. L. Duma, W. C. Lai, M. Carravetta, L. Emsley, S. P. Brown and M.
H. Levitt,ChemPhysChem, 2004,5, 815.
96. S. P. Brown and L. Emsley,J. Magn. Reson., 2004,171, 43. 97. W. C. Lai, N. McLean, A. Gansmuller, M. A. Verhoeven, G. C. 85
Antonioli, M. Carravetta, L. Duma, P. H. M. Bovee-Geurts, O. G. Johannessen, H. J. M. de Groot, J. Lugtenburg, L. Emsley, S. P. Brown, R. C. D. Brown, W. J. DeGrip and M. H. Levitt,J. Am. Chem. Soc., 2006,128, 3878.
98. P. Florian, F. Fayon and D. Massiot,J. Phys. Chem. C, 2009,113, 90
2562.
99. J. Vaara, J. Jokisaari, R. E. Wasylishen and D. L. Bryce,Prog. Nucl. Magn. Reson. Spectrosc., 2002,41, 233.
100.J. R. Yates,Magn. Reson. Chem., 2010,48, S23. 101.D. L. Bryce,Magn. Reson. Chem., 2010,48, S64. 95
102.C. Bonhomme, C. Gervais, C. Coelho, F. Pourpoint, T. Azais, L. Bonhomme-Coury, F. Babonneau, G. Jacob, M. Ferrari, D. Canet, J. R. Yates, C. J. Pickard, S. A. Joyce, F. Mauri and D. Massiot,Magn. Reson. Chem., 2010,48, S86.
103.S. Sen,Molec. Simul., 2008,34, 1115. 100
104.J. W. E. Weiss and D. L. Bryce,J. Phys. Chem. A, 2010,114, 5119. 105.S. A. Joyce, J. R. Yates, C. J. Pickard and S. P. Brown,J. Am. Chem.
Soc., 2008,130, 12663.
106.D. L. Bryce, K. Eichele and R. E. Wasylishen,Inorg. Chem., 2003,
42, 5085. 105
107.I. Hung, A. Wong, A. P. Howes, T. Anupold, J. Past, A. Samoson, X. Mo, G. Wu, M. E. Smith, S. P. Brown and R. Dupree,J. Magn. Reson., 2007,188, 246.
108.S. Cadars, D. H. Brouwer and B. F. Chmelka,Phys. Chem. Chem. Phys., 2009,11, 1825.