A STATISTICAL APPROACH TOWARDS
THE RESPONSE OF DUNE SYSTEMS TO
TIDAL INLET PROCESSES
Author: A.J. Dekker
Master Thesis Civil Engineering and Management
2
A statistical approach towards the response of dune
systems to tidal inlet processes
A.J. Dekker
MSc Thesis in Civil Engineering and Management
Enschede, 06 July 2017
To presented on 14 July 2017 in Enschede
University of Twente
Faculty of Engineering Technology
Department of Water Engineering of Management
PO Box 217
7500 AE Enschede
Graduation committee:
Prof. dr. S.J.M.H. Hulscher (head of the committee)
F. Galiforni Silva, MSc (daily supervisor)
4
Abstract
Tidal inlets are complex systems that have an unknown influence on adjacent dune systems. The objective of this research is to assess which tidal inlet processes are important for dune development. A statistical approach, namely categorical regression, is used to assess which processes are significant.
For this research, 45 tidal inlets and its adjacent dune systems were selected from western Europe, the contiguous United States, Brazil, Africa and Australia. These inlets were characterized based on the hydrodynamic forcing, the migratory behaviour and the number of channels, whereas the adjacent dune systems were characterized by the overall dune development, the vegetation cover, the extent of the active part of the dune system, the maximum observed dune height, the climate type and the wind regime.
The data set is analysed using CATREG, an algorithm for regression of categorical variables. This algorithm quantifies the categorical data and then does a linear regression. The output of this model gives which variables are significant for responses in the dune system. The responses were the overall development of the dune system, the extent of the active part, the vegetation cover and the maximum dune height.
The overall development of a dune system near a tidal inlet seems to be affected by the hydrodynamic forcing and the migration of the inlet. Furthermore, the dune height seems to be affected by the climate and the vegetation cover. The vegetation cover itself is affected by the wind, the climate and the migration style of the inlet.
The migration of a tidal inlet is the only accessed inlet-process that significantly influences the nearby dune systems. The other significant processes, such as the hydrodynamics and wind, are also present near straight coasts. However, the morphology, topography and geometry near the tidal inlet may influence the local hydrodynamics and wind conditions, so the exact influence of those processes may be different than on straight coasts.
5
Preface
This thesis is written as final part of the specialization Water Engineering and Management (WEM) of the master Civil Engineering and Management at Twente University, The Netherlands. This research has been conducted at the chair group Marine and Fluvial Systems of the Twente Water Centre, Enschede, The Netherlands. This research is about the response of dune systems on tidal inlet processes.
I would like to thank Filipe Galiforni Silva for his support and feedback during the process. I am also very grateful to Kathelijne Wijnberg and Suzanne Hulscher for their feedback. Furthermore, my fellow graduate students were a big support during the research and writing process. They kept me sharp and sometimes provided well-needed distractions.
Bert Dekker
6
Content
1. Introduction ... 8
1.1. Background ... 8
1.2. Research gap and objective ... 9
1.3. Study area ... 9
1.4. Research questions ...10
1.5. Thesis outline ...10
2. Methodology ...11
2.1. Selection of tidal inlets ...11
2.2. Characterize inlets and dune systems ...11
2.3. Find and explain dependencies ...17
3. Results: selection and characterization ...22
3.1. Europe ...23
3.2. United States ...25
3.3. Brazil ...28
3.4. Australia ...29
3.5. Africa ...30
4. Results: statistical analysis ...31
4.1. Hypotheses ...31
4.2. Categorical regression ...34
5. Discussion: results of the statistical test ...39
5.1. Development of the updrift dune system ...39
5.2. Development of the downdrift dune system ...40
5.3. Extent of the active part of the updrift dune system ...40
5.4. Extent of the active part of the downdrift dune system ...41
5.5. Maximum dune height ...41
5.6. Vegetation cover of the updrift dune system ...42
5.7. Vegetation cover of the downdrift dune system ...42
6. Discussion: limitations and remarks...43
7. Conclusions and recommendations ...45
7.1. Answers to the research questions ...45
7.2. Recommendations ...47
References ...48
Appendices ...54
7
B. Reference images vegetation cover ...56
C. Global overview of selected inlets ...57
D. Characterization ...58
E. Raw and categorical data ...95
8
1. Introduction
This chapter describes the background of the research. Secondly, the knowledge gap is described. The study area of this research is presented followed by the research questions. To conclude the outline of this thesis is presented.
1.1. Background
Large parts of the coasts in the world are protected by coastal dunes, which are wind-driven accumulations of sand. Dune development is reliant on the supply of sediment to the backshore, which is dependent on the wind, the beach geometry and the sediment characteristics (Bauer & Davidson-Arnott, 2003). The proximity of the land-sea interface leads to the fact that the morphological aspects of dunes are influenced by marine processes. The waves and tides are responsible for the supply of sediment to the beach. When the sediment is on the beach, it can be picked up by the wind and transported to the backshore. Wave attack can also lead to erosion and the formation of blowouts (Hesp, 2002). The beach-dune system is therefore a dynamic system with many processes going on and interacting with each other (Houser & Ellis, 2013; Sherman & Bauer, 1993).
Figure 1: components in a tidal inlet system (de Swart & Zimmerman, 2009)
9
tidal inlet system. The sediment fluxes near tidal inlets are significantly different from fluxes on straight coasts (FitzGerald, 1996), which will most probably have an influence on the dune systems near tidal inlets.
Storm surges and other extreme events can have a huge influence on dune systems near tidal inlets too (Houser, Hapke, & Hamilton, 2008), but data of these events is scarce and the effects of storms on dunes near tidal inlets is only investigated for a limited number of places. Also information of the effect of waves and tides on geological timescales is not fully known, so only the effect of hydrodynamic forcing on a timescale from years to decades is taken into account in this research. The introduction given in this chapter is not exhaustive and a more elaborate overview of processes in and around tidal inlet systems is given by De Swart & Zimmerman (2009).
1.2. Research gap and objective
It is hypothesized that tidal inlets have an influence on nearby dune systems, for example because some parts of the tidal inlet may be sheltered from wave attack or because there is more or less sediment input into the beach-dune system. The tidal inlet system and its relation to the adjacent beach-dune system is complex and needs further investigation to test this hypothesis.
A first step in assessing what the influence of a tidal inlet is on the adjacent dune system is to assess the relation between inlet behaviour and dune development. It is possible that the important processes can be identified using this information. The objective of this research is thus to describe the relation between the behaviour of tidal inlet systems and the development of adjacent dune systems. This will aid in the development of a conceptual model that can describe and predict dune development near tidal inlets. This model can be used as a first step in designing Building with Nature solutions in tidal inlet systems.
1.3. Study area
This research aims at getting a global overview of the relations between the tidal inlet system and adjacent dune systems. This can only be done if inlets from all over the world are used. Due to limitations in time and budget it is not feasible to assess all existing inlets, therefore five areas are selected which are divided in a total of eight sub-areas (see Appendix A):
- Europe: Atlantic coast, Wadden coast
- Contiguous United States: Atlantic coast, Pacific coast, Gulf coast
- Brazil
- Africa: Atlantic Coast
- Australia
Inlets from these areas are assessed in this research. South East Asia is not taken into account, because not much coastal dunes can be found there (Hesp, 2008). The areas mentioned above are selected because they have a different hydrodynamic forcing and climate. The northern Atlantic and Pacific coast experience swell, while this is much less the case at the Gulf coast and Wadden coast (Gulev, Grigorieva, & Sterl, 2006). The tidal range varies from micro-tidal along the Gulf coast to macro-tidal along parts of the Brazilian coast (Davidson-Arnott, 2009).
10
northern Australian coast has a tropical climate. In the southern part of Brazil and on the southern coast of Australia a maritime climate is present. Large parts of the west coast of Australia experience a hot desert climate (Peel, Finlayson, & McMahon, 2007).
1.4. Research questions
Multiple research questions are formulated to meet the objective mentioned in the previous paragraph:
1.4.1. Main Question
What is the influence of the hydrodynamic forcing and migratory behaviour of tidal inlets on dune systems near tidal inlets?
1.4.2. Subquestions
1. Where in the study area do tidal inlets occur that have a dune system on one or both sides of the inlet channel?
2. What are the characteristics of the selected tidal inlets and their adjacent dune systems?
3. What relations can be found between the parameters that describe inlet behaviour and the parameters that describe the dune systems?
1.4.3. Approach
The subquestions are answered with different methods. An elaborate overview is given in chapter 2, but here a quick overview is given. Subquestion 1 is answered with the help of visual assessment of satellite imagery. Inlets are selected based on a number of criteria. Subquestion 2 is answered using data found in literature or open-source databases. The found data is summarized in maps. The last subquestion is answered using categorical regression analysis.
1.5. Thesis outline
11
2. Methodology
This chapter describes the methods that are used to get to the results as presented in the following chapters.
2.1. Selection of tidal inlets
The tidal inlets that will be researched are selected within the search area defined in paragraph 1.3. Inlets without dunes and inlets that are fixed on both sides by jetties and/or seawalls are not selected. From the inlets with dunes, a minimum of forty inlets is selected. To ensure spatial spreading of the inlets, a minimum of three inlets is selected per sub-area. The selection within a sub-area is governed by the differences in tidal range, wave climate and climate along the coast within the sub-area. The variation in the hydrodynamic forcing and climate is used as a proxy to get the biggest spread in characteristics in the final data inventory. The total number of forty inlets is used to get enough observations to get reliable result from the categorical regression analysis (2.3.2).
The selection procedure described here will lead to a list of inlets that are further characterized in the third part of the research. The number of selected inlets will be compared to an approximation of the total number of inlets that were assessed. The reason
for not selecting inlets will be given too. The remark ‘structures in the inlet’ means that the
inlet was fixed by jetties and/or seawalls or there was urban development up to the shoreline on both sides of the inlet. The remark ‘no dunes present’ means that no dunes could be seen on (aerial) photographs. The remark ‘no information about inlet’ means that no information about the inlet could be found on the internet, which was only the case with some inlets in Africa.
2.2. Characterize inlets and dune systems
To characterize tidal inlet systems and their adjacent dune systems it is necessary to have certain variables that can theoretically be determined for all systems. The choice of those variables is discussed in the first part. The methods used to get the data is discussed in the second part.
2.2.1. Choosing variables
12
Figure 2: Framework that shows the controls on dune development (Reed et al., 2009)
To develop dunes, it is necessary to have sediment supply from the beach to the backshore. In general it can be said that coastal dunes develop where there is enough available sediment, a sufficient fetch to transport the sediment and vegetation to capture the sediment (Houser & Ellis, 2013). The availability of sediment and the fetch are directly related with the beach width (Bauer & Davidson-Arnott, 2003). The width of beaches along tidal inlets is not well-defined and it has approximately the same range as beaches along open coasts, so this is not of interest when assessing the effect of tidal inlets on dune development. The wind characteristics can be of interest, because the coast along a tidal inlet is not straight. The wind thus has a varying effect along the shore, so mean annual wind speed and most occurring wind direction are also taken into account. The wind direction is determined with respect to shore-normal to account for the different effect of wind from the same direction on a differently orientated inlet system.
A measure for the sediment supply from the beach to the dune systems and the vegetation characteristics is the dune height. The dune height can be limited, because developing dune ridges can be disconnected from their sediment supply by a new ridge (van Heteren, Oost, van der Spek, & Elias, 2006). The old ridge then becomes vegetated and stabilized (Reed et al., 2009). The maximum dune height is chosen as a proxy for the mean dune height in the dune system, because the mean dune height cannot easily be obtained. It is not well-defined which local maxima in a dune system can be regarded as the top of a dune. Values for the maximum dune height are also readily available in literature for some inlets (e.g. Sawakuchi et al., 2008). Furthermore, for every dune system is assessed if the dune system is fully or partly stabilized.
13
system present at one side of the inlet. A variable that is also used in the classification of individual dunes is the vegetation type and cover. It is not feasible to assess the vegetation type for every dune system in this research, but it is possible to assess the vegetation cover based on aerial photographs. The type and amount of vegetation is partly dependent on the local climate (Hesp, 2012a). Therefore, the Köppen-Geiger climate class is assessed for every dune system (Peel et al., 2007).
The sediment supply towards the beach that is needed to have enough supply towards the backshore is controlled by marine processes in the tidal inlet system. The size of an inlet and its morphology is controlled by hydrodynamic forcing in the form of waves and tides (FitzGerald, 1996). This forcing can be characterized using the mean significant wave height and the mean tidal range. Using this two values it can be determined if the inlet is wave-dominated, tide-dominated or mixed-energy using a graph proposed by Davis & Hayes (1984).
Migration of an inlet channel controls erosion and/or accretion of the headlands. This has influence on the sediment supply towards the dunes. The migration direction and rate is dependent on the governing direction of incoming waves and the local geology. If the waves mostly come in from one direction and the bed is erodible, the inlet will migrate in downdrift direction (Wang & Beck, 2012). It can be that a spit is formed. This spit can be breached and then a new inlet channel is opened. If the bed is erodible, but the waves come in from different directions, it can be that the inlet displays an erratic migration behaviour. If the headlands cannot be eroded, because there are fixed by hard constructions or bedrock, the inlet will be on a fixed position (van Heteren et al., 2006). The wave direction will be determined with respect to shore-normal to account for the effect that come from the same direction towards differently orientated inlet systems.
Sediment transport inside the inlet channel is mainly done by tidal currents. The flood current deposits the sediment at the landward side of the inlet in a flood delta, while the ebb current deposits sediment on the seaward side in an ebb-tidal delta (Fiechter, Steffen, Mooers, & Haus, 2006). Not all the sediment is trapped in the ebb-tidal delta or the flood delta. Part of the sediment bypasses the inlet and is transported towards the downdrift headland. The two deltas act as sediment traps (de Swart & Zimmerman, 2009), but the ebb tidal delta also releases sediment in the form of shoals that migrate towards the coast (Ridderinkhof, de Swart, van der Vegt, & Hoekstra, 2016). Flood deltas do not release sediment in the form of shoals. This is due to the limited wave impact at the landward side of the inlet (Dyer & Huntley, 1999). The shoals originating from the ebb-tidal delta merge with the coast and form a large sediment input (van Heteren et al., 2006). The morphology of an ebb-tidal delta and the morphodynamics of shoals are influenced by the number of tidal channels in the inlet. The number of channels possibly has an influence on the migration velocity and attachment frequency of shoals (Ridderinkhof et al., 2016). The effect of shoal attachments on dune development is not yet known, but it could be that the number of inlet channels has indirect influence on the dunes. Therefore, the number of inlet channels is assessed for every inlet.
14
Table 1: variables that characterize tidal inlet and coastal dune systems
Tidal inlet system Coastal dune system
Mean tidal range [𝑚] Development [𝑛𝑜𝑛𝑒/𝑓𝑖𝑥𝑒𝑑/𝑒𝑥𝑝𝑎𝑛𝑑𝑖𝑛𝑔/𝑟𝑒𝑡𝑟𝑒𝑎𝑡𝑖𝑛𝑔]
Mean significant wave height [𝑚] Active part [fully active/partly active]
Dominant forcing [𝑤𝑎𝑣𝑒, 𝑡𝑖𝑑𝑒, 𝑚𝑖𝑥𝑒𝑑] Maximum dune height [𝑚]
Mean wave direction [°𝑠ℎ𝑜𝑟𝑒 𝑛𝑜𝑟𝑚𝑎𝑙] Vegetation cover [𝑥/8]
Migration style [𝑜𝑛𝑒 𝑑𝑖𝑟𝑒𝑐𝑡𝑖𝑜𝑛,
𝑚𝑢𝑙𝑡𝑖𝑝𝑙𝑒 𝑑𝑖𝑟𝑒𝑐𝑡𝑖𝑜𝑛𝑠, 𝑓𝑖𝑥𝑒𝑑]
Wind speed [𝑚/𝑠]
Migration rate [𝑚/𝑦𝑒𝑎𝑟] Wind direction [°𝑠ℎ𝑜𝑟𝑒 𝑛𝑜𝑟𝑚𝑎𝑙]
Number of channels Climate [𝐾ö𝑝𝑝𝑒𝑛 − 𝐺𝑒𝑖𝑔𝑒𝑟 𝑐𝑙𝑖𝑚𝑎𝑡𝑒 𝑐𝑙𝑎𝑠𝑠]
2.2.2. Getting values for the selected variable
The inlet systems that were selected in the first part of the research will be characterized based on the selected variables (Table 1). The needed data will be gathered from open sources. If there is already a case study done on the inlet of interest, the data and/or results from that study will be used. If this is not the case, the data is gathered according to the method described below (see also: Table 2).
Table 2: method per variable
Variable Method
Mean tidal range Buoy data / Location data / XTide
Mean significant wave height Buoy data / WaveWatch III
Dominant forcing Graph as proposed by Davis & Hayes (1984)
Mean wave direction Buoy data
Migration style Visual assessment of satellite imagery
Migration rate Measure displacement of channel centre line using
satellite imagery
Number of channels Visual assessment of satellite imagery
Dune development Comparing polygons drawn over satellite imagery
Maximum dune height Visual assessment of Digital Elevation Maps
(DEM)
Vegetation cover Visual assessment of satellite imagery in
combination with appendix B
Wind speed Weather station data / Windfinder
Wind direction Weather station data / Windfinder
Climate Climate map as proposed by Peel et al. (2007)
15
[image:16.595.109.479.108.531.2]ocean wave model. The graph shown in Figure 3 is used to assess whether an inlet is wave-dominated, tide-dominated or mixed-energy.
Figure 3: classification of coasts and tidal inlets as proposed by Davis & Hayes (1984)
16
sides separately. Which side is updrift and which side is downdrift is determined using the migration of the inlet or the wave direction on the fixed inlets. The updrift side is called UD and the downdrift side is called DD. If the dunes are present on a sand spit, they are characterized as being updrift (UD). The vegetation cover is only determined for the dunes closest to the inlet, because most dune systems become more vegetated when going inland. The vegetation cover is described using octas (eights), so 0/8 means that there is no vegetation and 8/8 means that the dune system is fully vegetated. This method is more commonly used to assess cloud cover (Met Office, 2015). Reference images for this rating can be found in appendix B.
The maximum height of dunes in a dune system is determined as the crest elevation from Digital Elevation Maps (DEMs) which are assessed using a Geographic Information System. DEMs for the Netherlands are available as part of the AHN (Algemeen Hoogtebestand Nederland). A global DEM mosaic is available through the National Center for Environmental Information (NCEI). The global DEM mosaic is built from various DEMs with different resolutions. If the individual dune ridges or the inlet itself are not recognizable on the DEM, the resolution is to coarse to determine the maximum dune height. The vertical accuracy of the DEMs differs between 5 centimetre and 1 meter.
The mean wind speed and most occurring wind direction are determined using data from local weather stations. This data is for example available for the Netherlands through the Royal Netherlands Meteorological Institute (KNMI). The Brazilian National Meteorological Institute (INMET) has wind data for some inlets on the Brazilian coast. When the data is not easily accessible via national weather institutions, Windfinder will be used to get the values for wind speed and wind direction. Windfinder is a global weather service that is aimed at wind related activities, such as surfing and sailing. Statistics at their sites are calculated based on measurements at weather stations that are done during daytime (Windfinder, 2017). If there is no data from Windfinder available, the wind data from WaveWatch III is used. WaveWatch III stores the data as a u-component and a v-component. The wind speed and direction are calculated as follows:
𝑊𝑖𝑛𝑑 𝑠𝑝𝑒𝑒𝑑 = √𝑈𝑤𝑖𝑛𝑑2 + 𝑉𝑤𝑖𝑛𝑑2 (1)
𝑊𝑖𝑛𝑑 𝑑𝑖𝑟𝑒𝑐𝑡𝑖𝑜𝑛 = 270 − atan2(𝑉𝑤𝑖𝑛𝑑 𝑈𝑤𝑖𝑛𝑑
) (2)
The wind direction and wave direction are converted from degrees from North to degrees from shore normal. Shore normal is determined as the direction of the centreline of the inlet pointing seaward.
17
When all the classification is done, there is a big table that summarizes it all. The table will be organized with on every row an inlet and on every column a variable.
2.3. Find and explain dependencies
In the previous part of the research a data inventory was built. This inventory is further analysed using an algorithm for categorical regression called CATREG. The first step is to bin all numeric data into categories, so that all variables become categorical. This is necessary for the use of CATREG, because it only supports categorical data. In the second part of this paragraph more information about CATREG is given.
2.3.1. Categorize data
The data inventory built up in the previous part of the research consists of both numeric and categorical data. For statistical analysis, it is preferred to have the same data type throughout the whole data set. Therefore, the numeric data is binned into categories. The categorical data will be further analysed. The number of channels can be easily categorized in single channel or multiple channels. For the other numeric data a different approach is used.
The tidal range is categorized using the classification of tidal ranges proposed by Davies (1964). This means that the tidal ranges will be categorized in three categories, namely micro-tidal, meso-tidal and macro-tidal. Davies (1964) did the classification based on the spring tidal range, but in this research the mean tidal range will be used. Values of a mean tidal range below 2 m are considered micro-tidal. Values between 2 and 4 m are considered meso-tidal and tidal ranges of more than 4 m are macro-tidal.
[image:18.595.93.503.535.750.2]The mean significant wave height is binned using the Beaufort Scale (Table 3). The wave heights given in the last column of the table refer to well-developed wind waves of the open sea. The categories are collapsed to get a total of three categories. The first category includes Beaufort Scale 0, 1, 2, 3 and 4 and consists of waves with a mean significant wave height of less than 1.5 m. The second category is 5 on the Beaufort Scale and consists of waves with a mean significant wave height between 1.5 m and 2.5 m. Waves higher than 2.5 m are placed in the last category.
Table 3: Beaufort Scale (modified from Met Office (2016))
Beaufort wind scale
Limits of wind speed [m/s]
Wind speed categories
Probable wave height [m]
Mean significant wave height
categories
0 <1
Calm
0
Low
1 1-2 0.1
2 2-3 0.2
3 4-5 0.6
4 6-8 Moderate 1.0
5 9-11
Heavy
2.0 Moderate
6 11-14 3.0
High
7 14-17 4.0
8 17-21 5.5
9 21-24 7.0
10 25-28 9.0
11 29-32 11.5
18
The wind speed is also categorized using the Beaufort Scale (Table 3). The Beaufort Scale is collapsed to get three wind speed categories. The categories 0, 1, 2 and 3 of the Beaufort Scale are collapsed to form the first category of wind speed with wind speed of less than 5 m/s. Category 4 of the Beaufort Scale forms the middle category with wind speeds of 5-8 m/s. The rest is placed in the last category with wind speeds above 8 m/s.
The wave and wind direction are categorized in respectively two and four categories. The wave directions can vary from 0° to 90°. A value of 0° means that the waves come in perpendicular to the coast, while a value of 90° means that the waves travel along the coast. The wave direction is categorized in two bins with the central bin edge at 45°. The wind direction can vary from 0° to 180°, where 0° means that the wind comes from the sea and 180° means that the wind comes from the land. The wind direction is binned in four categories, namely 0° - 45°, 45° - 90°, 90° - 135° and 135° - 180°.
The dune height is categorized in three categories. There is no existing classification scheme for dune heights, so the bin edges are chosen somewhat arbitrarily. The first category consists of dunes with a maximum height of less than 7 m. The second category has a
maximum dune height of 7 – 25 m. The last category has a maximum dune height of more
than 25 m.
The migration rate is categorized in three categories. To make it possible to correctly bin the numeric data, a range of values must be determined. Therefore, the migration rates from 0 – 5 m/year are put into the first category. The edge between the second and third category is less straight forward and must be chosen arbitrarily. A value of 20 m/year is chosen as the border between the second and third category. The second category has thus migration rates of 5 – 20 m/year, while the third category has values of more than 20 m/year.
The climate is already categorical data, but it has more than five categories. Therefore, the climate categories are collapsed based on the main climate groups. This will lead to a maximum of five categories (A, B, C, D and E).
2.3.2. Statistical analysis
19
Table 4: response and predictor variables and their scaling
Predictor variable (scaling) Response variable (all ordinal)
Mean significant wave height (ordinal) Development of the updrift dune system
Mean wave direction (nominal) Development of the downdrift dune system
Tidal range (ordinal) Active part of the updrift dune system
Dominant hydrodynamic forcing (nominal) Active part of the downdrift dune system
Migration style of the inlet (nominal) Maximum dune height
Migration rate of the inlet (ordinal/nominal) Number of inlet channels (ordinal)
Mean wind speed (ordinal) Mean wind direction (nominal) Climate (nominal)
Vegetation cover of the updrift dune system Vegetation cover of the downdrift dune system
CATREG scales categorical data by assigning numeric values to the different categories of the categorical data. This way an optimal linear regression equation for the scaled variables can be made. The standard approach used for linear and categorical regression is expanded to simultaneously include nominal, ordinal and numeric data. The CATREG objective is to find the set of scaled variables and regression coefficients, such that the objective function (3) is minimalized under a normalization restriction (4) and a restriction that centres the scaling of the response variable (5). This procedure is done separately for every response variable.
𝜎(𝑦𝑟; 𝛽; 𝑦𝑗) = (𝐺𝑟𝑦𝑟− ∑ (𝛽𝑗𝐺𝑗𝑦𝑗) 𝑗∈𝐽𝑝
) ′
𝑊 (𝐺𝑟𝑦𝑟− ∑ (𝛽𝑗𝐺𝑗𝑦𝑗) 𝑗∈𝐽𝑝
) (3)
𝑦𝑟′𝐷𝑟𝑦𝑟 = 0 (4)
𝑢′𝑊𝐺𝑟𝑦𝑟 = 0 (5)
𝑅² = 𝑛−1/2(𝐺
𝑟𝑦𝑟)′𝑊𝑣(𝑣′𝑊𝑣)−1/2 (6)
𝑛 Number of analysis cases (objects)
𝑤𝑖 Weight of object (𝑤𝑖 = 1)
𝑊 Diagonal 𝑛 × 𝑛 matrix with 𝑤𝑖 on the diagonal
𝑝 Number of predictor variables
𝐽𝑝 Index set of predictor variables 𝑗 ∈ 𝐽𝑝
𝑘𝑗 Number of categories of variable 𝑗
𝐺𝑗 Indicator matrix for variable 𝑗 of order 𝑛 × 𝑘𝑗
𝑔(𝑗)𝑖𝑟= {1 0
𝑤ℎ𝑒𝑛 𝑡ℎ𝑒 𝑖𝑡ℎ 𝑜𝑏𝑗𝑒𝑐𝑡 𝑖𝑠 𝑖𝑛 𝑡ℎ𝑒 𝑟𝑡ℎ 𝑐𝑎𝑡𝑒𝑔𝑜𝑟𝑦 𝑜𝑓 𝑣𝑎𝑟𝑖𝑎𝑏𝑙𝑒 𝑗 𝑤ℎ𝑒𝑛 𝑡ℎ𝑒 𝑖𝑡ℎ 𝑜𝑏𝑗𝑒𝑐𝑡 𝑖𝑠 𝑛𝑜𝑡 𝑖𝑛 𝑡ℎ𝑒 𝑟𝑡ℎ 𝑐𝑎𝑡𝑒𝑔𝑜𝑟𝑦 𝑜𝑓 𝑣𝑎𝑟𝑖𝑎𝑏𝑙𝑒 𝑗
𝐺𝑟 Indicator matrix for the response variable
𝐷𝑟 Matrix containing the weighted univariate marginals (𝐷𝑟 = 𝐺𝑟′𝑊𝐺𝑟)
𝑢 𝑛-vector of ones
𝛽 Regression coefficients for the predictor variables
𝑦𝑟 Scaled categories for the response variable
𝑦𝑗 Scaled categories for the predictor variable 𝑗
20
After the data is discretized, as described in 2.3.1, the right scaling procedure must be chosen. If the categories are ordered and equally spaced, the numeric scaling level can be used. If there is an order between the categories but no equal spacing, the ordinal scaling level can be used. This way the order of the categories is preserved in the scaled variable. If the order of the categories is not of interest, the nominal scaling level can be used. If this scaling level is used, only the grouping into the categories is preserved. The scaling that is used is given in Table 4. For the migration rate the scaling is separately determined for every response variable by looking for the best fitting model.
After the data is scaled, there is assessed whether multicollinearity exists in the regression after the variables are scaled. Multicollinearity is the amount of linear correlation between variables. Low values of the correlations between the original and transformed variables indicate that there is no multicollinearity between variables. If there is moderate to strong
multicollinearity between two variables (correlation > 0.5), one of those variables can be
omitted from the analysis with only a minimal impact on the predictive behaviour of the model.
After there is made sure that there is no multicollinearity within the model, the output is further examined. For every predictor variable a F-test (J. C. Davis, 2002) is done to assess whether omission of the variable would significantly worsen the predictive capability of the model. If there are multiple predictors with statistically insignificant coefficients, they must be omitted one at a time before rerunning the model. This iterative process is repeated until there is a regression model where all predictors are significant for the predictive behaviour of
the model. The amount of variability that can be explained by the regression model is 𝑅² (6).
The (cumulative) change of this value is presented to show the effect of omitting predictor variables. Besides the regression coefficients it is important to look at the Importance and the Tolerance of the predictors. The Importance is calculated as Pratt’s measure of relative importance, which is the product of the regression coefficient and the zero-order correlation
divided by the squared multiple regression coefficient, 𝑅², to yield a total of 1 (Pratt, 1987).
Large individual importances relative to the other importances correspond to predictors that are crucial to the regression. The Tolerance quantifies how much the independent variables are linearly related to another. It is the proportion of a variable’s variance not accounted for by other independent variables. A value near 1 indicates that the variable cannot be predicted very well from the other predictors. A low value of the Tolerance means that the predictor contributes little information to the model. The value of the Tolerance is presented for the predictor variables before and after the scaling procedure has taken place.
Predictor variables are omitted and the algorithm is rerun until all variables have a significance value less than 0.1. The value of 0.1 is chosen instead of the more common 0.05, because the number of observations is limited and there is a lot of variability in the data. In the end, the goal of the statistical analysis is to have a regression model for each response variable where all remaining predictors are significant for the predictive capabilities of the model. The values of the Tolerance must be as high as possible with a minimum value
of 0.5 to make sure that there is not much collinearity between the predictors. The value of 𝑅²
does not matter because the main aim of the model is to describe the relationship between the predictors and the response variable (Frost, 2014). The aim is not to predict the response
variable. A low value of 𝑅² means that the error in a prediction based on the given regression
21
The results are shown in tables that summarize the iterations that were done to achieve the final model (Table 5). The first column shows the predictors that were used to build the
model. The columns labelled 𝑝 give the significance levels of the test that is conducted to
determine whether removal of that predictor significantly impacts the predictive capabilities of
the model. The column 𝛽 gives the regression coefficient for the predictors that are used in
the final model. The columns Importance and Tolerance give the values for Pratt’s
Importance and the Tolerance for the predictors. Furthermore, the values for 𝑅² and the
(cumulative) change of 𝑅2 are given to show the effect that omitting a variable has on the
model capabilities regarding the explanation of variability.
Table 5: example of table that shows CATREG output
Predictor 𝒑 𝒑 𝒑 𝒑 𝜷 Importance Tolerance
after before
A 0,010 0,008 0,003 0,001 0,480 0,400 0,956 0,932
B 0,250 0,222 0,390
C 0,400
D 0,002 0,001 0,002 0,000 0,535 0,600 0,854 0,932
E 0,160 0,300
𝑹𝟐 0,370 0,356 0,224 0,198 𝚫𝑹𝟐 -0,014 -0,132 -0,026 ∑𝚫𝑹² -0,014 -0,146 -0,172
The example shown in Table 5 shows that the analysis is started with 5 predictor variables, namely A, B, C, D and E. After four iterations only A and D are found to be significant. The value for the Importance shows that D is a bit more important than A, but the difference is not that big. The tolerance shows that there is little multicollinearity between the two variables.
The values of 𝛽 need to be assessed in combination with the corresponding transformation
plots. Figure 5 shows an example of a transformation plot. The categories 1, 2 and 3 of the original predictor variable are transformed to numeric values. The more positive or negative the value, the more effect that category has on the regression. A similar transformation plot
can be made for the response variable. The sign and value of 𝛽 in combination with the sign
and value of the transformed predictor category yields the effect on the response variable.
22
3. Results: selection and characterization
There are many tidal inlets systems present in the study area as defined in paragraph 1.3. 106 inlets were assessed for their suitability for this research. 45 tidal inlet systems are selected for further research (Table 6). Especially along the east coast and Gulf coast of the contiguous United States a lot of inlets were fixed by inlet and/or the shoreline was heavily urbanized. This was also the case on the Atlantic coast of Europe. The west coast of the United States was mostly rocky, so not much dunes could be found there. Little information could be found about dunes and inlets on the African coast and in some cases it was unclear if the dunes were really coastal dunes or just desert dunes near the coast.
The global overview of the selected inlets is given in appendix C. The characterization per inlet is presented in appendix D. The complete dataset with all raw and categorical data is given in appendix E.
Table 6: number of selected inlets compared to the total number of assessed inlets
Area Assessed Selected Main exclusion criteria
Europe Wadden coast 12 10 No dunes, but seawalls
Atlantic coast 14 5 No dunes present or
structures in the inlet
United States Atlantic coast 26 9 No dunes present or
structures in the inlet
Gulf coast 20 4 Structures in the inlet
Pacific coast 5 3 No dunes, mainly rocky
coast
Brazil 12 7 No dunes present
Australia 6 3 Structures in the inlet
Africa 17 3 No dunes present or no
information about inlet
Total 106 45
23
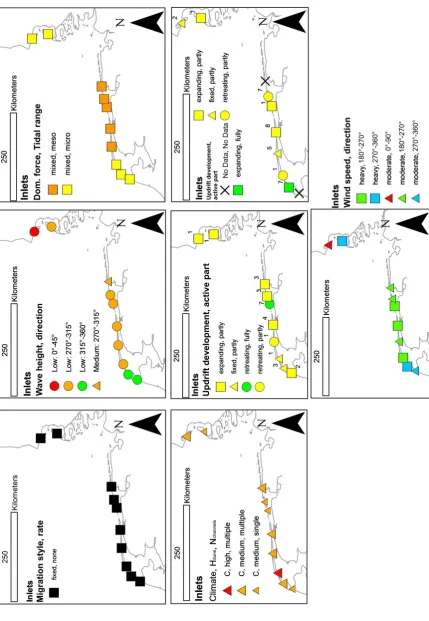
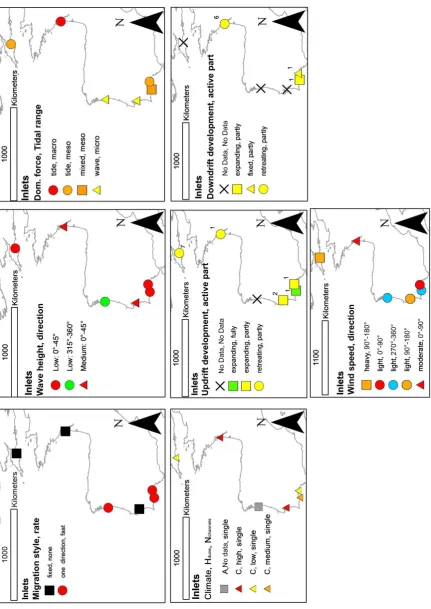
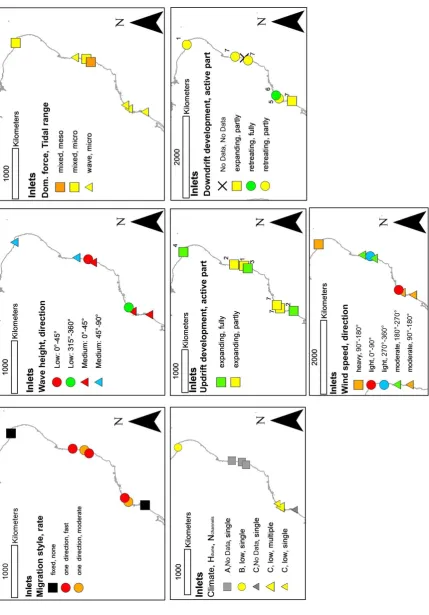
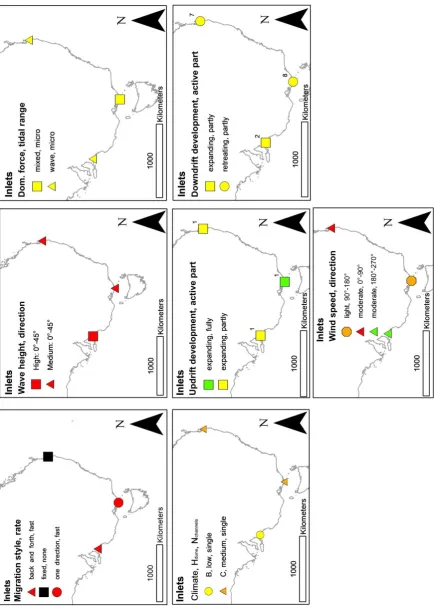
[image:24.595.84.514.107.729.2]3.1. Europe
24
25
[image:26.595.84.520.104.725.2]3.2. United States
26
27
28
[image:29.595.83.513.107.723.2]3.3. Brazil
29
[image:30.595.83.518.110.717.2]3.4. Australia
30
[image:31.595.85.517.106.727.2]3.5. Africa
31
4. Results: statistical analysis
The data from the different inlets is analysed to find relations between the behaviour of the tidal inlet system and the adjacent dune system(s). It is not feasible to assess all possible relations, so hypotheses are made. The hypothesized relations can be found in Table 7. The results of the statistical test on the hypotheses are shown in Table 15.
4.1. Hypotheses
[image:32.595.61.540.230.691.2]The hypotheses that are presented in this chapter are based on literature. Table 7 gives an overview of the hypothesized relations.
Table 7: hypothesized relations between responses and predictors
Response Hypothesized predictors
Development of the updrift dune system Migration style of the inlet
Dominant hydrodynamic forcing Mean significant wave height
Development of the downdrift dune system Migration style of the inlet
Dominant hydrodynamic forcing Mean significant wave height Mean wave direction
Extent of active part of updrift dune system Climate
Mean wind speed Mean wind direction Migration style of the inlet Mean significant wave height Extent of active part of downdrift dune system Climate
Mean wind speed Mean wind direction Migration style of the inlet Mean significant wave height
Maximum dune height Migration style of the inlet
Climate
Mean wind speed Mean wind direction
Vegetation cover of the updrift dune system Vegetation cover of the downdrift dune system Mean significant wave height
Vegetation cover of updrift dune system Migration style of the inlet
Climate
Mean wind speed Mean wind direction Dominant forcing
Vegetation cover of downdrift dune system Migration style of the inlet
Climate
Mean wind speed Mean wind direction Dominant forcing
32
style of the inlet (FitzGerald, 1996). The development of the downdrift dune system is hypothesized to be dependent on the migration style of the inlet, the dominant hydrodynamic forcing, the mean significant wave height and the mean wave direction. The mean wave direction is taken into account here because it has an influence on the littoral drift.
The extent of the active part is hypothesized to be dependent on the vegetation cover and the maximum dune height. The maximum dune height is hypothesized to be dependent on the vegetation cover, the climate, the wind, the migration style of the inlet and the mean significant wave height. This means that the extent of the active part is also dependent on those variables. Therefore, it is hypothesized that the extent of the active part of the updrift (downdrift) dune system is dependent on the climate, the mean wind speed, the mean wind direction, the migration style of the inlet and the mean significant wave height. The vegetation cover is not included as an hypothesized predictor, because the vegetation cover is only determined for the active part of a dune system, so the method of determining the vegetation cover and the extent of the active part are largely correlated.
Development of dune system is mainly governed by sediment supply and transport (Houser & Ellis, 2013). The sediment supply is partly dependent on the beach width (Sherman & Bauer, 1993), which is determined by the hydrodynamic forcing and migration of the inlet. If an inlet migrates, it leaves a sand flat in updrift direction. This sand flat will most probably become dry, because significant parts of the sand flat are only submerged during extreme events (van Heteren et al., 2006). A wider dry beach means that there is more potential for aeolian sand transport (Bauer & Davidson-Arnott, 2003). More onshore directed aeolian transport leads to more dune growth (Houser & Ellis, 2013). There are dune systems present along all tidal inlets that were assessed, so it is assumed that the mean wind speed and mean wind direction are such that there is enough sediment transport towards the backshore for dunes to develop.
The downdrift beach is becoming smaller due to the migration (Hayes & FitzGerald, 2013). The dune system on the downdrift side of the barrier is thus exposed to erosional processes. Dune erosion mainly takes place as a result of wave action (Sherman & Bauer, 1993).
Normally dunes mainly erode during storm surges (D’Alessandro & Tomasicchio, 2016), but
if the beach is eroded away by an inlet channel, the dunes are continuously exposed to wave action. This will lead to a retreat of the dune system.
33
al., 2016). This may lead to expansion of the downdrift dune system. Waves that come in obliquely to the coast lead to a current parallel to the shore, the so-called littoral drift (Davidson-Arnott, 2009). This leads to an asymmetrical ebb-tidal delta and to sand bypassing (de Swart & Zimmerman, 2009; Sha, 1989). The sediment that bypasses the inlet channel can be beneficial for the development of downdrift dune systems, because the sediment is transported towards the downdrift shore. Migration of tidal inlets is associated with obliquely incoming waves too (FitzGerald, 1996).
The part of the dune system where deposition or erosion of sediment takes place is called the active part of a dune system. The extent of the active part of the dune system is controlled by the vegetation cover of the dunes and the sediment transport (Houser & Ellis, 2013). If the vegetation is dense, the sediment will be deposited in a small strip along the backshore, while less dense vegetation allows the sediment to be transported further into the dune system (Arens, Baas, Van Boxel, & Kalkman, 2001). Overwash events also lead to the transport of sediment further into the dune system. Overwash occurs when storm waves overtop low dunes or when a dune ridge is breached (Davidson-Arnott, 2009). This means that the dune height has an influence on the frequency of occurrence of overwash. Dune systems with little vegetation and low dunes are thus probably completely active, while dune systems that have established dunes and more vegetation are only active at the most seaward dune ridge. Considering all this it is hypothesized that whether the dune system is completely or only partly active is dependent on the vegetation cover and the maximum dune height.
A dune can grow as long as it receives enough sediment and if there is vegetation to capture the sediment (Houser & Ellis, 2013). The supply of sediment is dependent on the wind speed, the wind direction and the width of the dry beach (Bauer & Davidson-Arnott, 2003). The width of dry beach is controlled by the migration style of the inlet (Hayes & FitzGerald, 2013) and the hydrodynamic forcing (The Open University, 1999a). Furthermore, rainfall and dampness of the air can hinder sediment transport (Hesp, 2012a). The largest dunes will occur at the backshore of dissipative beaches, while the smallest dunes occur at the backshore of reflective beaches. Whether a beach is dissipative, reflective or intermediate is controlled by the mean significant wave height (Short & Hesp, 1982). The occurrence of vegetation that is capable of trapping sediment is controlled by the climate and whether the vegetation can thrive with burial. If the first dune ridge is already largely vegetated, sediment will not be transported further into the dune system (Houser & Ellis, 2013). This will lead to stabilization of the older dune ridges (van Heteren et al., 2006). It is hypothesized that the maximum dune height in a dune system is controlled by the wind speed, wind direction, migration style of the inlet, the climate, the vegetation cover of the updrift and downdrift dune system and the mean significant wave height.
34
dunes are often more vegetated (Houser & Ellis, 2013). It is thus hypothesized that the vegetation cover on both the updrift and downdrift dune system can be predicted using the climate, the mean wind speed, the mean wind direction and the migration style of the inlet and the dominant forcing. The effect of the predictors on the response is probably different for updrift and downdrift system.
4.2. Categorical regression
The hypotheses formulated in the previous paragraph are tested whether they can be confirmed using statistical testing of the data collection (see paragraph 2.3.2). In this paragraph the main characteristics of the results are given. In appendix F the transformation plots are presented that show the original variables plotted against the transformed variables.
The values of 𝛽 are related to the transformed variables so they have to be examined
together with the transformation plots.
4.2.1. Results per response variable
The migration style of the inlet and the dominant hydrodynamic forcing are found to be significant for the development of the updrift dune system (Table 8). The dominant
hydrodynamic forcing is the most important of the two variables. The values of 𝛽 in
combination with the transformation plots (Figure 66, Figure 67 and Figure 68) tells us that an wave-dominated, migrating inlet has an expanding dune system. If an inlet is mixed-energy or tide-dominated, the probability of having an expanding dune system decreases. The same is true when an inlet is fixed or migrating back-and-forth.
Table 8: development of the updrift dune system
Predictor
𝒑 𝒑 𝜷 Importance Tolerance
after before
Migration style of
the inlet 0,004 0,000 0,318 0,381 1,000 0,999 Dominant hydrodynamic
forcing 0,015 0,026 -0,405 0,619 1,000 0,999 Mean significant
wave height 0,354
𝑹² 0,345 0,263
35
The development of the downdrift dune system was hypothesized to be dependent on four predictors, but only the mean wave direction proved to be significant (Table 9).
Table 9: development of the downdrift dune system
Predictor 𝒑 𝒑 𝒑 𝒑 𝜷
Migration style
of the inlet 0,340 0,276 0,341 Mean significant
wave height 0,202 0,282 Mean wave
direction 0,017 0,020 0,001 0,000 0,398 Dominant hydrodynamic
forcing 0,593
𝑹𝟐 0,291 0,271 0,193 0,158 𝚫𝑹𝟐 -0,02 -0,078 -0,035 ∑𝚫𝑹𝟐 -0,02 -0,098 -0,133
The extent of the active part of the updrift dune system was hypothesized to be dependent on five predictors, but only the climate and the migration style of the inlet were found to be significant (Table 10). The two significant predictors are of almost equal importance for the extent of the active part of the updrift dune system. When an inlet is migrating in one direction, it is more likely that the updrift dune system will be fully active (Figure 71).
Table 10: extent of the active part of the updrift dune system
Predictor 𝒑 𝒑 𝒑 𝒑 𝜷 Importance Tolerance
after before
Climate 0,008 0,002 0,001 0,001 0,471 0,415 0,654 0,932
Mean wind speed 0,220 0,111 0,361
Mean wind
direction 0,365 Migration style
of the inlet 0,001 0,000 0,002 0,005 0,505 0,584 0,654 0,932 Mean significant
wave height 0,156 0,119
36
[image:37.595.120.477.143.345.2]The extent of the active part of the downdrift dune system was also hypothesized to be dependent on five predictors, but only the mean wind direction proved to be significant (Table 11).
Table 11: extent of the active part of the downdrift dune system
Predictor 𝒑 𝒑 𝒑 𝒑 𝒑 𝜷
Climate 0,528 0,483 0,281 0,255
Mean wind
speed 0,921 Mean wind
direction 0,204 0,113 0,083 0,074 0,076 0,215 Migration style
of the inlet 0,453 0,557 0,577 Mean significant
wave height 0,738 0,731
𝑹𝟐 0,121 0,115 0,109 0,090 0,046 𝚫𝑹𝟐 -0,006 -0,006 -0,019 -0,044 ∑𝚫𝑹² -0,006 -0,012 -0,031 -0,075
The maximum dune height was hypothesized to be dependent on seven predictors and only four were significant (Table 12). The mean significant wave height is found to be of lesser importance than the other three significant predictors, which are all of almost equal importance. Migrating inlets lead to lower dunes. The same is true when there is an arid climate, lower wave heights and lower vegetation cover.
Table 12: maximum dune height
Predictor 𝒑 𝒑 𝒑 𝒑 𝜷 Importance Tolerance
after before
Migration style
of the inlet 0,062 0,006 0,000 0,000 0,468 0,290 0,822 0,986
Climate 0,156 0,012 0,001 0,002 0,514 0,282 0,688 0,887
Mean significant
wave height 0,257 0,012 0,019 0,007 0,455 0,054 0,609 0,881 Mean wind
speed 0,257 0,335
Mean wind
direction 0,419 0,267 0,154
Vegetation cover of the updrift
dune system 0,031 0,000 0,000 0,000 -0,486 0,374 0,954 0,938
Vegetation cover of the downdrift
dune system 0,928
[image:37.595.90.510.467.758.2]37
[image:38.595.93.505.157.374.2]The vegetation cover of the updrift dune system was hypothesized to be dependent on five predictor variables, but at the end only the migration style of the inlet and the mean wind direction proved to be significant (Table 13). The mean wind direction is the most important one. Wind that are blowing seaward are leading to more vegetation cover.
Table 13: vegetation cover of the updrift dune system
Predictor 𝒑 𝒑 𝒑 𝒑 𝜷 Importance Tolerance
after before
Migration style
of the inlet 0,065 0,035 0,040 0,067 0,244 0,201 0,985 0,996 Climate 0,304 0,082 0,152
Mean wind
speed 0,347 Mean wind
direction 0,008 0,003 0,001 0,000 0,445 0,799 0,985 0,996 Dominant
hydrodynamic forcing
0,233 0,392
𝑹𝟐 0,367 0,318 0,255 0,231 𝚫𝑹² -0,049 -0,063 -0,024 ∑𝚫𝑹² -0,049 -0,112 -0,136
The vegetation cover of the downdrift dune system was hypothesized to be dependent on five variables. Finally, two variables were found to be significant (Table 14): the climate and the mean wind direction. The climate is more important than the mean wind direction. Especially an arid climate leads to lower vegetation cover. Offshore winds lead to higher vegetation cover.
Table 14: vegetation cover of the downdrift dune system
Predictor 𝒑 𝒑 𝒑 𝒑 𝜷 Importance Tolerance
after before
Migration style
of the inlet 0,022 0,612
Climate 0,093 0,121 0,012 0,002 0,449 0,705 0,996 0,976
Mean wind
speed 0,363 0,508 0,506 Mean wind
direction 0,072 0,288 0,253 0,044 0,299 0,295 0,996 0,976 Dominant
hydrodynamic forcing
0,419
[image:38.595.99.506.498.718.2]38
4.2.2. Summary
[image:39.595.60.531.144.376.2]The relations that are given in the tables above are summarized in Table 15. The reason why ‘migration style of the inlet’ is in italic is given in chapter 5.
Table 15: overview of found relations between the response and predictor variables
Response variable Predictor variable
Development of the updrift dune system Migration style of the inlet
Dominant hydrodynamic forcing Development of the downdrift dune system Mean wave direction
Extent of the active part of the updrift dune system Climate
Migration style of the inlet
Extent of the active part of the downdrift dune system Mean wind direction
Maximum dune height Migration style of the inlet
Climate
Vegetation cover of the updrift dune system Mean significant wave height
Vegetation cover of the updrift dune system Migration style of the inlet
Mean wind direction Vegetation cover of the downdrift dune system Climate
39
5. Discussion: results of the statistical test
In the previous chapter a series of relations between the inlet behaviour and the dune behaviour were presented. Those relations are supported by the statistics and in this chapter the physical explanation is given based on published literature and the maps given in chapter 3. Overall, it can be said that the migration style of the inlet was the only variable that was directly connected to tidal inlet systems. The other significant variables are also present on straight coasts, but they may be influenced by the tidal inlet system (de Swart & Zimmerman, 2009; FitzGerald, 1996).
5.1. Development of the updrift dune system
[image:40.595.74.526.387.593.2]In Figure 14 the expansion of the downdrift dune system at Brigantine Inlet is shown. Brigantine Inlet is a wave-dominated, migrating inlet. The same behaviour can be seen at for example Pelican Inlet on the wave-dominated Gulf coast. From Figure 12 can be seen that the inlets in Australia do have different migratory behaviour, but all inlets are mixed-energy or wave-dominated and all updrift dune systems are expanding. Also all selected tidal inlets along the Brazilian coast (Figure 11) have an expanding updrift dune system, while there are no tide-dominated inlets. Two out of three tidal inlet systems along the US west coast (Figure 10), which are all wave-dominated, have expanding updrift dune systems too. The third tidal inlet does not have an updrift dune system. The two inlets along the European Atlantic coast with a retreating updrift dune system, namely Maumusson Inlet and Exmouth Inlet, are both tide dominated.
Figure 14: Brigantine Inlet, a wave dominated and migrating inlet, in 2016. The black line shows the border of the updrift dune system in 1984.
The behaviour as stated in the previous paragraph is supported by the outcome of the statistical analysis. The statistical test namely showed that the development of the updrift dune system is significantly controlled by the migration style of the inlet and the dominant hydrodynamic forcing.
40
beach geometry too (Short & Hesp, 1982), but this effect is most probably subordinate to the effects of the migration style and the dominant hydrodynamic forcing. This can explain why the mean significant wave height is not a significant predictor variable.
5.2. Development of the downdrift dune system
In Figure 15 the expansion of the updrift dune system at Hurricane Pass is illustrated. The waves come in obliquely from the west. Little Egg Inlet on the US east coast is an example of a fixed inlet where the waves come in very oblique to the coast. This inlet has an expanding downdrift dune system. This is in contrast with the downdrift dune systems at Jumpinpin Inlet and Murray Mouth which both have retreating downdrift dune system, while the waves are also coming in oblique to the coast. The same is true for Maumusson Inlet at the European Atlantic coast.
Figure 15: the updrift coast of Hurricane Pass, A mixed energy inlet with waves coming from 270°-315° with respect to shore normal, in 2017. The black line shows the border of the dune system in 1984.
The development of the downdrift dune system influenced by the mean wave direction according to the results of the statistical test. The migration style of the inlet, the dominant hydrodynamic forcing and the mean significant wave height are not significant variables according to the statistical test. The reason can be the variability in the data, because no clear examples can be found that support an significant influence of these variables.
5.3. Extent of the active part of the updrift dune system
The extent of the active part of the updrift dune system is dependent on the climate and the migration style of the inlet. On the west coast of the United States it can for example be seen that there is one inlet with a fully active updrift dune system and one inlet with a partly active updrift dune system. The inlet with the fully active dune system is migrating, while the other one is on a fixed position. A dune system can also be stabilized as a result of dune growth due to a migrating inlet. This happened on Moreton Island near Jumpinpin Inlet, where a transgressive dune field was stabilized due to the development of foredunes (Levin, Jablon, Phinn, & Collins, 2017). The effect of the climate can be seen clearest when looking at the updrift dune systems near inlet in tropical regions (Climate type A). All but one of these inlets is partly active.
41
active, but all categories of the mean wind direction are present there. Comparable observations can be made for the relation between the mean wind speed and the extent of the active part of the updrift dune system. Regarding the mean significant wave height it can also be seen that it seemingly does not matter whether the waves are high, medium or low.
5.4. Extent of the active part of the downdrift dune system
The extent of the active part of the downdrift dune system is dependent on the mean wind direction according to the statistical test. On the US east coast can clearly be seen that the inlet with wind from land are fully active, while the inlets with wind from the sea are only partly active. This is also true for two out of three inlets with a downdrift dune system along the European Atlantic coast.
The climate, the mean wind speed, the migration style and the mean significant wave height are not significant according to the statistical test. This is supported by the maps, because no clear examples that point towards a possible relations could be found regarding the four insignificant predictor variables.
The vegetation cover of a dune has a clear relation with the extent of the active part of the dune. When a dune is fully vegetated, deposition of sediment will only take place in the first row of vegetation, while sedimentation takes place over a broader area when the dune is less vegetated (Arens et al., 2001). This means that the dune system is only partly active when the level of vegetation cover is high. The vegetation cover as used in this research is determined as the cover of the active part of the dune system. Using the vegetation cover as a predictor for the extent of the active part would thus lead to biased results. This is why the vegetation cover is not used as a predictor for the extent of the active part.
5.5. Maximum dune height
The results from the statistical test show that the maximum dune height is significantly influenced by the migration style of the inlet, the climate, the vegetation cover of the updrift dune system and the mean significant wave height.
The two inlets with the highest dunes on the European Atlantic coast, namely Maumusson Inlet and Sado River Inlet, are both on a fixed position and have the largest mean significant wave height in that area.
The effect of the climate on the maximum dune height can be seen in the results from the characterization. There are only dunes in the highest category on locations with a temperate climate (C). In the arid (B) and tropical (A) climates only dunes from the lowest category were found.
42
is dependent on the local vegetation cover. No distinction is being made between updrift and downdrift dune systems.
The mean wind speed and the mean wind direction were not significant predictors for the maximum dune height. This can be due to the relatively high number of hypothesized predictors compared to the number of observations. The mean wind speed and mean wind direction were hypothesized, because they have an effect on the amount of aeolian transport into the dune system (Bauer & Davidson-Arnott, 2003). Aeolian transport mostly takes place in turbulent flow, so when the velocity field is fluctuating (Durán, Claudin, & Andreotti, 2011). This fluctuation is not taken into account when using the mean wind speed and mean wind direction. This can only be done using on site measurements.
5.6. Vegetation cover of the updrift dune system
The vegetation cover of the updrift dune system is significantly influenced by the mean wind direction and the migration style of the inlet. On the US east coast it is observed that the highest vegetation covers are present near fixed tidal inlet system with the wind coming from land. The highest vegetation cover at the European Atlantic coast is observed at Exmouth Inlet, which is an fixed tidal inlet system with a mean wind direction from the land too.
Texel Inlet is a prime example of an inlet where migration led to more vegetation of the updrift dune system. The southward migration of the inlet led to the development of new dune rows, which cut off the sediment supply towards the older dunes. The older dunes then became more vegetated and stabilized (van Heteren et al., 2006).
The effect of the wind direction and the migration style on the vegetation cover is mainly due to aeolian sediment transport and sedimentation rates on the dunes. It is clear that the sedimentation rate has an influence on the vegetation cover, but no clear quantitative relationship could be established (Keijsers et al., 2015).
5.7. Vegetation cover of the downdrift dune system
The vegetation cover of the downdrift dune system is influenced by the climate and the mean wind direction. Some observations about this can be made from the maps shown in chapter 3. The highest vegetation cover on downdrift dune systems at the Brazilian coast is found at locations with wind blowing from land. This is also the case at the US east coast.
Regarding the effect of the climate, especially the difference between the vegetation cover in a tropical and an arid climate are notable. This can be due to the difference in precipitation and temperature (Peel et al., 2007), which lead to different vegetation types (Houser & Ellis, 2013). The effect of the wind direction is analogous to the effect as described in the previous paragraph about the vegetation cover of the updrift dune system.