Original Article
Proteomics and bioinformatics analysis of mouse
hypothalamic neurogenesis with or without
EPHX2
gene deletion
Lijun Zhong1, Juntuo Zhou2, Dawei Wang3, Xiajuan Zou1, Yaxin Lou1, Dan Liu1, Bin Yang1, Yi Zhu4, Xiaoxia Li4 1Medical and Health Analytical Center, Peking University Health Science Center, Beijing 100191, China; 2Department of Pathology, Peking University Health Science Center, Beijing 100191, China; 3Institute of Cardiovascular Science, Peking University Health Science Center, Beijing 100191, China; 4Department of Physiology and Pathophysiology, Peking University Health Science Center, Beijing 100191, China
Received August 24, 2015; Accepted September 25, 2015; Epub October 1, 2015; Published October 15, 2015
Abstract: The aim of this study was to identify differently expressed proteins in the presence and absence of EPHX2
gene in mouse hypothalamus using proteomics profiling and bioinformatics analysis. This study was performed on
3 wild type (WT) and 3 EPHX2 gene global knockout (KO) mice (EPHX2-/-). Using the nano- electrospray ionization
(ESI)-LC-MS/MS detector, we identified 31 over-expressed proteins in WT mouse hypothalamus compared to the KO
counterparts. Gene Ontology (GO) annotation in terms of the protein-protein interaction network indicated that cellu-lar metabolic process, protein metabolic process, signaling transduction and protein post-translation biological pro-cesses involved in EPHX2-/- regulatorynetwork. In addition, signaling pathway enrichment analysis also highlighted
chronic neurodegenerative diseases and some other signaling pathways, such as TGF-beta signaling pathway, T cell receptor signaling pathway, ErbB signaling pathway, Neurotrophin signaling pathway and MAPK signaling pathway, were strongly coupled with EPHX2 gene knockout. Further studies into the molecular functions of EPHX2 gene in hypothalamus will help to provide new perspective in neurogenesis.
Keywords:EPHX2, hypothalamic neurogenesis, proteomics profiling, protein network
Introduction
Soluble epoxide hydrolase (sEH), a ubiquitously expressed predominantly cytosolic enzyme that encoded by EPHX2 gene, was found to be over expressed in liver, kidney, heart and ovary tissues [1]. Meanwhile, the epoxyeicosatrienoic acids or EETs have been reported to be impor-tant endogenous substrates for sEH which pro-duced by cytochrome P-450 epoxygenases [2]. As a ubiquitously hydrolytic enzyme, sEH can catalyze EETs into dihydroxyeicosatrienoic acids (DHETs), which are biologically less active [3]. By far, a growing body of evidence indicates that EETs play a series of benignant roles in
ischemia/reperfusion [4], inflammatory respon-se [5], fibrinolysis [6], tube formation [7] etc.
In brain, EETs have been identified to promote
vasodilatation, resulting in a protective effect against ischemia-induced tissue damage [8-10]. Besides, the stabilized EETs were also
found to antagonize inflammation via negative
regulation of nuclear factor-κB (NF-κB) [5]. Given the salutary effects of sEH deficiency, it global expression of proteins in tissues and flu -ids [11]. The proteins or peptides that are
pref-erentially expressed and identified pathological
state are well suited for diagnostic assays and medical treatment. In addition, with the rapid development of computational biology, rapid advances in network biology indicate that cel-lular is an attractive therapeutic target for sev-eral disorders [12-14]. Thus, insights into the physiological functions of sEH have emerged from studies in mice with global EPHX2 gene
deficiency or pharmacological inhibition of sEH,
which in turn intrigues curiosities of neuroscientists.
revolu-tionize our view of biology and disease
patholo-gies in the twenty-first century [15]. Systematic
mapping of protein-protein interactions net-works was initiated in model organisms,
start-ing with defined biological processes to pro -teome [16]. However, detailed network per-spective associated with sEH in hypothalamic neurogenesis is still unclear. Given the role of
sEH deficiency in neural systems and the lack
of proteomics based network biological studies related to sEH, the aim of our present study is
to extract the significantly expressed proteins
with or without EPHX2 gene knockout in mouse and explored the potential signaling pathways involved in EPHX2 gene. Detailed elucidations are as follows.
Materials and methods
Ethics statement
This experiment was conducted according to the Guide for the Care and Use of Laboratory Animals of the US National Institutes of Health (NIH Publication, 8th Edition, 2011) and approved by the Peking University Committee on Animal Care and Use. All surgeries were per-formed under sodium pentobarbital anesthe-sia, and all efforts were made to ameliorate animal suffering and euthanasia.
Animal models
Male C57BL/6 background mice (8-10 weeks
old, 20 ± 4 g body weight) with and without tar-geted disruption of EPHX2 gene (EPHX2-/-) were provided by Professor Yi Zhu at the department of physiology and pathophysiology in Peking
University [17]. Mice were housed individually
in air-conditioned facilities at room tempera-ture with 55 ± 5% humidity under 12:12 h light/
dark artificial cycle conditions, and supplied
with food and water ad libitum.
Protein sample processing
Mouse hypothalamic tissues were washed with chilled phosphate buffered saline (PBS) and
homogenized using a motor-driven glass-teflon
homogenizer. After centrifuging and boiling at 100°C for 5 min, proteins from hypothalamus were extracted. The concentration of whole
proteins was determined at 570 nm using the
bicinchoninic acid (BCA, Pierce, Rockford, IL, USA) assay kit. Proteins from three tubes of
EPHX2-/- and the control groups were pooled to
minimize individual variation. Protein samples (200 µg) from each group were processed per the manufacturer’s protocol for FASP (Filter
Assisted Sample Preparation, Mann). Briefly, to Vivacon 500 filtrate tube (Cat No. VNO1HO2,
Sartorius Stedim Biotech) containing protein concentrates, 100 µL of 8 M urea in 0.1 M Tris/ HCL, pH 8.5 (UA) was added and samples were centrifuged at 14,000 g for 15 min at room temperature. Then 10 µL of 0.05 M TCEP in
water was added to the filters and incubated at 37°C for 1 h. 10 µL of 0.1 M IAA in UA was added to the filters, and the samples were incu -bated for 30 min in darkness. Filters were washed twice with 200 µL of 50 mM NH4HCO3. Finally, 4 µg trypsin (Promega, Madison, WI) was added in 100 µL of 50 mM NH4HCO3 to
each filter. The protein to enzyme ratio was
50:1. Samples were incubated over night at
37°C and released peptides were collected by
centrifugation.
Protein separation
The digested peptide mixture was reconstitut-ed with 600 µL buffer A (20 mM ammonium formate in water, pH = 10) and loaded onto a 2.1 × 150 mm Waters XBridge BEH130 C18 col-umn containing 3.5 µm particles (Waters,
Milford, MA). The peptides were eluted at a flow
rate of 230 µL/min with a gradient of 5% buffer B (20 mM ammonium formate in 80% acetoni-trile, pH = 10) for 5 min, 1-15% buffer B for 15 min, 15-25% buffer B for 10 min, 25-55%
buf-fer B for 10 min, and finally 55-95% bufbuf-fer B for
5 min. The system was then maintained in 95% buffer B for 5 min before equilibrating with 1% buffer B for 8 min prior to the next injection. Elution was monitored by measuring absor-bance at 214 nm, and fractions were collected every 2 min. The eluted peptides were pooled as 15 fractions and vacuum-dried. Then sam-ples were ready for nano-ESI-LC-MS/MS analysis.
Liquid chromatography tandem mass spec-trometry (LC-MS/MS) analysis
The MS analysis experiments were performed
on a nano-flow HPLC system (Easy-nLC II, Thermo Fisher Scientific, USA) connected to a
LTQ-OrbitrapVelos Pro (Linear quadrupole ion trap-Orbitrap mass analyzer) mass
spectrome-ter (Thermo Fisher Scientific, Waltham, MA,
USA), equipped with a Nanospray Flex Ion
peptide mixtures were injected (5 μL) at a flow rate of 5 μL/min onto a pre-column
(Easy-column C18-A1, 100 μm I.D. × 20 mm, 5 μm, Thermo Fisher Scientific). The chromatographic
separation was performed on a reversed phase C18 column (Easy-column C18-A2, 75 μm I.D. × 100 mm, 3 μm, Thermo Fisher Scientific) at a flow rate of 300 nL/min with a 60 min gradient
of 2% to 40% acetonitrile in 0.1% formic acid. The electrospray voltage was maintained at 2.2 kV, and the capillary temperature was set at 250°C. The LTQ-Orbitrap was operated in the data dependent mode to simultaneously mea-sure full scan MS spectra (m/z 350-2000) in the Orbitrap with a mass resolution of 60,000 at m/z 400. After the completion of the full-scan survey, the 15 most abundant ions detect-ed in the full-MS scan were measurdetect-ed in the LTQ part by collision induced dissociation (CID), respectively.
Protein identification and quantization
As to the protein identification, data analysis
was performed using MaxQuant software (version 1.4.1.2, http://www.maxquant.org/).
Briefly, the raw MS/MS data were submitted to
the Uniprot human protein database (http://
www.uniprot.org/, release 3.43, 72,340
sequences) using the Andromeda search engine with the following settings: trypsin
cleav-age; fixed modification of carbamidomethyl
-ation of cysteine; variable modific-ations of oxi -dation of methionine; a maximum of two missed cleavages; the false discovery rate was calcu-lated by decoy data base searching. Label-free quantization was also performed in MaxQuant. The Min. ratio count for LFQ was set 2, and the match-between-runs option was enabled. Other parameters were set as default.
Raw data analytical procedures
All spectra were exported as plain-text files and the *.txt files were read using Perseus software
(version 1.5.0.3, http://www.perseus-frame-work.org/). Perseus, an architecture based on Windows. NET framework, was designed for the statistical analysis of omics data, such as
mRNA microarray [18]. Briefly, raw data were firstly processed to remove random noises,
subtract the low-frequency baseline, and detect and quantify individual sample peaks using the
filter function button. Log 2 based normalized
expression data was performed before
differ-ently expressed proteins identification.
Differentially expressed proteins identification
The differentially expressed proteins between the 3 couples of EPHX2-/- mice and the match- ed normal ones were assessed using two-sam-ple t test method as previously described [18]. The parameter p-value was adjusted for multi-ple testing corrections with p value cutoff of 0.0001. No further false discovery rate was used for multiple testing correction in this experiment.
K-means clustering and principal component analysis
A nonsupervised analysis of global gene expres-sion was performed using k-mean hierarchical clustering. Hierarchical clustering, also known as hierarchical cluster analysis or HCA, is a cluster analysis method which focuses on building a hierarchy of clusters using Agglomerative and Divisive strategies , such as Cluster 3.0 [19], NCSS statistical software, SPSS etc. In this study, cluster proteins with aberrant expression were agglomerated using
k-mean average linkage hierarchical clustering rule and delineated based on the Z score method.
Besides, an orthogonal transformation to the linearly uncorrelated variables of differently expressed proteins was also visualized using principal component analysis (PCA). PCA, a vari-ance-focused approach seeking to reproduce the total variable variance, creates variables that are linear combinations of the original
vari-ables and reflect both common and unique
variance of the variable using correspondence analysis. To better merit the heterogeneity of protein candidate between EPHX2 gene knock and the normal group, we performed a PCA analysis using SPSS for Windows (SPSS 18.0; SPSS, Chicago, IL, USA).
Protein-protein interaction network construc-tion
The protein to protein interaction network asso-ciated with EPHX2 was constructed as previ-ously described [20]. To infer a reliable network
from sEH to the possible proteins identified in
our proteomics analysis, proteins found in
pro-teomic analysis were used as seed to fish out
ucla.edu/dip/Main.cgi) [21], BIOGRID (Biolo-
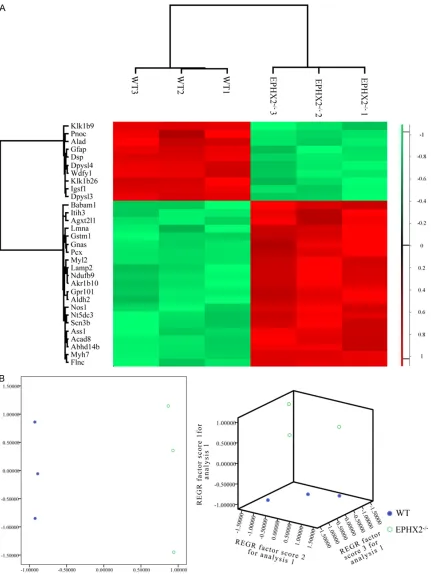
[image:5.612.92.523.70.650.2]gical General Repository for Interaction Da- tasets, http://thebiogrid.org/) [22], HPRD (Hu- man Protein Reference Database, http://www. Figure 2.K-means clustering (A) and principal component analysis (B) of the 31 proteins with different expression in EPHX2-/- (n = 3) compared with the vehicle groups (n = 3). Color key in the hierarchical clustering represents the
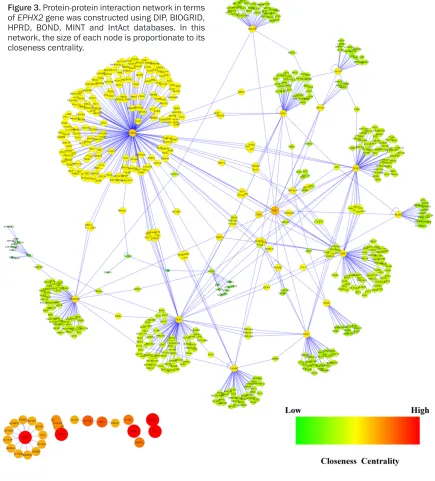
hprd.org/) [23], BOND (Bimolecular Object Net- work Database, http://bind.ca), MINT (Mole- cular Interaction database, http://mint.bio.uni-roma2.it/mint/Welcome.do) [24] and IntAct (http://www.ebi.ac.uk/intact/) [25]. The opti-mized network based on Steiner minimal tree algorithm was visualized in the Cytoscape envi-ronment [26]. Besides, nodes without connec-tions were removed from the integrated net-work and only the largest component was regarded as the protein-protein interaction net-work associated with sEH.
Gene ontology and pathway enrichment analy-sis
The BiNGO plugin [27] in Cytoscape environ -ment and DAVID web-server [28] (http://david.
abcc.ncifcrf.gov/) were used to retrieve the Gene Ontology Consortium (GOC, http:// geneontology.org/) [29] and Kyoto Encyclope- dia of Genes and Genomes (KEGG) [30] anno-tations for the protein to protein interaction network as previously described [31].
Results
31 proteins were found to be differently ex-pressed in mouse hypothalamic tissue with or without EPHX2 gene deletion
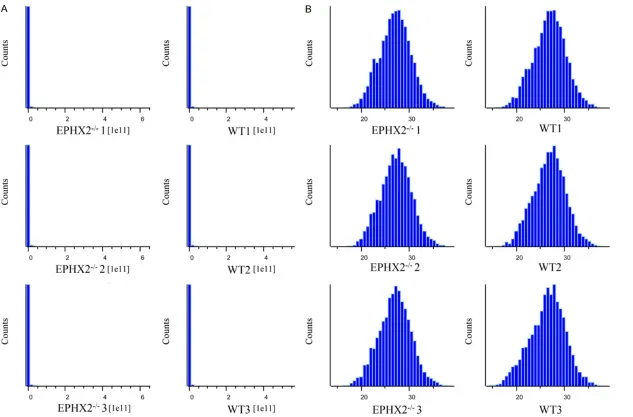
As a result, a total of 6,158 proteins were
iden-tified using shotgun method. A logarithm trans -formation (base 2) of the raw abundance of proteins was pre-performed before differently
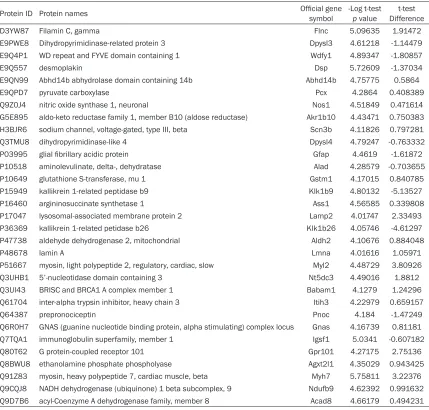
[image:6.612.93.522.95.505.2]expressed proteins identification (Figure 1). As Table 1. Identification of proteins associated in EPHX2(+/+)and EPHX2(-/-) mouse hypothalamus using ESI-LC-MS/MS
Protein ID Protein names Official gene symbol -Log t-test p value Differencet-test
D3YW87 Filamin C, gamma Flnc 5.09635 1.91472
E9PWE8 Dihydropyrimidinase-related protein 3 Dpysl3 4.61218 -1.14479
E9Q4P1 WD repeat and FYVE domain containing 1 Wdfy1 4.89347 -1.80857
E9Q557 desmoplakin Dsp 5.72609 -1.37034
E9QN99 Abhd14b abhydrolase domain containing 14b Abhd14b 4.75775 0.5864
E9QPD7 pyruvate carboxylase Pcx 4.2864 0.408389
Q9Z0J4 nitric oxide synthase 1, neuronal Nos1 4.51849 0.471614
G5E895 aldo-keto reductase family 1, member B10 (aldose reductase) Akr1b10 4.43471 0.750383
H3BJR6 sodium channel, voltage-gated, type III, beta Scn3b 4.11826 0.797281
Q3TMU8 dihydropyrimidinase-like 4 Dpysl4 4.79247 -0.763332
P03995 glial fibrillary acidic protein Gfap 4.4619 -1.61872
P10518 aminolevulinate, delta-, dehydratase Alad 4.28579 -0.703655
P10649 glutathione S-transferase, mu 1 Gstm1 4.17015 0.840785
P15949 kallikrein 1-related peptidase b9 Klk1b9 4.80132 -5.13527
P16460 argininosuccinate synthetase 1 Ass1 4.56585 0.339808
P17047 lysosomal-associated membrane protein 2 Lamp2 4.01747 2.33493
P36369 kallikrein 1-related petidase b26 Klk1b26 4.05746 -4.61297
P47738 aldehyde dehydrogenase 2, mitochondrial Aldh2 4.10676 0.884048
P48678 lamin A Lmna 4.01616 1.05971 P51667 myosin, light polypeptide 2, regulatory, cardiac, slow Myl2 4.48729 3.80926
Q3UHB1 5’-nucleotidase domain containing 3 Nt5dc3 4.49016 1.8812
Q3UI43 BRISC and BRCA1 A complex member 1 Babam1 4.1279 1.24296
Q61704 inter-alpha trypsin inhibitor, heavy chain 3 Itih3 4.22979 0.659157 Q64387 prepronociceptin Pnoc 4.184 -1.47249 Q6R0H7 GNAS (guanine nucleotide binding protein, alpha stimulating) complex locus Gnas 4.16739 0.81181
Q7TQA1 immunoglobulin superfamily, member 1 Igsf1 5.0341 -0.607182
Q80T62 G protein-coupled receptor 101 Gpr101 4.27175 2.75136
Q8BWU8 ethanolamine phosphate phospholyase Agxt2l1 4.35029 0.943425
Q91Z83 myosin, heavy polypeptide 7, cardiac muscle, beta Myh7 5.75811 3.22376
Q9CQJ8 NADH dehydrogenase (ubiquinone) 1 beta subcomplex, 9 Ndufb9 4.62392 0.991632
shown in Figure 2A and Table 1, we found a total of 31 differently expressed proteins. 2D and 3D PCA (Figure 2B) also indicated that those 31 proteins had an excellent ability to dis-criminate mouse models with or without EPHX2
gene deletion and could be used as phenotypic discriminators.
Protein-protein interaction regulatory network construction
To infer a protein-protein interaction network associated with sEH, we matched the 31 differ-ently expressed genes with 6 public available
warehouses to link the known regulatory data between transcriptional factors and the target genes. Totally, we obtained a cohort of 685
nodes and 768 relationships, and the integrat -ed regulatory network was visualiz-ed using Cytoscape 2.8.3 (Figure 3).
Enrichment of the biological processes
[image:7.612.88.523.76.557.2]To further extend our knowledge about the reg-ulatory network associated with sEH, we enriched the large list of proteins for functional annotation using BiNGO plugin. As demonstrat-ed in the Figure 4, the biological processes in Figure 3. Protein-protein interaction network in terms
term of Gene Ontology suggested that EPHX2
gene was highly correlated with cellular meta-bolic process, protein metameta-bolic process, signaling transduction and protein post- translation.
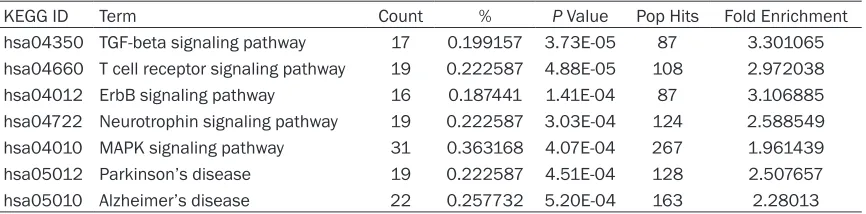
Signaling pathways enrichment analysis
To analyze the whole lists of proteins and better understand the functional annotation involved
in EPHX2, differently expressed proteins were
submitted to the DAVID Bioinformatics
Resources 6.7 for signaling pathway enrich -ment analysis in terms of KEGG. In this study, we chose the p-value less than 0.001 as the cut-off criterion for canonical pathways. As a result, TGF-beta signaling pathway, T cell recep-tor signaling pathway, ErbB signaling pathway, Neurotrophin signaling pathway, MAPK signal-ing pathway, Parkinson’s disease and Alzheimer’s disease seem to be aberrant in
EPHX2-/-mouse. All the detailed pathways were
[image:8.612.97.517.72.576.2]listed in Table 2. Figure 4. Gene Ontology (GO)
terms associated with EPHX2
Discussion
High throughput proteomics, in terms of vast amount of proteins, offers highly information towards biology [32]. However, owing to the
complexity of biological system, it is difficult to
identify and understand the entire proteins well. With the development of sophisticated separation techniques, mass spectrometry (MS)-based high throughput proteomics becomes a core instrumentation for proteins characterization due to its high sensitivity [33]. In the present study, shotgun proteomics meth-od was intrmeth-oduced for protein analysis in a high-throughput way [34]. Interactome network bas-ing on high throughput data, as well as its inte-gration with disease phenotype, has been reported to be a conventional technology for
the identification of disease-specific biomark -ers, such as cancer [35]. Recently, Diederick et al. [36] discovered FASN, XPO1, ENO1 and PDCD61P were novel biomarkers for prostate cancer progression using a nanoLC and LTQ-Orbitrap-MS/MS mode. Similarly, Shen and
col-leagues [37] also revealed SSP411 was a
band-new biomarker for cholangiocarcinoma,
sug-gesting the high throughput proteomics profil -ing was a valuable tool for cancer biomarkers
identification and diagnosis. Besides, pro -teomics analysis was also considered to be a powerful for neurodegeneration diagnosis [38]. In 2014, Liguori et al. detected the
cerebrospi-nal fluid proteomic profiles in Multiple Sclerosis
(MS) patients basing on the Matrix Assisted Laser Desorption Ionization Time of Flight (MALDI-TOP) mass spectrometer. They
conclud-ed Secretograin II and Protein 7B2 were highly expressed in clinically definite MS patients
compared to the progressive ones. In addition,
Tymosin β4 was also found to be aberrant in
clinically isolated syndrome and relapsing remitting (RR) MS patients, suggesting the
pro-teomic profiling technique in combination with
the mass spectrometry evaluation provided useful and important information to improve our understanding of the complex pathogene-sis of MS.
Previous animal studies have indicated that
EPHX2 gene deletion or treatment with sEH
inhibitors results in increased levels of EETs and protection against stroke-induced brain damage [39]. Oxidative stress is hypothesized to play a major role in Alzheimer’s disease. Epoxides are potentially reactive intermediates formed that contribute to cytotoxic damage mediated by oxidative stress [40]. In chronic neurodegenerative diseases, epoxide
hydro-lase were found to be significantly elevated in
the hippocampus and associated cortex in Alzheimer’s disease patients [41]. In agree-ment with the results of previous studies, KEGG based pathway enrichment analysis also
con-firmed that Neurotrophin signaling pathway,
Parkinson’s disease and Alzheimer’s disease highly are strongly coupled with sEH. As an indispensable section of the brain, hypothala-mus governed hormone production and regu-lated homeostasis. Hypothalamic hormones include thyrotropin-releasing, gonadotropin-releasing, growth hormone-gonadotropin-releasing, cortico-trophin-releasing, somatostatin, and dopamine hormones, which are released into the blood and link the nervous system to the endocrine system via hypophysis.
A number of documents proved that sEH inhibi-tors possessed protective effects in ischemic or cardiovascular disease. In 2010, Simpkins and colleagues discovered 12-(3-adamantan-1-yl-ure-ido)-dodecanoic acid, an inhibitor of
sEH, could significantly improve the increment
of inward remodeling. In addition, mice with
EPHX2 deletion enhanced inward vascular
[image:9.612.91.524.84.191.2]remodeling induced by carotid ligation [42]. Besides, using sEH-knockout mice, Xiaocui et
Table 2. The enriched KEGG signaling pathways in DAVID Bioinformatics Resource (P ≤ 0.001)
KEGG ID Term Count % P Value Pop Hits Fold Enrichment hsa04350 TGF-beta signaling pathway 17 0.199157 3.73E-05 87 3.301065 hsa04660 T cell receptor signaling pathway 19 0.222587 4.88E-05 108 2.972038
hsa04012 ErbB signaling pathway 16 0.187441 1.41E-04 87 3.106885
hsa04722 Neurotrophin signaling pathway 19 0.222587 3.03E-04 124 2.588549 hsa04010 MAPK signaling pathway 31 0.363168 4.07E-04 267 1.961439 hsa05012 Parkinson’s disease 19 0.222587 4.51E-04 128 2.507657
al. also discovered sEH deficiency and inhibi -tion could decrease 1-methyl-4-phenyl-1,2,3,6-tetrahydro pyridine (MPTP)-treated mice via
activating AKT signaling pathway to protect dopamine neurons (Xiaocui et al., 2014). In view of this, insights into the physiological func-tions of sEH have emerged from studies in mice with global EPHX2 gene deficiency or pharma -cological inhibition of sEH, which in turn
pro-vides beneficial effects in blood pressure [43],
cardiovascular [44], renal [45] in murine models.
Many studies have shown that alternations of neuropeptides from hypothalamic pituitary axis resulted in neurodegenerative diseases, such as Huntington’s disease [46]. Besides, post-mortem studies pointed out that dopamine concentrations in the hypothalamus were
involved in Parkinson’s disease [47]. More
recently, 18F-dopa based positron emission tomography (PET) also discovered the hypotha-lamic monoamine storage capacity decreased in patients with idiopathic Parkinson’s disease, which was in agreement with the postmortem observations [48].
Pathway enrichment analysis also indicated that TGF-beta signaling pathway, T cell receptor signaling pathway, ErbB signaling pathway and MAPK signaling pathway were engaged in
EPHX2 gene deficiency. However, detailed rela
-tions associated with EPHX2 gene and these
regulatory pathways still lacks and undefined.
In summary, we identified 31 significantly
expressed proteins in mouse hippocampus using proteomics analysis and constructed a protein-protein interaction network associated with EPHX2 gene knockout. Our study may shed new lights for sEH in the chronic neurode-generative diseases, like Parkinson’s disease and Alzheimer’s disease.
Acknowledgements
We wish to thank Prof. Yi Zhu for the generous gift of the wild type and EPHX2-/-mouse. Disclosure of conflict of interest
None.
Address correspondence to: Dr. Xiaoxia Li, De- partment of Physiology and Pathophysiology, Peking
University Health Science Center, 38 Xueyuan Road, Haidian District, Beijing 100191, China. E-mail: [email protected]
References
[1] Wu C, Macleod I and Su AI. BioGPS and MyGene.info: organizing online, gene-centric information. Nucleic Acids Res 2013; 41: D561-565.
[2] Karara A, Dishman E, Blair I, Falck JR and Capdevila JH. Endogenous epoxyeicosatrieno-ic acids. Cytochrome P-450 controlled stere-oselectivity of the hepatic arachidonic acid epoxygenase. J Biol Chem 1989; 264:
19822-19827.
[3] Spector AA and Norris AW. Action of epoxyeico-satrienoic acids on cellular function. Am J
Physiol Cell Physiol 2007; 292: C996-1012.
[4] Nithipatikom K, Moore JM, Isbell MA, Falck JR and Gross GJ. Epoxyeicosatrienoic acids in car-dioprotection: ischemic versus reperfusion in-jury. Am J Physiol Heart Circ Physiol 2006;
291: H537-542.
[5] Node K, Huo Y, Ruan X, Yang B, Spiecker M,
Ley K, Zeldin DC and Liao JK. Anti-inflammatory
properties of cytochrome P450 epoxygenase-derived eicosanoids. Science 1999; 285:
1276-1279.
[6] Node K, Ruan XL, Dai J, Yang SX, Graham L, Zeldin DC and Liao JK. Activation of Galpha s mediates induction of tissue-type plasminogen activator gene transcription by
epoxyeicosatri-enoic acids. J Biol Chem 2001; 276:
15983-15989.
[7] Munzenmaier DH and Harder DR. Cerebral mi-crovascular endothelial cell tube formation: role of astrocytic epoxyeicosatrienoic acid re-lease. Am J Physiol Heart Circ Physiol 2000;
278: H1163-1167.
[8] Amruthesh SC, Falck JR and Ellis EF. Brain syn-thesis and cerebrovascular action of epoxy-genase metabolites of arachidonic acid. J Neurochem 1992; 58: 503-510.
[9] Gebremedhin D, Gopalakrishnan S and Harder DR. Endogenous events modulating myogenic regulation of cerebrovascular function. Curr
Vasc Pharmacol 2014; 12: 810-817.
[10] Gebremedhin D, Ma YH, Falck JR, Roman RJ, VanRollins M and Harder DR. Mechanism of action of cerebral epoxyeicosatrienoic acids on cerebral arterial smooth muscle. Am J Physiol 1992; 263: H519-525.
[11] Harry JL, Wilkins MR, Herbert BR, Packer NH, Gooley AA and Williams KL. Proteomics: capac-ity versus utilcapac-ity. Electrophoresis 2000; 21:
1071-1081.
as a pharmaceutical target for hypertension. J
Cardiovasc Pharmacol 2007; 50: 225-237.
[13] Zhang W, Koerner IP, Noppens R, Grafe M, Tsai HJ, Morisseau C, Luria A, Hammock BD, Falck JR and Alkayed NJ. Soluble epoxide hydrolase: a novel therapeutic target in stroke. J Cereb
Blood Flow Metab 2007; 27: 1931-1940.
[14] Imig JD and Hammock BD. Soluble epoxide hy-drolase as a therapeutic target for cardiovas-cular diseases. Nat Rev Drug Discov 2009; 8:
794-805.
[15] Barabasi AL and Oltvai ZN. Network biology: understanding the cell’s functional organiza-tion. Nat Rev Genet 2004; 5: 101-113. [16] Rual JF, Venkatesan K, Hao T,
Hirozane-Kishikawa T, Dricot A, Li N, Berriz GF, Gibbons FD, Dreze M, Ayivi-Guedehoussou N, Klitgord N, Simon C, Boxem M, Milstein S, Rosenberg J, Goldberg DS, Zhang LV, Wong SL, Franklin G, Li S, Albala JS, Lim J, Fraughton C, Llamosas E, Cevik S, Bex C, Lamesch P, Sikorski RS, Vandenhaute J, Zoghbi HY, Smolyar A, Bosak S, Sequerra R, Doucette-Stamm L, Cusick ME, Hill DE, Roth FP and Vidal M. Towards a pro-teome-scale map of the human protein-protein
interaction network. Nature 2005; 437: 1173-1178.
[17] Li L, Li N, Pang W, Zhang X, Hammock BD, Ai D
and Zhu Y. Opposite effects of gene deficiency
and pharmacological inhibition of soluble
ep-oxide hydrolase on cardiac fibrosis. PLoS One
2014; 9: e94092.
[18] Li J, Fan S, Han D, Xie J, Kuang H and Ge P.
Microarray gene expression profiling and bioin -formatics analysis of premature ovarian failure
in a rat model. Exp Mol Pathol 2014; 97:
535-541.
[19] de Hoon MJ, Imoto S, Nolan J and Miyano S. Open source clustering software. Bioin- formatics 2004; 20: 1453-1454.
[20] Feng LX, Jing CJ, Tang KL, Tao L, Cao ZW, Wu WY, Guan SH, Jiang BH, Yang M, Liu X and Guo DA. Clarifying the signal network of salvianolic acid B using proteomic assay and
bioinformat-ic analysis. Proteombioinformat-ics 2011; 11: 1473-1485.
[21] Salwinski L, Miller CS, Smith AJ, Pettit FK, Bowie JU and Eisenberg D. The Database of Interacting Proteins: 2004 update. Nucleic Acids Res 2004; 32: D449-451.
[22] Breitkreutz BJ, Stark C, Reguly T, Boucher L, Breitkreutz A, Livstone M, Oughtred R, Lackner DH, Bahler J, Wood V, Dolinski K and Tyers M. The BioGRID Interaction Database: 2008
up-date. Nucleic Acids Res 2008; 36: D637-640.
[23] Keshava Prasad TS, Goel R, Kandasamy K, Keerthikumar S, Kumar S, Mathivanan S, Telikicherla D, Raju R, Shafreen B, Venugopal A, Balakrishnan L, Marimuthu A, Banerjee S, Somanathan DS, Sebastian A, Rani S, Ray S,
Harrys Kishore CJ, Kanth S, Ahmed M, Kashyap MK, Mohmood R, Ramachandra YL, Krishna V, Rahiman BA, Mohan S, Ranganathan P, Ramabadran S, Chaerkady R and Pandey A. Human Protein Reference Database--2009
up-date. Nucleic Acids Res 2009; 37: D767-772.
[24] Licata L, Briganti L, Peluso D, Perfetto L, Iannuccelli M, Galeota E, Sacco F, Palma A, Nardozza AP, Santonico E, Castagnoli L and Cesareni G. MINT, the molecular interaction database: 2012 update. Nucleic Acids Res
2012; 40: D857-861.
[25] Aranda B, Achuthan P, Alam-Faruque Y, Armean I, Bridge A, Derow C, Feuermann M, Ghanbarian AT, Kerrien S, Khadake J, Kerssemakers J, Leroy C, Menden M, Michaut M, Montecchi-Palazzi L, Neuhauser SN, Orchard S, Perreau V, Roechert B, van Eijk K and Hermjakob H. The IntAct molecular interaction database in 2010. Nucleic Acids Res 2010; 38: D525-531. [26] Shannon P, Markiel A, Ozier O, Baliga NS,
Wang JT, Ramage D, Amin N, Schwikowski B and Ideker T. Cytoscape: a software environ-ment for integrated models of biomolecular interaction networks. Genome Res 2003; 13: 2498-2504.
[27] Maere S, Heymans K and Kuiper M. BiNGO: a Cytoscape plugin to assess overrepresentation of gene ontology categories in biological net-works. Bioinformatics 2005; 21: 3448-3449. [28] Huang da W, Sherman BT and Lempicki RA.
Systematic and integrative analysis of large gene lists using DAVID bioinformatics
resourc-es. Nat Protoc 2009; 4: 44-57.
[29] Ashburner M, Ball CA, Blake JA, Botstein D, Butler H, Cherry JM, Davis AP, Dolinski K, Dwight SS, Eppig JT, Harris MA, Hill DP, Issel-Tarver L, Kasarskis A, Lewis S, Matese JC, Richardson JE, Ringwald M, Rubin GM and
Sherlock G. Gene ontology: tool for the unifica -tion of biology. The Gene Ontology Consortium. Nat Genet 2000; 25: 25-29.
[30] Kanehisa M and Goto S. KEGG: kyoto encyclo-pedia of genes and genomes. Nucleic Acids
Res 2000; 28: 27-30.
[31] Fan S, Pan Z, Geng Q, Li X, Wang Y, An Y, Xu Y, Tie L, Pan Y and Li X. Layered signaling regula-tory networks analysis of gene expression in-volved in malignant tumorigenesis of non-re-solving ulcerative colitis via integration of
cross-study microarray profiles. PLoS One 2013; 8: e67142.
[32] Lesley SA. High-throughput proteomics:
pro-tein expression and purification in the postge -nomic world. Protein Expr Purif 2001; 22: 159-164.
[33] Zhang Z, Wu S, Stenoien DL and Pasa-Tolic L. High-throughput proteomics. Annu Rev Anal
[34] Nogueira FC and Domont GB. Survey of shot-gun proteomics. Methods Mol Biol 2014; 1156: 3-23.
[35] Srinivas PR, Srivastava S, Hanash S and Wright GL Jr. Proteomics in early detection of cancer.
Clin Chem 2001; 47: 1901-1911.
[36] Duijvesz D, Burnum-Johnson KE, Gritsenko MA, Hoogland AM, Vredenbregt-van den Berg MS, Willemsen R, Luider T, Pasa-Tolic L and
Jenster G. Proteomic profiling of exosomes leads to the identification of novel biomarkers
for prostate cancer. PLoS One 2013; 8: e82589.
[37] Shen J, Wang W, Wu J, Feng B, Chen W, Wang M, Tang J, Wang F, Cheng F, Pu L, Tang Q, Wang
X and Li X. Comparative proteomic profiling of
human bile reveals SSP411 as a novel bio-marker of cholangiocarcinoma. PLoS One
2012; 7: e47476.
[38] Liguori M, Qualtieri A, Tortorella C, Direnzo V, Bagala A, Mastrapasqua M, Spadafora P and
Trojano M. Proteomic profiling in multiple scle -rosis clinical courses reveals potential bio-markers of neurodegeneration. PLoS One 2014; 9: e103984.
[39] Sura P, Sura R, Enayetallah AE and Grant DF. Distribution and expression of soluble epoxide hydrolase in human brain. J Histochem Cytochem 2008; 56: 551-559.
[40] Pohanka M. Alzheimer s disease and oxidative stress: a review. Curr Med Chem 2014; 21: 356-364.
[41] Liu M, Sun A, Shin EJ, Liu X, Kim SG, Runyons CR, Markesbery W, Kim HC and Bing G. Expression of microsomal epoxide hydrolase is elevated in Alzheimer’s hippocampus and in-duced by exogenous beta-amyloid and
trimeth-yl-tin. Eur J Neurosci 2006; 23: 2027-2034.
[42] Simpkins AN, Rudic RD, Roy S, Tsai HJ, Hammock BD and Imig JD. Soluble epoxide hy-drolase inhibition modulates vascular remod-eling. Am J Physiol Heart Circ Physiol 2010;
298: H795-806.
[43] Imig JD, Zhao X, Capdevila JH, Morisseau C and Hammock BD. Soluble epoxide hydrolase inhibition lowers arterial blood pressure in an-giotensin II hypertension. Hypertension 2002; 39: 690-694.
[44] Motoki A, Merkel MJ, Packwood WH, Cao Z, Liu L, Iliff J, Alkayed NJ and Van Winkle DM. Soluble epoxide hydrolase inhibition and gene deletion are protective against myocardial ischemia-reperfusion injury in vivo. Am J Physiol Heart Circ Physiol 2008; 295: H2128-2134.
[45] Zhao X, Yamamoto T, Newman JW, Kim IH, Watanabe T, Hammock BD, Stewart J, Pollock JS, Pollock DM and Imig JD. Soluble epoxide hydrolase inhibition protects the kidney from hypertension-induced damage. J Am Soc Nephrol 2004; 15: 1244-1253.
[46] Politis M, Pavese N, Tai YF, Tabrizi SJ, Barker RA and Piccini P. Hypothalamic involvement in Huntington’s disease: an in vivo PET study. Brain 2008; 131: 2860-2869.
[47] Javoy-Agid F, Ruberg M, Pique L, Bertagna X, Taquet H, Studler JM, Cesselin F, Epelbaum J and Agid Y. Biochemistry of the hypothalamus in Parkinson’s disease. Neurology 1984; 34:
672-675.