Amy Challen, Philip Noden,
Anne West
and Stephen
Machin
UK resilience programme evaluation: final
report
Report
Original citation:
Challen, Amy, Noden, Philip, West, Anne and Machin, Stephen (2011) UK resilience programme evaluation: final report. Research reports, DFE-RR097. Department for Education, London, UK. Originally available from Department for Education, London, UK.
This version available at: http://eprints.lse.ac.uk/51617/
Available in LSE Research Online: October 2014
© 2011 Enterprise LSE Ltd.
Available under Open Government Licence v.2.0
LSE has developed LSE Research Online so that users may access research output of the School. Copyright © and Moral Rights for the papers on this site are retained by the individual authors and/or other copyright owners. Users may download and/or print one copy of any article(s) in LSE Research Online to facilitate their private study or for non-commercial research. You may not engage in further distribution of the material or use it for any profit-making activities
or any commercial gain. You may freely distribute the URL (http://eprints.lse.ac.uk) of the LSE
Research Report DFE-RR097
UK Resilience
Programme
Evaluation:
Final Report
This research report was commissioned before the new UK Government took office on 11 May 2010. As a result the content may not reflect current Government policy and may make reference to the Department for Children, Schools and Families (DCSF) which has
now been replaced by the Department for Education (DFE).
ACKNOWLEDGEMENTS
We gratefully acknowledge the contribution of the Local Authority staff and of all the school staff and pupils involved in this evaluation.
We also owe thanks to Dr. Karen Reivich and Dr. Jane Gillham of the Penn Resiliency Project, who provided extremely valuable advice on the evaluation design.
EVALUATION OF THE UK RESILIENCE PROGRAMME
There are increasing concerns about children’s well-being in the UK, their behaviour, and the low academic attainment of a large fraction of the population.1 The Every Child Matters
agenda stressed schools’ potential and duty to promote pupils’ well-being. In September 2007, three local authorities (South Tyneside, Manchester and Hertfordshire) piloted a programme with Year 7 pupils in 22 of their schools, with the aim of building pupils’ resilience and promoting their well-being: the UK Resilience Programme. More schools have since started teaching the programme.
This evaluation aims to investigate whether the programme (previously trialled in small samples) can be delivered at scale; whether it has an impact on children’s well-being, behaviour, attendance and academic attainment.
The first interim report was published in April 2009 and gives an overview of the UK Resilience Programme and its implementation, describes the evaluation, and offers preliminary findings about programme impact, as well as detailed case studies on the first year of programme implementation. The report also contains a bibliography and descriptions of previous research on the Penn Resiliency Program (the curriculum on which UKRP is based), and describes the curriculum in detail.
The Second Interim Report was published in June 2010 and contains detailed case studies from the third year of implementation, as well as updated information about programme impact.
In this final report we will refer back to the two interim reports2, which provide more detail
and background information.
The First Interim Report can be found online at:
http://www.education.gov.uk/publications//eOrderingDownload/DCSF-RR094.pdf
The Second Interim Report can be found online at:
http://www.education.gov.uk/publications/eOrderingDownload/DFE-RR006.pdf
The qualitative work for this report was carried out by Dr. Philip Noden and Prof. Anne West.3
The quantitative work is by Amy Challen4 and Prof. Stephen Machin5.
1 See, for example, the recent UNICEF report “An overview of child well-being in rich countries” which puts the UK at the bottom of a list of 21 advanced countries:
http://www.unicef-irc.org/publications/pdf/rc7_eng.pdf
2 Referred to as Challen et al. (2009) and Challen et al. (2010). All three evaluation reports are by the same authors.
3 Both Education Research Group, Department of Social Policy, London School of Economics and Political Science.
4 Centre for the Economics of Education and Centre for Economic Performance, London School of Economics and Political Science.
5 Centre for the Economics of Education and Centre for Economic Performance, London School of Economics and Political Science, and Department of Economics, University College London.
CONTENTS
1.
Executive
Summary
4
2.
Policy
and
Delivery
Implications 6
3.
The
UK
Resilience
Programme
8
4.
The
Evaluation
Design
13
5.
Quantitative
Analysis
16
Summary
of
quantitative
findings
16
Data
collection
17
Explanation
of
measures
18
Treatment
and
control
groups
20
Programme impact on symptoms of depression
22
Programme impact on symptoms of anxiety
29
Behaviour
30
Life
satisfaction
31
Absence
from
school
32
Academic
attainment
33
Conclusion
35
Implementation
and
policy
issues
37
Tables
39
6.
Qualitative
Findings
63
Summary
of
qualitative
findings 63
Data
and
methods
64
Brief description of the UKRP
65
Pupils’ reported use of the UKRP skills
66
Participants’ reflections on the UKRP
73
Organisation of the UKRP
within
schools
76
Conclusion
79
7.
Appendix
A:
Questionnaires
used
82
8. Appendix B: References for empirical evaluations of PRP
83
and UKRP
1. Executive Summary
Evaluation of the UK Resilience Programme, Final Report
The UK Resilience Programme (UKRP) aims to improve children’s psychological well-being by building resilience and promoting accurate thinking. Three local authorities launched it in the academic year 2007-08, with workshops delivered to Year 7 pupils in secondary schools. This report presents findings from the UKRP evaluation, commissioned by the Department for Children, Schools and Families (now the Department for Education).
Methodology
Information on pupils’ well-being was collected through questionnaires administered to pupils who had participated in the first year of UKRP workshops and to a control group. Pupils were surveyed before and after the programme. The quantitative work examines the impact on the original cohort of pupils (those in workshops in 2007-08) over a three year period. In addition, interviews with pupils, facilitators (workshop leaders) and school managers were carried out in 10 of the 22 secondary schools involved in the programme at the end of the academic year 2007-08, and follow-up interviews were carried out in 9 of these 10 schools in the autumn term of 2009-10. The interviews explore participants’ experiences of the programme, and how schools were implementing the programme in the pilot year and then two years later.
Key findings
• The quantitative work found a significant short-term improvement in pupils’ depression symptom scores, school attendance rates, and academic attainment in English. There was some impact on anxiety scores and maths attainment, but this was inconsistent and concentrated in a few groups of pupils.
• The size of the impact varied by how workshops were organised. Weekly workshops showed a larger impact than those timetabled fortnightly.
• The impact also varied by pupil characteristics. Pupils who were entitled to free school meals; who had not attained the national targets in English or maths at Key Stage 2; or who had worse initial symptoms of depression or anxiety; were all more likely to experience a larger measured impact of the workshops on their depression and anxiety scores. There was little difference by pupil characteristics on the absence rate.
• On average the effect of the workshops lasted only as long as the academic year, and had faded by the one-year follow-up questionnaire in June 2009. However, there was still an impact for certain groups at follow-up, particularly for pupils who had not attained the national target levels in English or maths at Key Stage 2. There was no impact on any of the outcome measures by the two-year follow-up in June 2010.
• There was no measured impact of workshops on behaviour scores or life satisfaction scores.
• Return visits to nine of the case study schools in autumn 2009 revealed that seven of the nine schools were continuing to deliver the UKRP to all Year 7 pupils.
• Facilitators were extremely positive about the ideas underlying the programme and about the training they had received. Most reported that they used the skills themselves.
• Facilitators found the curriculum materials too didactic and thought they could be improved.
• Pupils were generally positive about the programme. Interviews for the First Interim Report suggested that pupils had applied UKRP skills in real life situations, and some interviewees showed a good understanding of elements of the programme.
2. Policy and Delivery Implications
Here we list potential policy implications of the results presented in this report and the findings of the interim reports. These are aimed at schools or local authorities which use the programme or are considering doing so. Many of these points should be seen as considerations rather than recommendations, but they do highlight issues around the implementation of the programme.
1) The UK Resilience Programme did have a small average impact on pupils’ depression scores, school attendance, and English and maths grades, but only in the short run (up to one-year follow-up). There was no average impact on any measure at two-year follow-up. This means that any improvements in pupils’ psychological well-being, attendance and attainment were short-lived, and by the time of the two-year follow-up (June 2010) pupils who had participated in UKRP workshops were doing no better on these outcomes than pupils who had not. This suggests that a single set of UKRP lessons is not enough to permanently change pupils’ outcomes on average.
2) The impact of the programme varied by pupil characteristics, and was much stronger for more deprived and lower-attaining pupils and those who started the year with worse psychological health, particularly girls with these characteristics. Thus even if there is no average impact of the programme beyond the short run (i.e. an impact when measured over all pupils), it appears that some pupils benefitted substantially more, and for longer. These findings suggest that the improvements experienced by these pupils were more likely to be meaningful in terms of the impact on their lives, perhaps longer term as well as in the short run.
3) While our quantitative findings suggest there was initially a statistically significant gain in the mental health and well-being of pupils, and many interviewees believed the programme was having a positive impact on their pupils, schools and facilitators should keep in mind the possibility that the programme could have a negative effect for individual pupils.
4) A preferred model of delivery for the UKRP, based on the recommendations of the course developers and the findings of this study, might involve 18 weekly sessions delivered to groups of no more than 15 pupils.
5) For the UKRP to thrive within schools it is extremely important that the programme has backing from the school’s senior management.
6) This backing is all the more important when schools face competing pressures such as the need to improve standards of attainment. This may also prove to be the case in relation to financial pressures on schools, for example, if there is a deterioration in pupil: adult ratios.
7) There was evidence of a drift, in some schools, towards the programme being delivered by members of the school auxiliary staff. This will clearly reduce the size of the pool from which facilitators may be drawn which would have an impact on the quality of staff who may train as facilitators.
8) The role of facilitator can be emotionally demanding due to the distressing nature of some real life problems raised by pupils. Staff need to be adequately prepared for and supported throughout the programme in order to deal with these issues.
9) Facilitators were very positive about the quality of training they had received for the UKRP. They had reservations however about the quality of teaching materials provided
for the programme. If the materials are not regarded as being of a sufficiently high quality, facilitators may seek alternative resources and clearly this may constitute a threat to programme fidelity.
10) The UKRP was intended to be a universal programme, but some schools have chosen to target pupils for inclusion in workshops. It is not clear which model is preferable, and this will probably depend on the situation of each school. However, the following points are worth bearing in mind:
• Based on the quantitative analysis, certain groups of pupils appeared to benefit more from the workshops, particularly those who did not achieve the national target level in English and maths at Key Stage 2, pupils with SEN, and pupils who started the school year with higher levels of depression or anxiety symptoms.
• However, the measured impact on these pupils is the impact of the programme delivered to ‘universal’ or mixed workshop groups, not of groups consisting entirely of targeted pupils. One cannot therefore assume that the same impact would be obtained if workshop groups were targeted.
• Although facilitators and other school staff often appeared to assume that higher ability pupils were naturally more resilient, or had fewer problems, almost all facilitators claimed to use the UKRP skills themselves. It therefore seems unlikely that higher ability pupils or those with better initial psychological well-being would be unable to benefit from the skills.
• Even if pupils were to be targeted for inclusion in workshops, it is important that they should be targeted appropriately. Previous research suggests that school staff tend to identify pupils with behaviour problems rather than those with emotional difficulties, yet the programme is primarily designed to address the latter. The process of targeting would also need to be carefully considered.
• Participation in programmes perceived to be targeted and remedial can attract stigma for those who participate. Universal programmes avoid this.
• The measures used in the quantitative evaluation are sensitive to differences in the severity of symptoms of depression and anxiety, but are not good at distinguishing between children who have few or no symptoms. For instance, they would not be able to detect any improvements in well-being for pupils who showed no initial symptoms of depression, although this would not necessarily mean that these children did not benefit.
• The skills pupils used most (as reported by both pupils and facilitators) were the interpersonal skills around negotiation and assertiveness, and techniques for self-control (see Chapters 5 & 6 of the First Interim Report). Since all pupils are likely to experience conflict and problems around everyday social interactions it is likely that all pupils could benefit from the workshops, at least in these areas.
3. The UK Resilience Programme
The UK Resilience Programme is the UK implementation of the Penn Resiliency Program, a well-being programme that has been trialled more than 13 times in different settings. The UKRP was taught from September 2007 in three participating local authorities, and those workshops that took place in mainstream schools form the subject of this evaluation.
This section outlines the PRP curriculum used and its implementation in the UK, with particular reference to the evaluation.
The Penn Resiliency Program
The Penn Resiliency Program (PRP) is a curriculum developed by a team of psychologists at the University of Pennsylvania. Its original aim was to prevent adolescent depression, but it now has a broader remit of building resilience and promoting realistic thinking, adaptive coping skills and social problem-solving in children. The primary aim of the programme is to improve psychological well-being, but it is possible that any such improvement could also have an impact on behaviour, attendance and academic outcomes. Thirteen controlled trials have found PRP to be effective in helping protect children against symptoms of anxiety and depression, and some studies have found an impact on behaviour. The skills taught in PRP could be applied in many contexts, including relationships with peers and family members, and achievement in academic or other activities.6
PRP is a manualised intervention comprising 18 hours of workshops. (“Manualised” means that no additional materials or resources are required to lead the workshops.) The curriculum teaches cognitive-behavioural and social problem-solving skills. Central to PRP is Ellis's
Activating-Belief-Consequences model that beliefs about events mediate their impact on
emotions and behaviour.7 PRP participants are encouraged to identify and challenge
(unrealistic) negative beliefs, to employ evidence to make more accurate appraisals of situations and others’ behaviour, and to use effective coping mechanisms when faced with adversity. Participants also learn techniques for positive social behaviour, assertiveness, negotiation, decision-making, and relaxation.
The manualised nature of the curriculum and the intensive training required before using it allows facilitators to be drawn from a wide range of professions and agencies including teachers, learning mentors, teaching assistants, psychologists and health professionals. The training for the original cohort of teachers lasted around 8-10 days, with the first half of the course focusing on teaching trainees the adult-level Cognitive Behavioural Therapy (CBT) skills, and the second week on familiarising them with the students’ curriculum and practising how to communicate it to pupils.8
6 Some PRP studies have found some effects on behaviour (e.g. Jaycox et al. 1994; Roberts et al. 2003), and academic attainment has not yet been evaluated in a (published) PRP study, although we will examine both of these outcomes. The grounds for believing that the programme could have an impact on behaviour, peer relationships and academic attainment are the suggested links between these outcomes and psychological well-being (see, for example, Kaslow, Rehm and Siegel, “Social-Cognitive and “Social-Cognitive Correlates of Depression in Children”, Journal of Abnormal Child Psychology,
1984). Moreover, social skills feature prominently in the PRP curriculum, and these are the skills most commonly said to be used by pupils, according to pupils and facilitators (see Sections 5 and 6 of the First Interim Report, Challen et al. 2009).
7 See, for example, Ellis’s “Emotional Disturbance in a Nutshell”: http://www.rebt.org/emo_disturbance.pdf (accessed 17/02/11)
8 More recent training events for the PRP have been cut down to 5-7 days.
Additional information on the content of each PRP lesson can be found in Annex C of the First Interim Evaluation Report, Challen et al. (2009).
Additional information on PRP can be found online at:
http://www.ppc.sas.upenn.edu/prpsum.htm
Summary of PRP Research
Overall, the controlled trials that have been conducted of PRP suggest that it could prevent symptoms of depression and anxiety in universal, targeted and clinic samples, and some studies have found some evidence of a reduction in disruptive behaviour (see e.g. Jaycox et al. 1994; Roberts et al. 2003; most studies did not measure behaviour). However, there are some inconsistent findings, and a meta-analysis of the PRP research, which includes both published and unpublished research, finds very mixed results across studies (Brunwasser, Gillham & Kim, 2009). Some studies found no effect on depressive symptoms, while others found an effect on some groups but not others. In an earlier review of the PRP studies (Gillham, Brunwasser & Freres, 2008), the PRP team further find a link between measured impact and the level of training and supervision of the workshop facilitators, suggesting that despite the manualised curriculum, facilitator quality is important and treatment heterogeneity (differences in the quality of the programme delivered) is likely. In addition, the
sample sizes used in prior PRP studies are relatively small, and scaling-up is a common evaluation problem, with the efficacy of an intervention frequently decreasing as the number of subjects involved increases.9
For a bibliography of empirical evaluations of PRP and UKRP please see Appendix B below.
For a more detailed summary of previous research on PRP, please see Annex B at the end of the First Interim Report (Challen et al., 2009), an executive summary of the programme and research by members of the Penn team who developed the programme.
UK implementation
The UK Resilience Programme is the first larger-scale use of the PRP curriculum. It was first implemented in 2007-08 as 18 hours of workshops for Year 7 children in 22 UK secondary schools, along with additional workshops with children of similar ages in other settings such as Pupil Referral Units and special schools. The first year of workshops involved around 2000 pupils.
Subsequently, some of the original schools have gone on to offer workshops to subsequent cohorts of pupils, and some have had additional staff members trained in teaching the programme. Additional schools, which were not involved in the first year of workshops, have started teaching the programme, while some of the original UKRP schools no longer do so.
However, only the workshops which took place in 2007-08 in the 22 mainstream secondary schools are the subject of this evaluation.
9 See, for example, Weisz, Donenberg, Han & Weiss (1995), “Bridging the gap between laboratory and clinic in child and adolescent psychotherapy”, Journal of Consulting and Clinical Psychology, 63, 688-701.
Curriculum materials
The American curriculum materials required ‘translation’ into British English. LA staff read the materials and suggested changes, then these were looked over again by a British children’s author. As many cultural references as possible were changed, but in some cases this would have involved changing artwork so it was not possible. The result was a set of materials that was largely anglicised but still had an American feel, and these were the materials used in the first year of workshops.
Further changes have been made since the first year of workshops, and more changes have been proposed to address issues such as cultural fit and teaching style.
Selection
Schools
Three local authorities opted to become involved in the UK Resilience Programme, and in December 2006 they made presentations to potentially interested schools to promote the programme. In some cases this was to a selected group of schools the LA thought would be most interested and most appropriate for the intervention; in others all local secondary schools were invited to get involved. Not all eligible schools chose to take up the programme. In addition, schools had to abide by certain restrictions when timetabling workshops. These included ensuring that only trained staff were timetabled to teach the subject, and that classes did not contain more than 15 pupils, resulting in a doubling of staffing and rooms for these classes for most schools. These could be difficult conditions to meet, and so might increase the self-selection of schools into the programme.
Facilitators
The first cohort of 90 workshop facilitators was trained in Philadelphia in the United States from 23rd July to 3rd August 2007. The majority were teachers, but other staff included
learning mentors, teaching assistants, local authority staff and one school nurse. About 65 facilitators were school-based, while almost all of the others were employed by the local authorities. Interested schools were allocated a number of places by their local authority and the selection procedure for facilitators varied by school. In some schools particular individuals were offered places by the senior manager responsible, while in others all staff were invited to apply and then a selection procedure took place. A number of schools did not fill their places, and there were other places offered to staff outside of schools such as local authority officers. Facilitators were thus largely self-selected, although some also had to go through a selection procedure at their school and others were strongly encouraged to participate despite their reluctance to volunteer. Once selected, future facilitators registered and completed an online positive psychology program called Resilience Online.10 This
introduced them to the principles of CBT, and encouraged reflection on their own emotional responses and behaviour. A few people were unable to attend the training in Philadelphia for health or other reasons, and some of these places were filled at the last minute by others from within the local authority.
Thus in practice, schools and local authorities were selected. Facilitators were also self-selected, although some may also have had some selection imposed by their school. Because of the absence of centralised selection, and of the involvement of the PRP team, one might expect that facilitator quality would be more variable than if an open application
10 See for details: http://www.reflectivelearning.com/
system had been used. However, the self-selection might result in facilitators being particularly highly motivated (perhaps increasing the success of the workshops), making it harder to extrapolate results outside of the sample. Facilitators were asked to give up the first two weeks of their summer holidays in order to train in Philadelphia, and had to prepare a large amount of new material in order to teach the workshops. One would therefore expect that these individuals and schools were highly motivated and enthusiastic, and had a strong belief in the importance of the subject being taught. This could limit the validity of extrapolating our results outside of the sample, as other participants might not be so committed.
In subsequent years the training has been scheduled to require less holiday time and more term time, requiring head teachers to agree to provide cover for their staff while they are on the training course. The number of days of training has also been reduced each year, and now stands at about 5-7 days. However, it still requires participants to give up some weekends or holidays in order to participate.
Training
As mentioned above, the training of the first cohort of facilitators took 10 days (five days of training, a weekend off, then another five days’ training). In the first week trainees became familiar with the adult-level CBT skills, and in the second week they studied the PRP curriculum and practised teaching it to others.
Because of cancelled flights, one LA group arrived late and missed the first three days of training. The trainers worked with them to catch up on material missed, but it was felt that they did not receive the same social experience as those who had arrived four days earlier.
Workshops
Most schools had already planned how to deliver the workshops before the end of the summer term 2007, but some had not, and many had to form or revise their plans in September. They were asked to form UKRP groups of not more than 15 pupils, and to schedule the classes during the normal school day. The majority timetabled the programme by splitting an ordinary teaching class in two to get two UKRP groups taught by two facilitators simultaneously, but there were variations on how this was achieved. Many schools did not include as many pupils in workshops as they had originally intended, and there were only seven schools that managed to include all Year 7 pupils. This was achieved by having some workshops facilitated by trained LA staff, with the exception of one school with an unusually small Year 7 intake which used only their own staff and yet managed to cover the full year group. Another school used class sizes larger than 15 in order to include all Year 7 pupils.
Two schools were unable to start workshops until January 2008 due to problems involving timetabling and/or the support of senior management. Almost all of the others started their first workshops in September, with the rest starting in October. This varied within school as well as by school. Two schools were obliged to restart their workshops at October half term, because the lessons that the groups were timetabled against were setted (e.g. science set 3), and teachers had decided that the initial settings based on Key Stage 2 results and primary school reports were not appropriate. One school came across this problem but did not change the sets in order to preserve the UKRP groups.
Most schools taught lessons of one hour, and since the UK Resilience Programme was meant to be timetabled for a minimum of 18 hours this would normally take up about half a year of lessons. Some schools taught this fortnightly, meaning that their workshops lasted all
year, and some weekly, with the first set of workshops finishing around February or March. Many of the latter schools then went on to do a second set of workshops which lasted until July.
In most cases, UKRP lessons were fitted into an already full Year 7 timetable, and schools chose different lessons to replace. In the large majority of cases this was PSHE/citizenship/Learning to Learn, but some schools replaced other lessons such as English or science.
There were some changes of workshop facilitators during the year, due to departure of the facilitator; illness; and maternity leave. These workshop groups were taken over by other facilitators. There were also pupils who changed workshop group, because of class or set changes or behaviour issues, although these were relatively few.
Supervision and support
Facilitators teaching workshops were asked to participate in a series of nine one-hour conference calls with a PRP trainer and approximately 10 other facilitators, to provide continued support and training once they had started the workshops. Calls were weekly or fortnightly at the start of the year, becoming less frequent as time went on. Attendance on these calls was generally good, but after the first few calls most facilitators did not find them to be particularly helpful in offering support.
Some schools chose to use team teaching in the first year of workshops, in order to provide greater support to staff teaching the unfamiliar curriculum for the first time. This was particularly popular with facilitators who were learning mentors, as they were less likely to have experience of teaching classes or large groups. In most schools facilitators met regularly (formally or informally) to discuss their workshops, and in some cases facilitators would plan lessons together. Again, this was particularly popular where one facilitator was not a teacher. Each LA also held termly meetings, but these were more for organisation than for support.
Further cohorts
The second cohort of 67 workshop facilitators was trained in Cambridge (UK), from 16th to
25th July 2008. The training period was shortened to eight days, and several new schools
sent staff to be trained, in addition to staff from the original schools and LA staff.
A third year of training took place separately in each LA in July 2009, with about 160 staff trained over eight days. Subsequent training has taken place from July 2010, involving 5-7 days of training for at least 160 more staff, and training places for a further 140 staff are planned for 2011.11
The staff trained subsequent to 2007 have run further workshops in schools and in other contexts such as children’s homes and Pupil Referral Units, but these workshops will not be evaluated by LSE.
11 The reduction in training time is not as great as it appears: the original 10-day training course consisted of short days of 9am to 3pm, partly to accommodate the jetlag of the majority of participants. Subsequent training sessions have used longer days.
4. The Evaluation Design
As mentioned above, the PRP curriculum has been evaluated a number of times, but in small samples and with a high degree of control from the developers of the curriculum. Since a major problem in policy evaluation can be a decline in programmes’ efficacy after scaling up (i.e. what happens when a small, select programme is rolled out), it is hard to draw any conclusions about whether these programmes would function well if used in schools more widely. The total sample of students involved in previous evaluated interventions was roughly 2000, which is about the same size as the workshop group in this evaluation. This evaluation therefore adds considerably to the evidence on the efficacy of the PRP curriculum.
Design
The evaluation has been designed as a controlled trial, with ‘treatment’ (i.e. workshop) and control pupils in each of the 22 participating schools.12 Pupils could not be randomised into
treatment or control groups because of timetable constraints, but the schools agreed that the method of selecting which pupils received workshops should be arbitrary, e.g. choosing the form group that fitted the timetable slot available, rather than choosing pupils they thought would benefit most. It was hoped that this would result in ‘as-if’ randomisation, with workshop and control pupils being similar on observable and unobservable characteristics. However, this is not true statistical randomisation and we will use statistical testing to determine whether it has in fact worked. When splitting a class in two to make a workshop group, schools also agreed to do this in an arbitrary way e.g. alphabetically.
Control groups
Those schools which wished to include all of their Year 7 pupils in workshops (seven schools) used the year-ahead group as the control group. In order to obtain baseline (start of Year 7) measures from these pupils they would have had to be surveyed in September 2006, before the project had begun. Because of this, only measures taken when the pupils were at the end of Year 7 are available for this group: we have no baseline for them, only a follow-up measure. Those schools with within-year control groups will have baseline measures for both workshop and control pupils. Six schools have both within-year and year-ahead control groups, and the remaining nine schools have a within-year control group only (see Table 1 for details by local authority, and Table 2 for details by workshop timing).
There is a possibility of externalities or spillovers, where workshop participants within a school influence the outcomes of those not involved in workshops through social interactions or other channels. Positive spillovers would bias downwards the estimate of the effect of the programme. Depending on the mechanism through which externalities operate, it is possible that the two control groups will produce different results if, for instance, the main channel is through pupils’ peer interactions and these are more likely to occur within a year group than between year groups.
There are no control pupils outside of the workshop schools. This is not necessarily a problem, as the most appropriate control group is arguably made up of pupils in the same school. However, if programme schools are different from other schools (e.g. more
12 We will use the language of ‘treatment’ and ‘control’ throughout, as this is the standard terminology in our field of research for any policy intervention. It is not meant to suggest that the UKRP was a true psychological treatment administered to those deemed to be in need of it, and indeed this was not the case.
concerned about pupil well-being) it is possible that this would understate or overstate the programme effect, as (for instance) they might have a positive effect on pupil well-being in the control group independently of the programme.
There are roughly 2000 children in the workshop group for the UKRP evaluation and up to 4000 in the pooled controls.
Table 1: Control and Treatment group details by Local Authority
LA 1 LA 2 LA 3 Total
UKRP schools 6 9 7 22
Programme Cohort Year 7 (2007-8) Year 7 (2007-8) Year 7 (2007-8) Year 7 (2007-8)
Year 7 Coverage 33-100% 15-70% 11-100% 49%
Workshop pupils (#) 755 516 681 1952
Control group: Year 7 162 1137 714 2013
Control group: Year 8 960 130 1063 2153
Control group: pooled 1122 1267 1777 4166
Facilitators 30 24 32 86
Facilitators who taught
[image:17.595.43.548.385.582.2]evaluation workshops 24 23 24 71
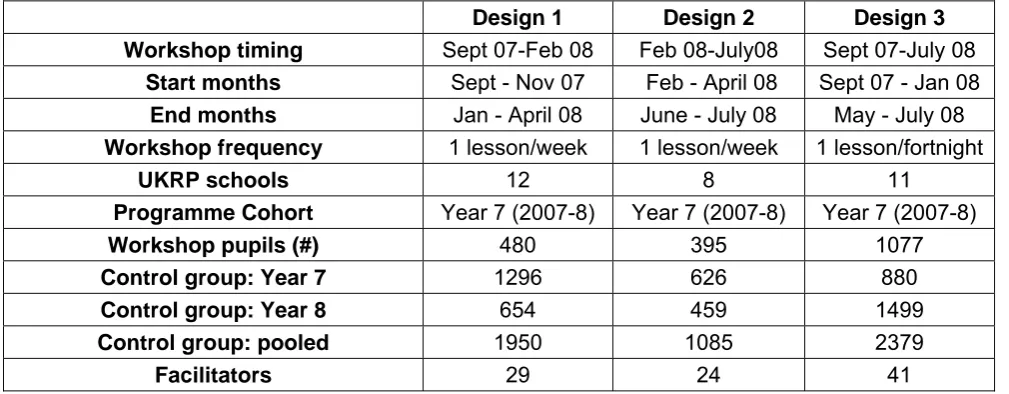
Table 2: Control and Treatment group details by workshop timing and design
Design 1 Design 2 Design 3
Workshop timing Sept 07-Feb 08 Feb 08-July08 Sept 07-July 08
Start months Sept - Nov 07 Feb - April 08 Sept 07 - Jan 08
End months Jan - April 08 June - July 08 May - July 08
Workshop frequency 1 lesson/week 1 lesson/week 1 lesson/fortnight
UKRP schools 12 8 11
Programme Cohort Year 7 (2007-8) Year 7 (2007-8) Year 7 (2007-8)
Workshop pupils (#) 480 395 1077
Control group: Year 7 1296 626 880
Control group: Year 8 654 459 1499
Control group: pooled 1950 1085 2379
Facilitators 29 24 41
Note: schools, facilitators and control group pupils will sum to more than the totals reported in Table 2 because schools ran multiple workshops and many of these had different timings. For instance, schools that ran workshops from September – February (design 1) often went on to run another set from February – July (design 2).
Alternative treatments
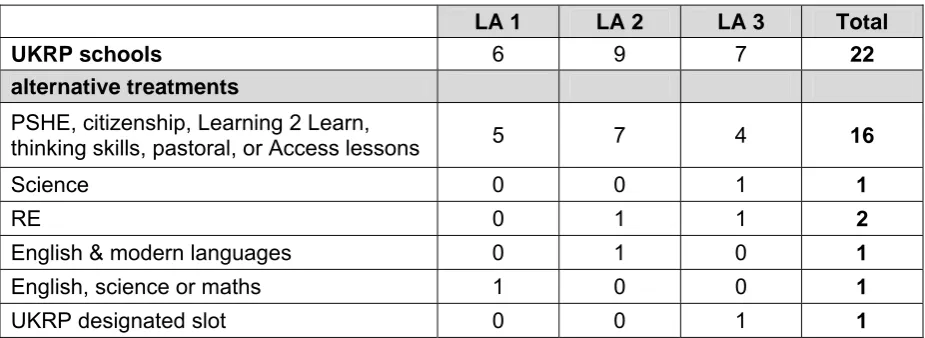
Since schools have had to make room for UKRP workshops within an already full curriculum, control group pupils will have received some lessons that treated pupils will not. In most cases this will be 18 hours of the Year 7 PSHE curriculum, but some schools displaced other lessons such as English, science or maths (see Table 3 for details). One school was reorganising its timetable and as part of this created a new UKRP slot, so there is no direct comparison in the control group. Moreover, class sizes for UKRP groups were not meant to be larger than 15 (and in 80% of classes this was the case), whereas in most cases the alternative treatment had class sizes of around 30.
Table 3: Alternative treatments by Local Authority (# of schools)
LA 1 LA 2 LA 3 Total
UKRP schools 6 9 7 22
alternative treatments
PSHE, citizenship, Learning 2 Learn,
thinking skills, pastoral, or Access lessons 5 7 4 16
Science 0 0 1 1
RE 0 1 1 2
English & modern languages 0 1 0 1
English, science or maths 1 0 0 1
UKRP designated slot 0 0 1 1
Measurement
Pupil well-being is measured using depression and anxiety inventories and other validated psychological questionnaires. Behaviour is assessed using a behaviour questionnaire filled out by both pupils and teachers (please see the Appendix for further information on the psychological and behavioural questionnaires, and see the explanation of measures in the quantitative section below for detail on scoring). We also use data from the National Pupil Database/Pupil Level Annual Schools Census (NPD/PLASC) on pupils’ demographic characteristics and their prior attainment, in addition to academic attainment data obtained from 14 schools. Table 4 shows the data elements used in the evaluation and the source for each.
Table 4: Quantitative data available, and source
Measure Data Source
Fidelity
Workshop group size
Hours available for workshops Use of untrained facilitators Workshop attendance Conference call attendance
Schools Schools Schools Schools PRP team Participant Satisfaction
Pupil satisfaction survey Facilitator satisfaction survey
Q Q
Psychological outcomes
Children’s Depression Inventory (CDI)
Revised Children’s Manifest Anxiety (RCMAS) (Huebner) Brief Multidimensional Students’ Life Satisfaction Scale (SLSS)
Q Q Q
Behavioural outcomes
Self-report Goodman SDQ (pupil) Teacher Goodman SDQ (teacher) Attendance Rates Q Q NPD Academic attainment
Prior attainment (Key Stage 2) Attainment at secondary school
NPD Schools
Other Relevant
Age, gender, ethnicity, FSM, SEN, Gifted and Talented, in-care, census characteristics of home area, other pupil-reported characteristics from pupil questionnaires.
NPD & Q
Q=questionnaire; NPD=National Pupil Database
5. Quantitative analysis
Summary of Quantitative Findings
The first UKRP workshops were delivered to Year 7 pupils in 22 participating schools in 2007-8. In the First Interim Report (Challen et al., 2009) and the Second Interim Report (Challen et al., 2010) we provided an assessment of the impact of the workshops up to July 2008 and July 2009, finding that they had a small but significant average impact on pupils’ depression scores. We also found differences in the size of the effect of the programme based on the timing and frequency of the workshops (weekly workshops had more of an impact), and by pupil characteristics (lower attaining and more disadvantaged pupils gained more, as well as pupils who started the year with worse symptoms).
In this final quantitative analysis we look at the same cohort of pupils and examine the impact of the programme at the two-year follow-up point in June 2010, comparing this to the impact seen at earlier follow-up periods.
We find an average short-run improvement in pupils’ depression symptom scores, school attendance, and attainment in English as a result of the workshops. However, this improvement had faded by one-year follow-up for the depression score and for absence from school. There was still an average impact on English grades by one-year follow-up. There was some impact on anxiety scores, but this was inconsistent and concentrated in a few groups of pupils. There was also a measured impact on maths scores at one-year follow-up but not in the short run (immediately post workshops).
With the exception of the impact on academic attainment, the impact of the workshops lasted only as long as the academic year in which the workshops took place, and had faded by the one-year follow-up questionnaire in June 2009. However, there was still an impact for certain groups at one-year follow-up, particularly for pupils who had not attained the national target levels in English or maths at Key Stage 2. There was still a measured impact on English and maths scores at one-year follow-up. There was no impact on any of the outcome measures by the two-year follow-up survey in June 2010.
There was no measured impact of workshops on behaviour scores or life satisfaction scores.
The size of the impact varied by how workshops were organised: weekly workshops showed a larger impact than those timetabled fortnightly.
The impact also varied by pupil characteristics. Pupils who were entitled to free school meals; who had not attained the national targets in English or maths at Key Stage 2; or who had worse initial symptoms of depression or anxiety; were all more likely to experience a larger measured impact of the workshops on their depression and anxiety scores, particularly girls with these characteristics. There was little difference by pupil characteristics on the absence rate. The impact for these groups was also less likely to have faded by the one-year follow-up.
The short-run average improvement in absence rates appears to be similar across different ways of organising workshops, and is also similar for most groups of pupils. It is equivalent to an improvement of about 1.5 more school days attended over the course of the year.
The chapter concludes with implementation issues to consider, based on the quantitative research.
Introduction
For the purposes of comparison, we are providing similar analyses as for the 2009 and 2010 interim reports. However, we now include the most recent follow-up data, and evaluate the effect on additional outcomes (behaviour, life satisfaction and some measures of academic attainment).13 All pupils who were in Year 7 in 2007-08 are included in the analysis below if
they completed enough questions from the questionnaires or have sufficient records available from the National Pupil Database (for absence data) or from their schools (for academic data).
However, not all implementations of the UKRP intended for inclusion in the evaluation appear to have produced comparable intervention and control groups. Having similar workshop and control groups is important: unless we are sure that the pupils included in the workshops and those in the control group were similar to begin with, we cannot be sure whether any differences between the two groups at the end of the workshops were due to the effects of the programme, or were simply due to pre-existing differences between them. In the analysis we therefore present results for both the full sample, and for the group (based on workshop timing) that has well-balanced intervention and control groups.
Data collection points
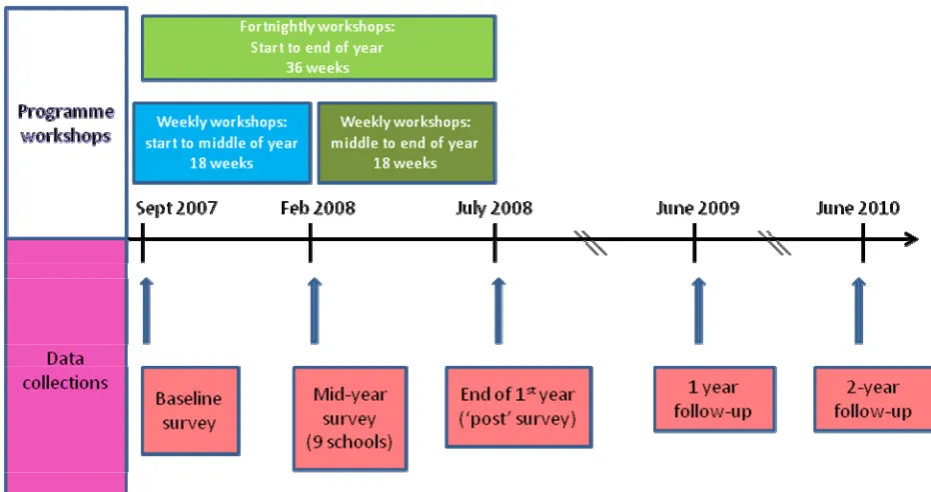
Year 7 pupils were surveyed at the beginning of the school year before the start of the intervention, at the end of the intervention and at the end of the academic year (two or three times in one year, depending on workshop timing) – see Figure 1: Timeline of workshops and data collections.14 There were further follow-up surveys in July 2009 and July 2010,
when the pupils in the workshop cohort were in Years 8 and 9 respectively.
13 Another change is that we are modifying one aspect of the specification we are using. In previous years we have clustered the standard errors in the regressions at the pupil level. For this to give a true idea of programme impact we have to assume that there is no correlation between the outcomes of pupils who are in the same schools or classes. This is a strong assumption, and is probably unrealistic. In this report we cluster the standard errors at the level of treatment assignment, which allows for the possibility of correlation between pupils in the same classes, year groups or schools. This does not effect the size of the coefficients we estimate, but it does tend to increase the size of the standard errors and so the significance level of the coefficients, that is, we are now less likely to find statistically significant effects. However, this specification is more likely to be the correct one. 14 Only 9 of 22 schools were surveyed in the mid-year data collection (Wave C, around February 2008), as this only involved schools that were starting or finishing a set of workshops around this time.
Figure 1: Timeline of workshops and data collections
Explanation of measures
Symptoms of depression are measured using the Children’s Depression Inventory (CDI). This scale has 27 items in the original version, but this study omits the item about suicidal ideation and so it contains only 26.15 Each of these is scored as 0, 1 or 2 depending on the
severity of the symptom: 0 indicating no symptoms of depression on that item according to the child’s response; and 2 indicating strong symptoms. Item scores are then summed to create a total score between 0 and 52, where higher scores indicate worse symptoms.16
However, since the scale primarily measures deviations from well-being, rather than degrees of positive well-being, the distribution of the total score is highly skewed. A large number of pupils have very low scores: over 10% score 0 or 1, and over 50% score 7 or lower, and this is true for each of Waves B to F (September 2007 to June 2010). We therefore encounter a ‘ceiling effect’ on depression symptoms scores, as pupils scoring 0 in the baseline at the beginning of the year cannot improve their scores.
Symptoms of anxiety are measured using the Revised Children’s Manifest Anxiety Scale (RCMAS). This scale contains 28 items, plus 9 more to form a ‘lie scale’ used to detect responses motivated by social desirability (though the latter scale is not used in the present analysis). Each item of the main scale asks about whether a symptom of anxiety is typical of the child or not, and is scored as 1 if the response is ‘yes’ and 0 if ‘no’, giving a maximum possible summed score of 28 with higher scores indicating worse symptoms. Again, the
15 The item on suicidal ideation is often omitted when using the inventory in universal (as opposed to psychiatric) populations. The item was not deemed appropriate or necessary for use in schools, so has been omitted at all stages of this study.
16 If more than 10% of items are unanswered then the assessment is considered invalid. When up to 10% of items are missing these scores can be replaced by the mean of the non-missing items in order to create a total score.
distribution of scores is highly skewed, with over 10% of pupils scoring 0 or 1 and over 50% scoring 8 or lower.
Behaviour is measured using the self-report and teacher-report versions of the Goodman SDQ. The SDQ total difficulties score is comprised of 20 items, each scored 0, 1 or 2 according to the perceived severity of the symptom. This gives a minimum possible score of 0 and a maximum of 40, with higher scores indicating more (and more severe) symptoms.17
The distribution of scores is highly skewed, particularly for the teacher version: 50% of all pupils score 5 or lower on the teacher SDQ; and more than 50% score lower than 11 on the pupil version.
Life satisfaction is measured using the Huebner Brief Multidimensional Students’ Life Satisfaction Scale, which has five items asking about satisfaction with particular domains of a child’s life and one asking about overall life satisfaction.18 This is scored on a 7-point scale,
giving a minimum possible summed score of 6 and a maximum of 42, with higher scores indicating greater life satisfaction. Again the distribution is skewed, with over 50% of pupils scoring 35 or more. Note that on this scale higher scores indicate greater well-being, unlike the other four scales for which the reverse is true.
Annual absence from school is measured as the fraction of school sessions for which pupils were absent during the academic years 2006-7, 2007-8 and 2008-09. This is the sum total of authorised and unauthorised absences during the year.19
Academic attainment in English, maths and science is measured in sublevels, such as 3b, 5.5 etc. Key Stage 2 attainment in these three subjects is obtained from the National Pupil Database, and attainment throughout the first three years of secondary school is provided by the schools. There may therefore be some variation between schools in the way pupils are graded. However, we have a control group within each school this is not so great a problem, so long as we account for the school a pupil is at, and we do this in the analyses below. Schools record attainment grades differently: some (most of our sample) use alphanumeric sublevels, e.g. 5b, 7c, while some use decimals such as 5.3, 4.2. We include all of these in the analysis by converting the former into decimal sublevels, with ‘a’ becoming .8, ‘b’ .5 and ‘c’ .2 (this follows the practice of one school which had recently modified its marking system, and appears to fit the data well).
Unfortunately, only 14 of the 22 evaluation schools responded to our request for academic data in time for it to be included in this report. As a result the sample we are using to assess pupils’ academic outcomes is limited to pupils at these schools. Since these 14 schools are not representative of the sample as a whole we are reluctant to claim that our findings from this sample offer conclusive evidence on academic impact. However, we present some evidence below.
The data on pupils’ gender, SEN status, entitlement to free school meals, Key Stage 2 attainment, and absence are obtained from the National Pupil Database/Pupil Level Annual Schools Census (NPD/PLASC).
17 The assessment is valid if at least 3 items of each of the four difficulties subscales have been completed.
18 The domains are: family, friends, school, oneself, and where the respondent lives.
19 We use this measure of absence because the distinction between authorised and unauthorised absence is not reliably recorded in the data, but the total number of absences should be (according to the guidance notes for the NPD tables).
Treatment and control groups
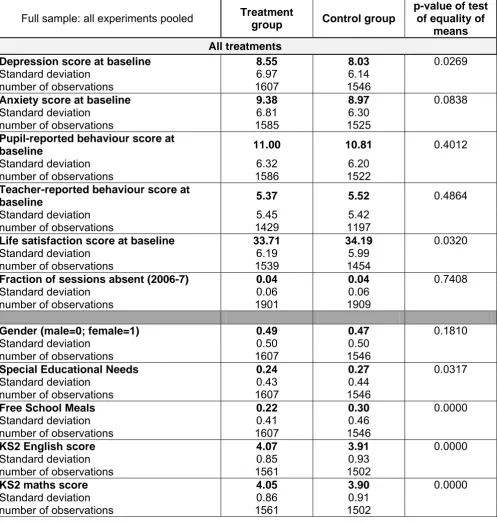
Tables 5-8 present the treatment and control group means for 11 variables for the full sample and for the three different experiments separately, including the p-values from mean-comparison tests. These tests indicate how different the two samples are at the baseline (September 2007), and therefore tell us how well matched the workshop and control groups were before any of the workshops began. They provide an estimate of how likely it is that an equally large difference between the two means could have arisen by chance if the samples were in fact similar. The first six variables in the upper panel of each table are potential outcome variables. The first five are psychological and behavioural variables obtained from the questionnaires we administered in September 2007; the sixth is annual absence, obtained from NPD/PLASC for the academic year 2006-07, i.e. the year before the workshops and the year before these pupils transferred to secondary school. The five variables in the lower panels are socio-demographic and educational attainment variables obtained from the NPD and matched into our dataset (although attainment in English and maths are also outcome variables). The data on Key Stage 2 attainment comes from the KS2 attainment tables in the NPD for summer 2007. The other variables are taken from PLASC for the academic year 2007-08, unless this record is missing, in which case values from the previous year (2006-07) or the following year (2008-09) are used. In this way we minimise the number of pupils for whom we lack demographic information.
Table 5 presents statistics for the full Year 7 cohort when they were surveyed at baseline. This includes all pupils who were in Year 7 in 2007-8, in either workshop or control groups, and who completed enough questions and questionnaires throughout the course of the data collections to be included in the evaluation sample (so this does not include the year-above control groups, who do not have a baseline measure). It is clear that there are significant differences between the workshop and control groups: the p-values of tests of equality of means between the treatment and control groups are less than 0.1 for 7 out of 11 variables, suggesting that there is (at most) a 10% chance that the observed differences between these groups would have arisen by chance if they were in fact similar. (The smaller the p-value, the less likely that such a difference could have arisen by chance.) Importantly, there are significant differences between treatment and control at baseline for both the depression score (p=0.03) and the anxiety score (p=0.08), which are the first two of the outcome variables we will consider in our analysis below. The two groups do seem similar in terms of the mean absence rate from school in the previous year (p=0.74). However, the groups also differ significantly in terms of demographic and attainment characteristics (the five variables in the bottom panel of Table 5). Although we cannot reject that they are have a similar composition in terms of gender (p=0.18), the full treatment group and the control group are significantly different at the 5% level for the others: on average the treatment group as a whole has lower levels of SEN and FSM eligibility, and higher prior attainment than the control group.
Since we have data on these characteristics, we can control for them in our analysis, and thereby control for any differences between treatment and control groups that are not due to the causal impact of workshop participation. However, given that there are these observable differences between the two groups, it is likely that there are also differences between them that we cannot observe (we do not have data on them), and therefore cannot control for. If these unobserved differences are correlated with assignment to the treatment or control group, then if we use poorly matched groups we cannot be sure that differences in outcomes between treatment and control are due to the programme and not due to other factors. This is why it is important to have well-matched treatment and control groups, and why we will not only use the full sample in our analysis.
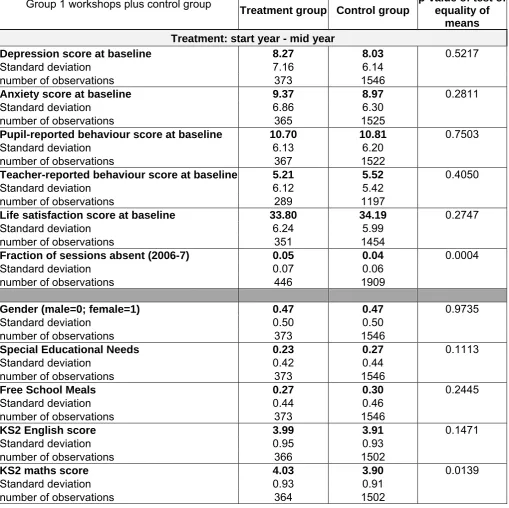
The following three tables present the same information as Table 5 but for each configuration of workshops separately. Table 6 presents descriptive statistics for pupils who were in ‘Group 1’ workshops, relative to the control group (the control group is the same as for the full sample, and for the other two groups of workshops discussed below). These are workshops that took place at least once a week from the beginning of the school year, and finished around the middle of the school year (roughly September 2007 to February 2008).
The treatment and control groups are well matched: it is clear from Table 6 that most of the p-values from the mean comparison tests are well above 0.1. In fact, the only two variables presented for which there are statistically significant differences in means are Key Stage 2 maths attainment and absence rate in the previous year. On average, pupils in the treatment group had significantly higher KS2 maths scores than those in the control group. The difference between the two groups is not large (0.13 of a level), but it is interesting that on average pupils in the control group did not attain the national target of level 4 in Key Stage 2 maths, suggesting that they have somewhat below average attainment. This difference could have resulted from the way schools assigned class groups to UKRP workshops: if the assigned classes were setted, for instance in science or English sets, the treatment group’s academic attainment might differ from the school average. This was not necessarily deliberate, as many schools simply had to choose classes to participate in UKRP workshops based on which ones fitted the timetable. However, this could be a problem for evaluating the programme impact on academic outcomes, as if pupils did not have similar attainment before the workshops it is more difficult to attribute subsequent differences to the impact of the programme.
Also worrying is the difference in absence rates, as this is another outcome variable we will be examining. Pupils in these workshops had a higher absence rate in their last year of primary school than pupils in the control group. We suspect that this was largely due to pupils in these two groups coming from different schools in different proportions, meaning that they are likely to have different average levels of attendance and attainment. (Schools are not equally represented in both groups, as the proportion of the year group included in workshops varied greatly by school, ranging from 11% to 100% of the cohort.) That is to say, the differences are due to between-school differences in these variables rather than within-school differences. Nevertheless, in our analysis below our preferred specification uses pupil fixed effects, using multiple observations of the same pupil over time to control for all the characteristics of the pupil which are fixed through time, and this should control for differences in KS2 attainment and prior absence rates. Moreover, we control for the school that each pupil attended in September 2007 and allow for different trends by school, and this should take account of many differences due to schools.20
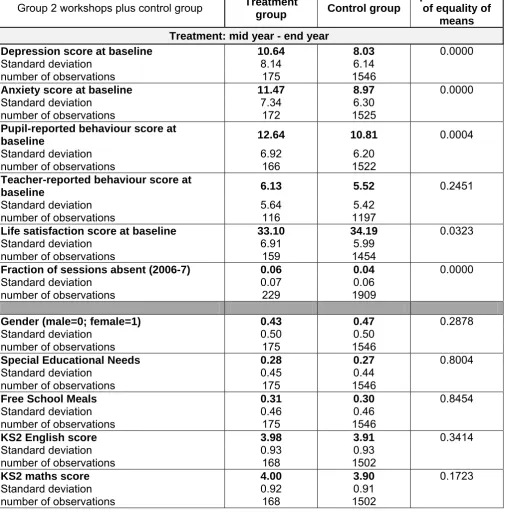
The second treatment group consists of weekly workshops that started mid year and finished near the end of the school year (roughly February to July 2008), and baseline statistics for
20 There could still be a problem if baseline differences give rise to different trends, and these trends are correlated with workshop/control assignment. For instance, if it were the case that more academically able children become happier at secondary school while less able children become less happy, and a school assigned only its top set maths pupils to workshops, we might attribute the improvement in these pupils’ subjective well-being to the workshops when in fact it was due to their academic ability. However, we do not think that the mismatch in maths attainment is a particular problem for us, at least when the outcomes is the depression symptoms score, as we find that lower-attaining pupils actually seem to benefit more from the workshops. Given that the descriptive statistics suggest that there is a smaller proportion of low-attaining pupils in our treatment groups this mismatch would in fact bias downwards, not upwards, our estimate of the average treatment effect. That said, this is likely to be more of a problem when the outcome variable is academic attainment.
this sample and the control group are presented in Table 7. Here it is clear that the pupils in the workshops are on average significantly different from the control group pupils on the psychological measures, on one of the behavioural measures, and in terms of their absence rate (the p-values are less than 0.05 for all but one of the first six outcome variables, meaning that there is less than a 5% chance in each case that such a large difference between the treatment and control groups would have arisen by chance if they were in fact similar). We know that some schools selected pupils for this second batch of workshops based on perceived psychological need, so it is not surprising that they look different to the control group. However, they seem reasonably well matched on the five variables in the lower panel – the socio-demographic and attainment measures.
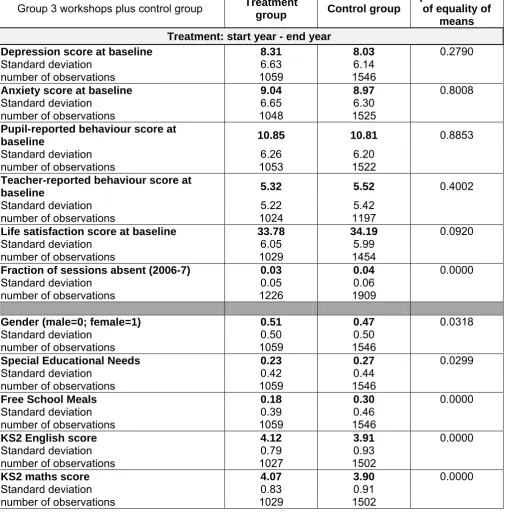
Table 8 presents measures for the third group of workshops, which took place fortnightly and lasted from the start of the academic year to (near) the end. This treatment group seems well matched to the control group in terms of the psychological scores at baseline, with the exception of life satisfaction (p=0.09, with the control group scoring higher than the treatment group, meaning that on average they report being more contented). However, the difference in the absence rate is significant at 0.1%. Moreover, these pupils are very different in terms of all five socio-demographic and attainment variables: the treatment group is significantly more female, higher attaining, less likely to be entitled to free school meals, and less likely to have special educational needs than the control group. Many of the schools that timetabled workshops in this pattern included all of their Year 7 pupils in workshops and so do not have a within-year control group; moreover, they are on average less deprived and higher attaining than the sample as a whole. This could make comparisons more difficult, as treatment and control pupils are in different schools, so are probably more different to begin with, and may be subject to different environments and events throughout the course of the year. It is therefore not surprising that treatment and control pupils appear to be significantly different at baseline. As mentioned above, in our analysis we can control for many differences between schools, but with so many obvious differences between the pupils in this treatment group and the control group this is probably not the best sample to rely on to estimate the programme impact.
Thus, because of the significant baseline differences between the treatment and control groups when using the full sample, we will present some analyses on both the full sample and on the first group of workshops (the September to February weekly group of workshops). We can be reasonably confident of any results we obtain that are robust to using both of these two samples.
Programme impact on symptoms of depression
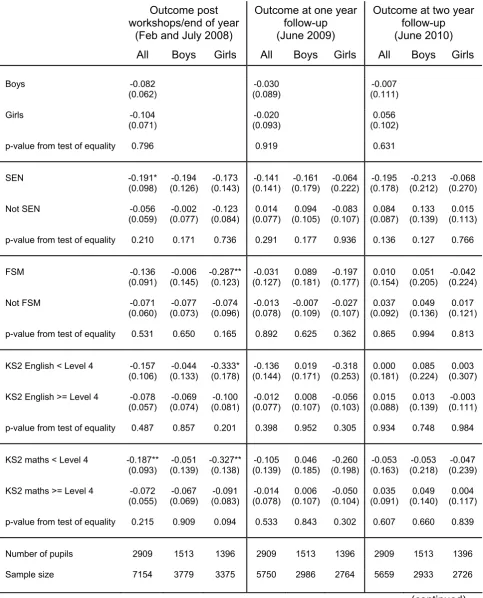
We first present an analysis of the treatment effect using an econometric specification which adds variables to control for pupil characteristics, which should go some way to correcting any bias produced as a result of mismatched treatment and control groups (Table 9). We show how the results obtained differ for the three different experiments using this same framework (Table 10). Then we will use our preferred specification and examine heterogeneity in treatment effect by pupil characteristics (Table 11). We follow a similar pattern for analyses of the programme impact on the other outcome variables.
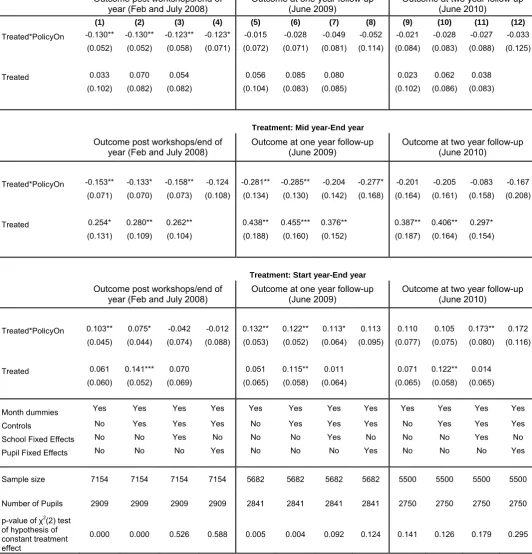
The overall treatment effect for all three groups of workshops combined is presented in Table 9.21 Columns 1-4 present the short-run effect of the workshops, measured either in the
21 This can be compared with Table 9 of the Second Interim Report (Challen et al. 2010), and Table 28 of the First Interim Report (Challen et al. 2009).
middle of the year immediately after the end of the Group 1 workshops; at the end of the academic year (immediately post for Workshop Groups 2 and 3, and 4 months later for Group 1); or both. Columns 5-8 present the results for the one-year follow-up, with data collected in June-July 2009. Columns 9-12 present the results for the two-year follow-up, with data collected in June-July 2010.
The method we are using to estimate programme impact is called difference-in-differences. We obtain this estimate by subtracting the mean depression score after the end of the programme from the mean depression score at baseline for the control and treatment groups separately, then taking the difference between these two to obtain the overall effect of treatment. In essence, this measures how the treatment group has changed relative to how the control group has changed.
The coefficient on ‘Treated*PolicyOn’ in Table 9 gives the difference-in-differences estimate, using the standardised depression symptoms score as the outcome variable.22 Columns 1, 5
and 9 only control for the month in which the questionnaire was filled in (a control for reporting and seasonal effects), for the three follow-up points respectively. The negative coefficient on ‘Treated*PolicyOn’ in column 1 suggests an improvement in the treatment group’s depression scores relative to the control group at the short-run follow-up point (February or July 2008), and this is significantly different from zero.23 24 The match between
the treatment and control groups (in terms of the depression score) is shown by the coefficient on the ‘Treated’ variable. As suggested by the descriptive statistics in Table 5, pupils in the combined treatment group score on average at least 0.1 of a standard deviation higher (worse) than those in the control group on the depression inventory (given this specification). The single asterisk following the coefficient indicate that this difference is significant at 10%, i.e. there is only a 10% chance that it could have arisen by chance if in fact the treatment and control values were equal.The size of this difference (about 0.1 of a standard deviation) is not very large, but given that we would not expect the programme to have an impact which is much larger than this difference, this could be a problem in interpreting the results of the analysis.
Columns 5 and 9 use the same specification as column 1, but here the data used are for the one-year and two-year follow-up points. As in column 1, the coefficient on ‘Treated’ in both of these later follow-ups suggests a pre-existing difference between the treatment and control groups of about 0.1 of a standard deviation, significant at 10%. However, the coefficient on ‘Treated*PolicyOn’, which gives us the estimate of programme impact, is positive for both of these periods. This means that the treatment group had a slightly worse depression score at these points than the control group, although this difference is very small and is not significantly different from zero, meaning that we should really treat it as no difference (i.e. an effect of zero).
22 Standardising scores involves subtracting the mean score and dividing by the standard deviation to give a standardised score with a mean of 0 and a standard deviation of 1. This does not change the results we obtain, but makes interpretation and comparison of the coefficients easier.
23 Remember that for the depression score, a higher score indicates worse symptoms, so a decline in the scores is an improvement.
24 If the difference between two values is statistically significant this means that it is unlikely that an equally large difference would arise by chance if in fact the two values were the same. For instance, if a difference is significant at the 10% level (p<=0.1), this means that there is only a 10% chance that it could have arisen by chance; if it is significant at the 1% level (p<=0.01), there is only a 1% chance of its arising by chance, etc. Here and in the tables below, the level of significance of a coefficient is indicated by asterisks after it: one asterisk means that it is significant at the 10% level (p<=0.1); two asterisks that it is significant at 5% (p<=0.05); and three that it is significant at 1% (p<=0.01).
These results mean that, based on this very simple specification, there does appear to be a significant average effect of the programme on the depression score soon after the end of the programme (column 1), but that there is no measured effect later on, at one-year and two-year follow-up (columns 5 and 9).
However, this does not take into account other factors which may differ between the two groups and could affect the measured impact. The advantage of using this econometric specification is that we can control for some other factors, such as gender, free school meal eligibility, special educational needs etc., which could have some impact on the outcomes we are evaluating, independently of any impact of the workshops. This is particularly important given that Table 5 suggests that there are important differences on average between the treatment and control groups in terms of these characteristics. Columns 2-4, and the equivalents at one- and two-year follow-up (columns 6-8 and 10-12), add more controls for pupils’ demographic characteristics and school attended. The controls used are listed in the grid beneath the table.
Looking at all three periods, the coefficient on ‘Treated’ increases slightly when controls for pupils’ demographic characteristics are added, but drops again once school fixed effects are included (columns 3, 7 and 11). This is because, as we suggested above, many of the differences between pupils in the treatment and control groups here are due to between-school differences rather than within-between-school differences, so once we control for a pupil’s school at baseline the difference is reduced. However, the coefficient is still significantly different from zero at both short-run and one-year up (although not at two-year follow-up), suggesting that these controls might not fully account for baseline differences between pupils.
For the short-run follow-up, the coefficient on ‘Treated*PolicyOn’ gets slightly larger as more controls are added, implying that there is an average improvement as a result of the workshops once we account for the differences between pupils in the control and treatment groups. Columns 4, 8 and 12 present specifications using pupil fixed effects. This works by using multiple observations of the same pupil over time to control for all the characteristics of the pupil which are fixed through time. This should control for many of the differences in composition between the treatment and control groups (such as gender, prior attainment etc.), including those for which we do not have data (e.g. family climate, so