".
COMPUTER MODELLING OF ADRENAL FUNCTION
A thesis presented for ,the degree of
Doctor of Philosophy in Electrical Engineering in the University of Canterbury,
Christchurch, New Zealand.
"
by
R.B. Jordan B.E., (Hops)
'?'
ABSTRACT
.J81
The literature pertaining to the modelling of the1~7+
, adrenal-cortical system is reviewed. Two new models
describing the behaviour of the adrenal gland under condi-tions of stimulation from the .hormone ACTH are developed .. Both are capable of predicting the observed overshoot in cprtisol secretion following a step rise in ACTH concentra-tion at the gland. The first relies on depletion of
available cholesterol stores in the gland, while the second relies on the proposal of Berger that ACTH stimulates
pregnenolone formation and inhibits 17a hydroxyprogesterone formation.
Analysis of measurements of ACTH concentrations in sheep. show that real differences between the amount of ACTH enter-ing and leaventer-ing the gland do occur. This difference is not due to loss of water or ACTH, nor to transport delays.
Therefore, ACTH must be taken up by or otherwise destroyed within adrenal tissue.
A continuous simulation language for the EAI 640
computer is describe~. This language allows a simulator to study the equations of a small model interactively using a visual display unit and active teletypewriter.
The development of a magnetic tape storage system for the EAI 640 computer is described. The tape system is a backup store for the EAI 260 disc storage system allowing t~e disc to be kept free for each computer user, and thus
allowing larger programs to be executed. The hardware and the software for this system are described.
ii
Between animal variation is not often included in simulation studies. When it is included, .it is usually
estimated by Monte Carlo techniques, which involve computing large numbers of simulations with the values of the model parameters chosen at random. A method - called the "variant function technique!! - is introduced here. The model para-meters are replaced by oscillatory functions of time. This permits the statistical behaviour of the model to be
ACKNOWLEDGEMENTS
The continued encouragement and guidance of my joint supervisors Dr R.H.T. Bates,. Dr W.S. Metcalf and
Dr
J.H.Andreae during the course of this project are grate-fully acknowledged.I am equally indebted to Dr E.A. Espiner and
Professor D.W. Beaven of the Princess Margaret Hospital Medical Unit and the Christchurch Clinical School, and to members of the Lincoln Group and Princess Margaret Hospital Medical Unit, for their insight and assistance in making-this project truly interdisciplinary.
I am indebted to the staff and post graduate students of the Chemistry and Electrica~ Engineering Departments for assistance in many of the technical aspects of this thesis, and for the many discussions which added stimulation to this research •.
To my wife Lynne, who transcribed the original text into a form suitable for typing, . and who constantly
CONTENTS
Preface
Chapter 1.0 Rationale
Chapter 2.0 Background Review
Chapter 3.0
Chapter 4.0
2.1 Models as Analogues
2.2 The Simulation of Systems
2.3
3.3
3.4
3.5
3.6
4.14.2
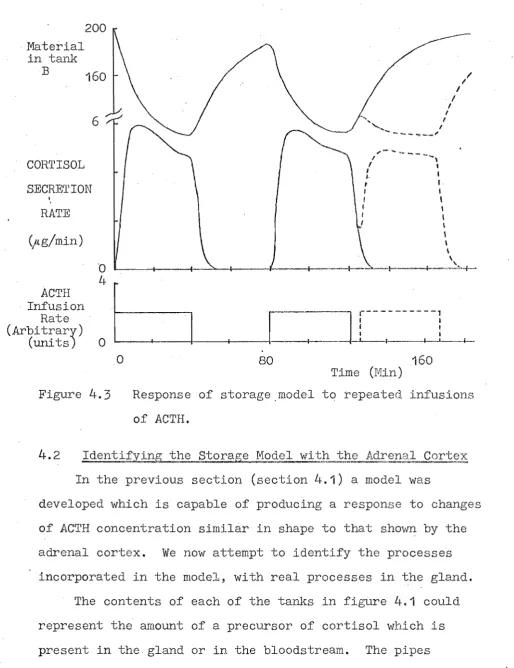
4.3
4.4
Modelling Metabolic and Biochemical Systems
Review of Adrenocortical System Literature
The Adrenocortical System
The Glucocorticoid System as a Closed Loop Adaptive Controller Adrenal Cortex Experimental Procedures
Results from Dynamic Studies on the Adrenal Cortex
Glucocorticoid System Models Models of the Adrenal Subsystem
Simple Adrenal Models
The Depleted Store Model of Steroidogenesis
Identifying the Storage Model with the Adrenal Cortex
A Model of 'Berger's Cyclic AMP Proposal
Three Adrenal System Models?
Chapter 5.0 Adrenal Uptake of ACTH 70
'.
Chapter 6.0
5.1 Apparent Uptake of ACTH 71
5.2 Measurement of Arterio-Venous ACTH 72 Conc.entration Differences
5.3 Measurement of ACTH Accumulation 76 or Loss
5.4 Investigation of ACTH Accumulation 79 5.5
6.1
or Loss
Interpretation of Uptake Experiments 83 ACTH Fragmentation Model
Difference between Bioassay and Immunoassay Results
85 86 6.2 Bessar's Theory of ACTH Fragmentation 87 6.3 The Fragmentation Theory in Model 89
Form
6.4 Estimation of Model Parameters 93 6.5 Estimation of Biologically Active 95
ACTH Concentration
6.6 ACTH Distribution Volume 101
6.7 Discussion of Results 103
6.8 Discussion of the Minimization 105 Technique
6.9 The Fragmentation Model applied to 108 Published Data
6.10 Measurement of Endogenous ACTH 112 Concentrations
6.11 Application of the Model to the 114 Measurement of Endogenous ACTH
6.12 Summary 116
Chapter
7.0
7.1
7.2
7.3
7.4
SIMULS - A Simulation Program Background to SIMU18
SIMULB Philosophy Software Organization Operation of SIMULS
vi
119
119
121
123
129
7.5
Advanced Features131
"
7.6
Conclusions133
Chapter 8.0 Magnetic Tape Storage
135
8.1
Need for .and Choice of a Bulk136
Storage System8.2
Design Constraints137
8.3
System Principles139
8.4
Tape Format.140
8.5
Magnetic Tape Controller Hardware -142
Data Transfer8.6
Magnetic Tape Controller Hardware -144
Control8.7
Data Format on Tape145
8.8
Magnetic Tape Utility Program147
8.9
Conclusions148
Chapter 9.0 Parameter Variance Considerations
when Simulating Linear Systems 150
9.1
The solution Ranges in a Linear151
System
9.2
Mean and Standard Deviation Curves154
in a Linear System9.3
Series Expansion of the Transition155
MatrixPage
9.6 The Variant Function Technique 162
used in a Simple Example
9.7 Estimating the means and standard 164
Deviations from the solutions found by the Variant Function Technique
9.8 Accuracy of the Variant Function 167
Technique
9.9 Summary 168
Chapter 10.0 Conclusions 172
10.1 Adrenal Modelling 172
10.2 ACTH Measurement 173
10.3 Simulation Languages 175
10.4 Magnetic Tape Controller 177
10.5 Parameter Variations 177
Appendices
Appendix 1 Function Minimization using the Pattern 180
Search Algorithm.
Appendix 2 Data Interpolation using Akimas Procedure 191
Appendix 3 Solution of a set of Linear First Order 195
Ordinary Differential Equations using the Matrix Exponential
Appendix 4 SIMULB - Users Manual 198
---viii
The work presented in this thesis was started with the specific aim of using computer modelling techniques to
provide a better understanding of the function of the adrenal gland.
As the research proceeded its aims diversified. In chapter 1 the progress of the work and its expansion into varying fields is described.
Chapter 2 is a brief introduction to some relevant aspects of computing, modelling, endocrinology and
biochemistry, to acquaint readers from different disciplines with the basic terms and definitions used in these sciences.
A review of the literature relevant to the adrenal cortical system is presented in chapter
3.
This covers recent developments in the study of biochemical andphysiological aspects of the adrenal system and in the models which have been proposed to represent it.
Chapters 4 to 9 contain the original work presented in this thesis. The first three chapters relate directly to the adrenal system itself, while chapters 7, 8 and 9 describe -computational methods and aids which were developed £or the purpose of improving modelling techniques.
Experiments made by Espiner, Donald and Hart, in the J.A. Johnstone Memorial Laboratory, Lincoln College,
New Zealand, are analysed in chapter
5.
In this thesis, it is shown that these experiments provide evidence that the adrenal gland is·capable of removing ACTH from thearterial supply, so implying an ACTH receptor in the gland. Chapter 5 is concerned with the interpretation of
~adioimmunoassay measurements of ACTH concentration. This
is examined ·further in chapter
6.
A model is developed and is tested using results from the aforementioned experiments of Espiner et ala and other published data. A technique for estimating actual concentrations of ACTH from immunoassay results is developed and is applied to two experimental situations. The first is where ACTH is infused into sheep, and the second is where ACTH is secreted by the sheepthemselves.
Chapter
7
is concerned with an interactive simulation language called SIMULB, which was written to enable the models presented in chapters 3, 4 and 6 to be easily analysed on a digital computer.Chapter 8 describes a magnetic tape data storage system which was built to allow large programs such as SIMULB to be used on the EAI 640 computer in the Electrical
x
Three methods of incorporating normal biological variations into simulation procedures are examined in
chapter 9. One of these methods, which is new, is developed in some detail.
Chapter 10 contains the more important conclusions drawn from the results presented here. Some future areas' of research are suggested.
1. Publications relevant to the research presented herein
are:
Espiner E.A., Donald R.A., Hart D.S., Ross Janne, and Jordan R.B., Evidence for adrenocortical uptake of ACTH in vivo. Amer. Jnl Physiol,226: No.1,
pp. 96 - 104. January 1974.
Jor4an R.B. A mass data stor~ge system for a midi computer. Presented at the National Electronic conference,
Palmerston North, New Zeal~nd, Aug~st 1972.
McKinnon A.E. and Jordan R.B., Stomach emptying modelled on a small computer with oscilloscope display.
Presented at the Quantitative Biology Meeting, Nelson, New Zealand, May 1972.
Jordan R.B., Analysis and Interpretation of some Biochemical Measurements using Computer Programmes devised for the purpose. Presented at the New Zealand Endocrinological Society conference, Christchurch, New Zealand,
CHAPTER 1
RATIONALE
Prof. D.W. Beaven and Dr E.A. Espiner have been leading a team of endocrinologists (hereinafter referred to as the "Lincoln grouptl) working in New Zealand, partly at the Princess Margaret Hospital in Christchurch, and partly at
I
Lincoln College. They have performed a unique series of
-
.
experiments on sheep with adrenal transplants. Their work is referenced and reviewed in some detail later in this thesis.
Our initial contacts with the Lincoln group were arranged by
Dr
W.S. Metcalf, Reader in Chemistry at the University of Canterbury. In collaboration with personnel of the Medical Unit at Princess Margaret Hospital, he has been developing a computer program describing the destina-tion of calcium from dietary and intravenous sources, in the blood, gut and bone -of man (cf. Livesey, 1970). Dr Metcalf proposed that a model similar to the calcium program might aid the understanding of, and experimentation on, the complex pituitary-adrenal system. It was with this aim that theresearch described herein was begun.
During the early part of the research it was found
necessary to master the elements of endocrinology, physiology and biochemistry in order to be able to make full use of
2
It became apparent from the study of data collected by
the Lincoln group that their experiments were effectively
concerned with isolated regions of the pituitary adrenal
system. This reflects, not the inadequacy of the experiments,
but the complexity of the adrenal system. The available data
were insufficient to provide the base for a complete adrenal
model. However, much of the data could be used to
~haracterise parts of such a model.
The literature contains a number of models of the
adrenal system, all of which are deficient either in their
/
biochemical basis or in their ability to mimic adrenal
function. By making use of the most recent experimental
results it has been found possible to develop models which
have significantly fewer deficiencies than the published
models. Two new models of the adrenal cortex have been
constructed. They are both different from any that have
. .
been published, and are both capable of describing the
input-output relationships of the adrenal gland.
The original aim of the research began to be modified
after an analysis was made of some experiments designed to
measure the amount of the hormone ACTH that was being taken
up by the adrenal gland. This analysis casts doubt on the
ACTH measuring technique, which appears to give biassed
estimates of ACTH concentrations. A model of the processes
involved was developed and tested against data generated by
the Lincoln group and against other published data. This
model, which is one of the main contributiom reported in this
thesis, allows estimation of true ACTH concentrations in.a
--~number of experimental situations.
To undertake computer modelling, one must have access te a cemputer system which is geared te simulation with regards te beth seftware and hardware. We had ready access te a cemputer (EAI 590.hybrid· cemputer which incerperated an EAI 640 digital cemputer and an EAI 580 analegue cemputer, installed.in the Electrical Engineering Department,
University .of Canterbury), but at the start .of .our research, ~ittle .or ne simulatien .of the type .of interest te us had
f • • •
been .undertaken at ,Canterbury University. The medels investigated during the research were .of such variety and form that analegue cemputatienwas very time censuming -' eachmedel required cemplete repatching. In .order te increase .our cemputing efficiency a digital simulatien
language was develeped in conjunctien with Dr A.E. McKinnen, presently at Divisien .of Bielegical Sciences, Natienal
Research Ceuncil .of Canada, ottawa. The value .of this pre gram is made clear later in this thesis.
Te implement such a large pre gram en se small a cemputer placed serieus censtraints en the mass sterage available. Te alleviate this situatien a magnetic tape sterage system was designed ~nd censtructed.
The tepics in the penultimate chapter .of the thesis (chapter 9), arese frem cenversatiens held with a number .of endocrinelegists and physiolegists. Many .of these scientists,· are rather sceptical .of medelling fer the reasen that a medel is assigned parameter values which represent these .of .only one, .often hypothetical, member .of the species being
incorporating normal variations into simulation techniques. One of the methods, developed in conjunction with
Dr R.B.T. Bates, is original and has potential advantages, as is shown in chapter
9.
CHAPTER 2
BACKGROUND REVIEW
Science is the observation of facts, and especially of measurable quantities, and the construction of theories that serve to explain and unify such facts and measurements. The theories are tested against whatever facts and measurements
I
can be found or generated by experiments suggested by the theory.
A model is a terse statement of such a theory, and both theory and model are modified or rejected as the discovery of new facts and measqrements require. Thus modelling is the process of constructing real or abstract analogues of a
system which is to be analysed or described. A model may be little more than a description in words of a system in the simplest case, or at the other extreme may involve large numbers of mathematical equations implemented on a computer. Examples of models are
.
.the equations of a chemist,
the molecular models of a biochemist,
the scale models of a structural engineer, the circuits of an electrical engineer, and the sketches of an animal physiologist.
the chemical reactions between compounds, ignore the spatial structure of the molecules, which is irrelevant to the
stoichiometry.
The more important properties of the models are now listed.
A model is a terse catalogue of knowledge gained' from experimentation, or from analysis of a system.
~ A model is usually in a state of change to incorpo-rate new knowledge.
Models are scaled up or scaled down versions of a real system.
A model, in practical terms, simplifies reality.
System components which are of no interest, need not be incorporated into a model.
A model transforms system attributes which are difficult to envisage into attriputes with which we are familiar, and often into attributes which we have the tools to investigate.
• Modelling should never become an end unto itself •
Models are constructed to provoke and to answer questions, and when these questions are answered, the model's function is complete.
In summary of the above assertions, the modelling approach is but one of many tools used in system analysis. It will never replace experimentation, but may certainly aid it.
In the remaining sections of this chapter the forms of models commonly used in studies of physiological systems are
~--~-descr:ibed. In particular, computer simulation and its
---function in the modelling of bi"Ochemical and metabolic processes is discussed.
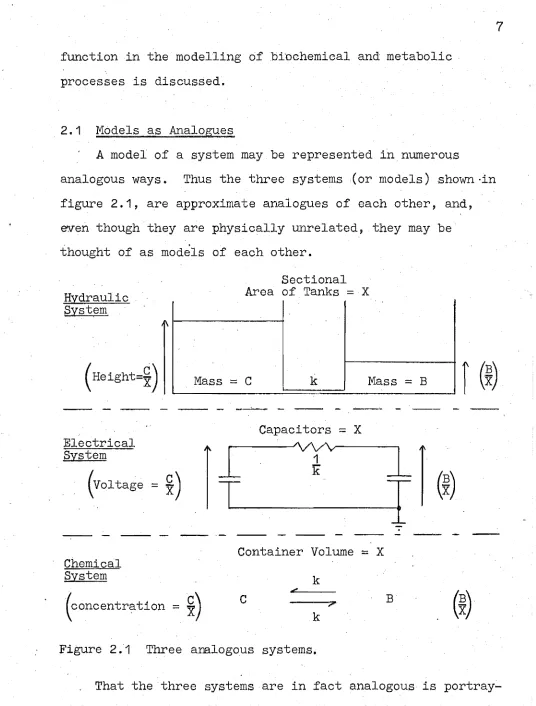
2.1 Models as Analogues
A model of a system may be represented in numerous
[image:18.570.9.545.13.719.2]analogous ways. Thus the three systems (or models) shown-in figure 2.1, are approximate analogues of each other, and, even though they are physically unrelated, they may be thought of as models of each other.
Hydraulic System
( Height=i) Mass
=
Sectional Area of Tanks = X
C k Mass
=
B-
- -
-
-'_ ...-
- -
-
-Capacitors = X Electrical
System
(VOl
tage=
~)
JL-.----~~----~~
1
.
-
- - . - - - -- -
--Container Volume = X Chemical
System k
<'
(concentration
- Q)
C 7 B- X
k
Figure 2.1 Three analogous systems.
That the three systems are in fact analogous
(~)
8
(2.1 ) describes. all three systems in figure 2.1.
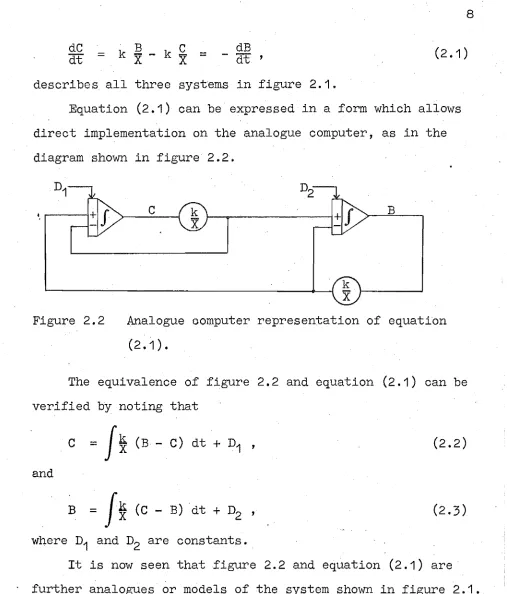
Equation (2.1) can be expressed in a form which allows direct implementation on the analogue computer, as in the diagram shown in figure 2.2.
., . . . - - - 1
c
BFigure 2.2 Analogue oomputer representation of equation (2.1) •
The equivalence of figure 2.2 and equation (2.1) can be verified by noting that
c
=J
~
(B - C) dt + D1 'and
B
=J*
(C - B) dt + D2 'where D1 and D2 are constants.
(2.2)
It is now seen that figure 2.2 and equation (2.1) are further analogues or models of the system shown in figure 2.1.
All of the models introduced so far may be described using a single diagram with the aid of the compartment
notation (c'£. Sheppard, 1948). A compartment is a quantity of a substance which has uniform kinetics of transformation and
transpor~ (Sheppard, 1948). The. three systems shown in
figure 2.1 contain two compartments (B and C).
[image:19.570.38.545.25.619.2]In the conventional compartment notation the compart-ment size is the driving force of the compartcompart-ment (e.g. concentration, pressure, voltage), an intensive property of the system. Intensive properties are those which are
independent ·of the amount of the sUbstance or substances within the system (Glasstone and Lewis, 1963, p63). While
in general a system is studied by measuring its intensive properties, the mathematics of the system are derived from laws of conservation of "amount" (e.g. mass, energy and charge). The "amount" and the volume in which this amount exists are extensive properties of the system (Glasstone and Lewis, 1963, p63). The ratio of the two is the system
driving force.
In this thesis we extend the conventional compartment notation to include both the "amount" and the volume. The conventional compartment size i.e. the driving force, is now expressed as the ratio of the amount to the volume. Thus concentration equals mass over volume, and voltage equals charge over capacitance etc.
The five systems already discussed in this section are summarized, using the new compartment notation, in figure
2.3.
2.2 The Simulation of Systems
Figure 2.3
k
k
The systems shown in figures 2.1 and 2.2, and equation (2.1) represented in the new
compart-10
ment notation. Band Care ttamount" attributes, X the system volume or size and the ratios
i
and~ the driving forces.
quantitatively, using analytical or numerical methods to yield solutions for each of the model variables.
~f the model system under investigation is large, or contains non-linearities, direct algebraic solution of the equations is often tedious or impossible. Such systems are generally solved using analogue computers or alternatively digital computers programmed to behave as analogue computers. ;
The use of computers in this manner is usually referred to as "computer simulation", or as just "simulation".
Computer simulation techniques have now progressed to such a degree, that it is often more convenient to solve relatively small systems, which have few or no nonlinearities, using
general purpose simulation programs rather than direct algebraic techniques.
On the analogue computer, the equations of the model to be simulated are separated into their component parts (e.g. addition, subtraction, integration etc.), and the components of the analogue computer (e.g. adders, integrators etc.) are
wired together to represent the original equatiO.ns. This prO.cess is illustrated in sectiO.n 2.1 (cf. equation (2.1) and figure 2.2). Each O.f the model variables is represented by vO.ltages which change with time in the same manner as do the sO.lutiO.ns O.fthe equatiO.ns. These vO.ltages may be
plO.tted O.r displayed O.n an oscillO.scO.pe screen autO.matically to' yield visual recO.rds of the equation sO.lutions. AnalO.gue qO.mputation is potentially very fast because analogue
computers operate "in parallel, by having a separate analO.gue cO.mponent fO.r each O.peration in the model equatiO.ns.
AnalO.gue cO.mputers have the disadvantage that they are less cO.nvenient to' set up than digital cO.mputers. Before implementatiO.n, the equatiO.ns have to' be scaled so. that all sO.lutiO.ns lie in the range O.f + 10 volts, to prevent "O.ver-IO.adingtl O.f the analO.gue cO.mpO.nents. When the scaling has been completed the cO.mpO.nents must be wired together, O.r "patched". The scaling and patching phases can be time consuming if performed by hand, althO.ugh prO.grams nO.W exist which can make these processes cO.nsiderably easier (cf. EAI, 1970) ~
Because they are generally easier to' use and are mO.re readily available than analogue computers, much simulatiO.n is now performed O.n digital cO.mputers, O.ften using specially designed simulatiO.n languages (e.g. CSMP, Brennan and
Silberberg, 1968, DSL/90, Syn and Linebarger, 1966; SAAM, Berman and Weiss).
. Simulation languages fall into two. broad groups.
12
of discrete items (e.g. the components used in an assembly line). Examples of discrete simulation languages are GASP
(Pritsker and Kiviat, 1969), GPSS (Herscovitch and Schneider, 1965) and SIMSCRIPT (Kiviat et al., 1968). Discrete
simulation languages are not often used in studying . continuous systems.
The second group consists of "continuous" simulation languages, such as CSMP (Brennen and Silberberg, 1968) and
l,
SIMUL8 (cf. chapter 7). These are used to study models of continuous systems, which are usually based on differential equations. The variables in a continuous system change smoothly from one level to another (e.g. the decay of a radiolabelled chemical in the bloodstream), rather than
abruptly as in discrete systems (e.g. the number of bolts in a bin on an assembly line).
The particular technique used to solve the differential equations numerically varies from one language to another, ranging from a simple second order predictor integration such as the Adams-Bashforth method (.Bashforth and Adams, 1883) used in SIMUL8 (cf. chapter 7), to high order predictor
corrector algorithms such as Milne's method (cf. Noble, 1964), which is used in DSL/90 (Syn and Linebarger, 1966). The
selection of the integration algorithm is usually a
compromise between speed and accuracy. Lower order algorithms tend to be faster and less accurate than high order algorithms
(Gear, 1971).
Two different methods of translating the equations of a continuous system into a simulation language are currently used. The' first, which is used in 1130 CSMP (IBM, 1966),
employs a block diagram approach. In 1130 CSMP, the model equations are translated by the user into a block diagram which is similar to that employed for patching the analogue computer. The interconnections between the system components are entered into 1130 CSJ'.1P the form of tables. Block
diagram oriented languages are often called analogue computer simulators.
In the second method of presenting the model to the computer, the algebraic and differential equations, coded in FORTRAN-like statements, are entered directly into the
computer in the form of a subroutine. DSL/90 (Syn and Lineberger, 1966), 360 CSMP (Brennan and Silberberg, 1968) and SIMULB (cf. chapter 7) are all equation oriented
languages.
Choice of a language for simulation studies is more often than not dictated by what is available to the
simulator. There is no "best" language which suits all people, but rather each simulator has his o~m preferred language.
Later in this thesis (chapter
7),
a simulation language called SIMUL8 is described in more detail. This language has been found convenient to use in investigating metabolic systems such as those described chapters 3, 4 and 6.2.3 Modelling Metabolic an£ Bioc~mical §yptems
Biochemical systems maybe investigated by simulating the chemical and transport processes inherent their
by applying the law of conservation of material or mass (cf. Daniels and Alberty, 1966, p336), and the law of reaction rate (cf. Moore, 1966, p256).
14
These two laws are illustrated by the following example. Consider the chemical reaction
A + B ~ C
Conservation of mass requires the total mass of reactants A
'I
and B, and produc.t C to be constant. Thus
(2.5) Differentiating equation (2.5) with respect to time yields
(2.6)
. If the volume of the solution is V then
[AJ [B]
[C]
(2.7)where [A], [B] and[C] are the concentrations of A, Band C respectively. Combining equations (2.6) and (2.7) yields
:t
[C] = -tt
([A] + [B]).(2.8)
The law of reaction rate relates the rate of product formation to the reactant concentrations. Thus
it
[C] = k [A][B]= -
'it
([A]+
[B]) (2.9)where k is the reaction rate constant.
The reaction shown in equation (2.4), is defined as a second order reaction because equation (2.9) involves the product of,two concentrations. This should not be confused
with a second order system in control theory which is a system involvi.ng a variable and its first and second deriva-tives.
Often in biochemical sys·~ems one of the two reactants is present in abundant quantities which reduces the effecti.ve order of the reaction from second order to first order.
Thus if
d
[AJ
o ,
dt ~ (2.10)
then
d [C] k I [B]
dt
,
(2.11 )where
kl = k [A] (2.12)
All chemical reactions are to some extent reversible (cf. Daniels and Alberty, 1966, p338). That is, the products have a tendency to decompose to form the original reactants. Equation (2.4) would therefore appear as
k1
A + B + --7'- C
,
(2.13 )k2
and equation (2.9) is extended to the form
(2.14 )
16 Chemical reaction rates are often altered in the
presence of catalysts or enzymes, the latter being a catalyst which affects a specific reaction. Catalysts may increase, or may decrease both the forward and reverse rate constants proportionately, and thus they do not affect the equilibrium of the reaction.
The action of a catalyst may be studied using the Michaelis Menten model (cf. Moore, 1966, p313), in which I
the following reaction sequence occurs
14:3
- E + P , (2.15)
whereE is an enzyme or catalyst, S a substrate or reactant, P a reaction product and the substance ES is a complex of the enzyme and substrate. The enzyme is not consvrned by the reaction and undergoes no chemical change other than the complexing shown in equation (2.15). Thus,the total amount of enzyme present at any stage equals the initial amount of enzyme. In other words
[E] + [ES] = [EJ O (2.16)
where [E]6 is the initial enzyme concentration. The mass . balance equations for the reactions in equation (2.15) are
d [ES]
k1 [S] [E] - (k2
+
k3) [ES] ,dt
=
(2.17)d [S]
k2 [ESJ - k1 [S] [E]
dt
=
(2.18 )d [pJ
k3 [ES]
After an initial transitory period the concentration of ES . reaches a steady value and
(2.20)
By eliminating [ES] and [E] from equations (2.16), (2.18), (2.19) and (2.20) the rate of formation of the product P is shown to be
d [pJ dt
which has the form
d· [pJ
dt = 1
+
kb [S] =d [S]
dt
(2.21)
(2.22)
At low concentrations of S the rate of formation of product is linearly related to the substrate concentration, but when
then
kb [S]
»
1 ,d [p]
dt = constant,
and the reaction is said to be saturated. Saturating
(2.23)
(2.24)
mechanisms such as this are discussed further in chapters 3 and
4.
In certain situations a fifth substance called an
complex with the enzyme, so reducing the amount of enzyme available for product formation. Thus
18
k4
I + E . 4 • EI , (2.25)
k5
where I is the inhibitor. By using a similar analysis to . that above it can be shown that in the presence of an
inhibiting agent I, equation (2.22) becomes
d [pJ
dt
=
d [S]
dt (2.26)
It is seen from equation (2.26) that as [IJ increases, the rate of product formation decreases, a process called
inhibition.
Biochemical transformation often involve consecutive reactions, where a basic molecule has many small chemical changes made to its structure. Such a transformation mqy be written as
(2.27)
In many situations, some of the rate constants k
1 to k5 in equation (2.27) are so large that the preceding reactant will be present in negligible quantities, and may be neglected in the mathematical analysis. Thus if k2 and k4 are very large when compared to k1' k3 and k5 we may reduce equation (2.27)
to . ,
(2.28)
without affecting the mathematical description of the system •.
In a similar vein, if two sUbstances in the sequence· are. chemically ,indistinguishable from each other,. they may be grouped together for the purposes of analysis with little effect on the observable dynamics of the system. Models involving consecutive reactions, such as those described
20
CHAPTER 3
REVIEW OF ADRENAL CORTICAL SYSTEM LITERATURE
The adrenal cortical system consists of the adrenal cortex (which is the outer part of the adrenal gland), the substances it secretes, the· bodily processes that these
substanc.es control, and a number of other hormones and glands I
which affect the adrenal secretions. The adrenocortical secretions are essential to life because of their function in controlling systemic concentrations of the minerals sodium and potassium, and the carbohydrate glucose.
Recently, dynamic models of the adrenocortical system have been developed to aid the understanding of, and
experimentation on, this complex system.
In this chapter the operation of the adrenocortical
system, and the experimental procedures used in its analysis, are summarized. Ten models of the adrenocortical system, which are cited in the literature, are described, and their features compared.
3.1 "The Adrenocortical System
Although more than forty different hormones are
produced by the adrenal gland, only three (viz. aldosterone, cortisol and corticosterone) are known to be important.
Aldosterone controls sodium and potassium concentrations and so is called a mineralocorticoid. Cortisol (more important in humans and sheep), and corticosterone (more important in rats), control glucose concentration and are called
glucocorticoids. All three hormones are formed from cholesterol by the chemical processes of figure 3.1.
CHOLESTEROL
/"
~
20 a. HYDROXYCHOLESTEROL 22~ HYDROXYCHOLESTEROL
~
/
20u 22~ DIHYDRfXYCHOLESTEROL
• PREGNENOLONE
17~ HYDROXY- .~. , I·
PREGNENOLONE
W
PROGESTERONE
/
~
17a HYDROXYPROGESTERONE '11 {3 HYDROXYPROGESTERONE
t
~
/
11DEOXYCORTISOL 21 DEOXYCORTISOL
\
. /
~CORTISOl:! CORTICOSTERONE
J:"
ALDOSTERONE-Figure 3.1 The main biosynthetic pathways by which cortisol, corticosterone and aldosterone are formed from cholesterol.
Secretions of the glucocorticoids and mineralocorticoids are controlled by the hormones ACTH (adrenocorticotrophic hormone), and angiotensin II respectively. ACTH ~s a polypeptide produced in the pituitary. ACTH is in turn controlled by CRH (corticotrophin releasing hormone), a neurohormone produced in the hypothalamus in response to
.,
Midbrain
Noxious stimuli Glucocorticoids Hypothalamus / / / / / ' / '
- ACTH and
Glucocorticoids --- Neural stimuli
Adrenal Cortex Glucocorticoids Ul
'd ~---.~--~.~ Glucocorticoids o ( j .~ ..p S-! o (j o ( j ~ t; ACTH 22 Pituitary CRH ACTH
Figure 3.2 Control of cortisol or corticosterone secretion. From Frieden and Lipner (1971).
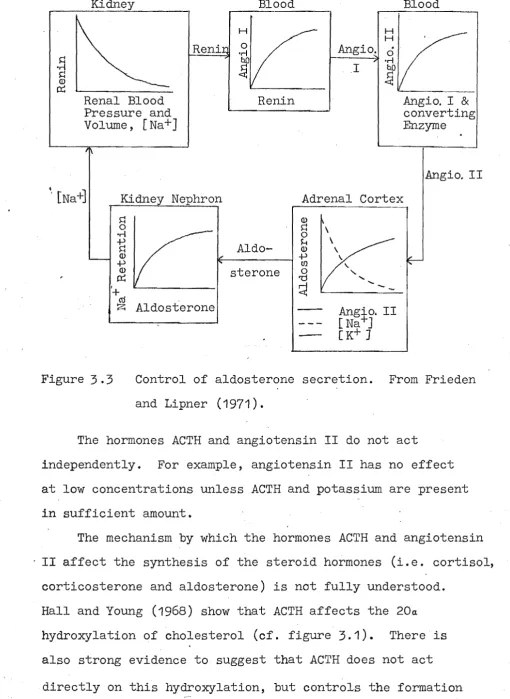
directly. The path, which is shown in figure 3.3,
incorporates parts of the kidney, and enzymes present in the blood. The hormones angiotensin I, angiotensin II, and renin are the intermediates in the aldosterone control loop.
In figures 3.2 and 3.3 the control mechanisms for both the glucocorticoids and the mineralocorticoids are shown as closed loop systems. That is, they contain feedback, which allows the concentrations of the corticoids to be auto~ati-cally controlled. The evidence for and effect of the closed ~-~-._.loop control of the glucocorticoids is discussed in section
3.2.
[image:33.570.23.542.25.661.2]Kidney Blood Blood
H H
H
Reni Angio. 0
.
s:l .r-!
.r-! I bD
s:l ~
(!)
0::
Renal Blood Renin Angio. I &
Pressure and converting
[Na+]
Volume, Enzyme
Angio. II Kidney Nephron
s:l
o
.
.-\~
Aldo-(!)
~
~ sterone
'+
~
AldosteroneAdrenal Cortex
\ \
\
\
\.
"- ... ...
Angio. II [Na+J [K+ ]
Figure 3.3 Control of aldosterone secretion. From Frieden and Lipner (1971).
The hormones ACTH and angiotensin II do not act
independently. For example, angiotensin II has no effect at low concentrations unless ACTH and potassium are present in sufficient amount.
The mechanism by which the hormones ACTH and angiotensin II affect the synthesis of the steroid hormones (i.e. cortisol, corticosterone and aldosterone) is not fully understood.
Hall and Young (1968) show that ACTH affects the 20a
[image:34.570.23.534.53.753.2]of the intermediary cyclic AMP (cyclic 3'5' adenasine monophosphate), within the adrenal cells (Haynes, 1958; Haynes et al., 1959). Figure 3.4 shows the proposed
mechanism of ACTH action as summarized by Clegg and Clegg (1969) •
ACTH
I I
+.!t
ATP + Cyclase - - - - . . ! . - - - ? ) Cyclic AMP
24
Active Phosphorylase .c:./ _ _ _ _ _
J~
InactiveI 7 Phosphorylase
I ~+
Glycogen---~---7> Glucose-i-phosphate
6-phosphogluconic Acid Glucose-6-phosphate
'\
+
TPNH
I
I
+
TPN J,+
Cholesterol---77 Pregnenolone - - - 7 ) Corticoids
Figure 3.4 Proposed mechanism of ACTH action. From. Clegg and Clegg (1969).
3.2 fhe Glucocorticoid System as a Closed Loop Adaptive Controller
The glucocorticoid system is composed of a number of physically separate parts or subsystems, each with a specific function. Communication between these subsystems is provided by hormones, which act as chemical signals, transported by the bloodstream. The glands of the system have two
functions - transduction and amplification. That is they change the signal from one form to another, and at the
same time they increase the signal strength or hormone concentration.
All of the hormonal signals undergo some form of degradation in their movement through the blood vessels. They are diluted and metabolized, and may be bound to
proteins and other substances in the blood. All of these. degradative processes reduce the amount of the hormone which c.an act on the lttarget organ" (i.e. the organ in which a hormone acts, such as the adrenal gland in the case of ACTH ).
The glucocorticoid concentrations in the blood are under closed loop control, however, the nature, and the point of action of the feedback, is not clear. That feed-back is present is demonstrated by numerous experiments. Espiner et ala
(1972
b) inject dexamethasone (a synthetic steroid resembling cortisol in structure and action) into sheep while measuring cortisol secretion rate. Following the injection, cortisol secretion ceases. Conversely, plasma ACTH concentrations are high after adrenals are removed (Hodges and Vernikos,1960),
and where they fail(Bethune et al.,
1957).
All of these experiments suggest that feedback is present but do not show its form, or where it acts.26 which seems to exclude glucose concentration as the feedback
signal.
Yates'and Urquhart (1962) propose from inconclusive evidence that the concentration of unbound cortisol (i.e. cortisol which is not bound to such substances as transcortin or albumin) in the blood provides the feedback.
Frieden and Lipner (1971) report on experiments in which steroid hormones implanted in the midbrain cause adrenal
secretion of cortisol to fall. While this suggests that steroids are detected by the neural system, the large doses of steroids used may not be representative of physiological levels of steroids reaching the brain.
There is a strong possibility that there is more than one feedback path. Dallman and Yates (1969) propose that cortisol concentration is detected by two regions of the
hypothalamus - the median eminence and septal regions. Also, the presence of a minor control loop proposed by Kraicer and Conrad (1971). They show that plasma ACTH concentration affects the pituitary secretion of ACTH. The relative
importance of these three feedback paths has not been shown, but it is likely that only one or two have predominating effects in the regulation of glucocorticoid synthesis.
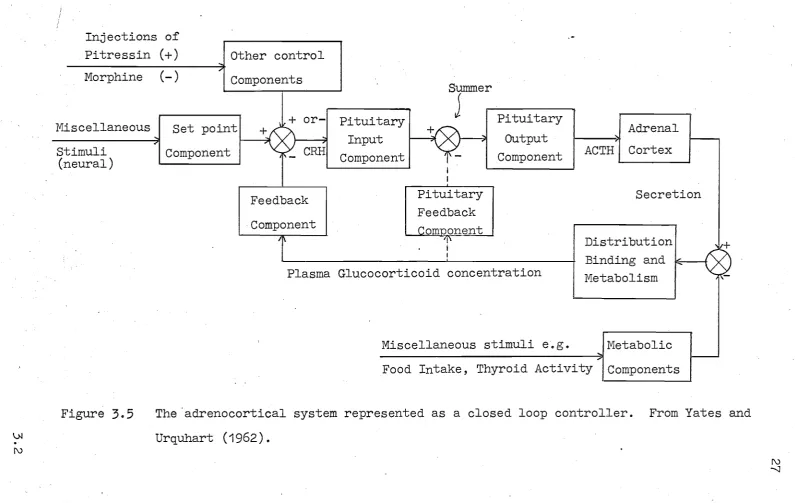
Yates and Urquhart put forward a theory for
glucocorticoid control which is popularly called the "set point theory". The essence of this theory that the system is controlled by neural signals which adjust the set point of a simple closed loop controller (cf. figure
3.5).
Evidence for such a closed loop system is provided by Yates et ala(1961). They inject separately, and in pairs, the substances
\J.I
.
(\J Pitressin Morphine Miscellaneous stimuli (neural)Figure
3.5
....
'"
(+ ) other control (-) '" Components
+ or-Set pointl +
Component
-,.
,"
-
CRRFeedback Component
/f\
Summer
Pituitary
J
Input Component Pituitary Feedback ..Q.Q.rrmonent 11\ i I Pituitary Output
Component ACTH
Adrenal Cortex
Secretion
Plasma Glucocorticoid concentration
Distribution Binding and
k-f--+
MetabolismMiscellaneous stimuli e.g. Metabolic
.... I
-Food Intake, Thyroid Activity IComponents
11+
1'-The 'adrenocortical system represented as a closed loop controller. From Yates and Urquhart ( 1962) •
(\J
28
ACTH" corticosterone, and histamine (a noxious stimulant acting in the neural regions which causes the adrenal to
increase corticosterone synthesis), into the rat. The amount of each substance injected is adjusted to produce similar increa.ses in the concentration of corticosterone in plasma
(cf. figure
3.6).
The increase in the concentration of corticosterone, when both ACTH and corticosterone are tnjected simultaneously, is nearly twice that followingEl
o o..-~
roa
ttl ro rl Pis::
·rot Q) s:: o H Q) -P ttl o o ·rot -P H o o 50I- -
-, Figure
3.6
-QO ::t C\J ..-Q) s:: 0 H Q) -P ttl 0 0 ·rot -P H 0 01
' r-I
r-~.
r-a>I
s:: ....·rot
....
s
:r: cO
E-I -P
0 ttl
<tl ~
QO +
::t +
Q)
0
s::
Q)~
0 0s::
..-
H 0Q) H
r--- If\
.
--
Q) - -,- -P ---
Q) - - --r---rIs::
ttl -PC\J ·rot 0 ttl
@ 0 0 rl
·rot 0 0
::r:: -P -P ·rot H
E-I ttl H -P
t
0 ·rot 0 H
<tl ::r:: 0 0' 0
0 0
Response of rats to various substances injected separately and in pairs. From Yates et'al.
(1961).
I
=
+
1 standard error of the mean.injection of the two substances separately. In contrast, injection of both histamine and corticosterone does not ,produce a significant increase in,the corticosterone
injection of any two of these substances would produce a concentration increase twice that for one of the substances on its own. With closed loop control, as proposed in
figure
3.5,
corticosterone and histamine act in opposition at the set point, thus nullifying the effect of the latter substance.Although the edback signal in the set point theory is the concentration of glucocorticoids, it is unimportant to the·operation of the control loop whether the glucocorticoids, or their effects, provide the feedback; the end result,
i.e. control of glucocorticoid effects, will be the same which ever form the feedback takes.
Following continued administration of ACTH, increases in the weight of the adrenal glan~ are observed. These changes occur over a much longer time scale than the observed
30 In this section the glucocorticoid system has been shown . as being independent of its environment. In fact this is not so. Many researchers (cf. Yates and Urquhart, 1962) show qualitatively, that the state of the glucocorticoid system is affected by a number of other variables. Bloodflow, the concentrations of steroid cofactors, precursors and enzymes, and the state of closely associated endocrine systems, all
~fect the operation of the glucocorticoid system and must
all be considered when the system is analysed or modelled. For example, insulin, which is secreted by the pancreas, acts in opposition to the glucocorticoids in regulating glucose production. In practice most of these factors are expected never to dominate the control system.
3.3 Adrenal Cortex Experimental Procedures
A number of experimental procedures are used in the analysis of the adrenal cortex, each complementing the others in determining how the gland functions. Three techniques (viz. in vitro studies, perfusion studies and autotransplant studies) are now described •
. With in vitro studies the adrenal gland is removed from the animal and maintained in a "live" state by immersion in a solution with properties similar to those of blood.
Various hormones and chemicals may then be added and allowed to incubate, or to act on the adrenal cells. Following
Radio-chemical labelling of hormones and precursors is commonly used for tracing the biosynthetic paths in the gland in "in vitro" studies. However, care must be taken when interpret-:-ing the results from in vitro studies. In extrapolating such results to the in vivo system, the following points must be considered.
The incubation medium cannot have identical p~operties to the blood which normally flows through the gland.
The stimulants added to the tissue medium must be added so that the cells are subjected to similar concentra-tions to those formed in the in vivo system.
The blood" is continually adding and removing
substances, whereas this is not true with in vitro studies, except insofar as diffusion provides transport.
Notwithstanding these points, in vitro experiments have provided much information on the biochemical processes
occurring in the glands, much more readily than in vivo experiments provide.
Because of the inaccessibility of the adrenal glands -they are sited on the kidneys - in vivo experiments require surgical techniques to gain access to the glands. The two following techniques are commonly used.
The perfusion technique is used by Urquhart and Keller (1971) for in situ analysis of the adrenal of dogs. Blood drained from the carotid artery of the dog is mixed with perfusion hormones (e.g. ACTH) , and pumped into the adrenal -artery, which has been disconnected from its normal'point .of supply.. A catheter, inserted in the adrenal vein,
32 removes sufficient blood, at approximately one minute
intervals, for subsequent analysis. The surgical preparation of animals for perfusion studies involves removal of the
kidneys and the intestinal blood supply. The pituitary gland is also removed to eliminate the source of endogenous ACTH. Such experiments are costly because of the surgery· required, and the fact that the animal must be sacrificed ~t the end of an experiment. Only input-output relationships between the hormones may be studied, but many of the variables external to the gland, such as blood flow rate, are able to be kept constant. Results obtained from such perfusion studies are discussed in the next section (section
3.4).
The second in·vivo technique involves transplanting the adrenal gland from its normal position, to one which is more accessible (cf. Beaven et al., 1964). The right hand adrenal gland is completely removed from the animal, while the left is transplanted to a specially prepared loop of skin in the neck. This loop contains the carotid artery and jugular vein, to which the adrenal gland is joined surgically.
Hormones and other substances may be infused into the gland by pumping them into the carotid artery through a cannula. Blood samples for analysis are siphoned from the jugular vein. The two blood vess are suitably clamped to ensure that all of the material infused passes through the adrenal, and that little material secreted by the gland can reenter the animals general circulation. This experi-mental preparation provides good access to the adrenal gland
once the initial surgery has been performed. The animals may be reused in experiments over a period of years without
the need for anaesthesia. This technique has most of the advantages of the perfusion technique except for control over blood flow rate.
In conclusion the advantages and disadvantages of the three techniques described are listed in table 3.7.
Table 3.7
'.
Attributes of three experimental techniques for adrenal analysis.
ATTRIBUTE EXPERIMENTS IN VITRO PERFUSION AUTOTRANSPLANTED
Surgery Necessary Simple
Animal Sacrificed Yes Access to Parts of Possible
Cell
Access to Parts of Possible Gland
Control Over Blood
-flowControl Over Other Yes Substances in
the Blood
Dynamic Studies Difficult Possible
Relationships Intermediate
Found Biochemical
Changes and Interrela-tionships
STUDIES ADRENAL GLAND
Difficult Difficult prior for each to first experi-experiment ment
Yes No
No No
..
No No
Yes No
Often Often Difficult Difficult
Yes Yes
Input- Input-Output Output Relationships
Relation-ships
3.4 Results from Dynamic Studies on the Adrenal Cortex Experiments on the adrenal cortex, which either the
(
allow the dynamic response of the gland to stimulation by ACTH to be measured. In this section a summary of these responses is given.
34
Following a step increase in the concentration of ACTH, cortisol secretion rises rapidly, reaching a peak in about ten minutes. Subsequently the secretion rate falls slowly reaching a steady level, which is between 60 and 70 per cent of the peak level, in about forty minutes (cf. figure 3.8; Urquhart et al., 1970).
Cortisol Secretion
Rate (pg/ml)
[ACTH] (pU/ml)
Figure 3.8
o
~ t~jl-
__
--r-_-L-_", _ _ _-;:>~
Timeo
80 (Min)Cortisol secretion following a step change in ACTH concentration from 0 to 2 ;tU/ml. From Urquhart et ale (1970).
Removal of the ACTH causes cortisol secretion to fall monotonically to low levels. The overshoot may be repeated by reapplying the ACTH after a further forty minutes at least. If the ACTH is reapplied after only five minutes, there is little or no overshoot (cf. figure
3.9;
Urquhart. and Li, 1968).I
Cortisol Secretion
Rate
(~g/min)
[ACTH] (IIU/ml)
10
0
2
o
Time (Min)
.
o
200Figure3.9 Repeatability of overshoot with short and long periods between ACTH infusions. From Urquhart and Li, 1968.
The overshoot to appear, also, if very high concentra-tions of ACTH are infused (cf. figure 3.10). In this case
8
Cortisol Secretion
Rate
(~g/min) 0
[ACTH]
(fU/ ml )
Figure 3.10
30
o
--T---~---~---~ Time (Min)o
60the cortisol secretion reaches a saturation, the form of which is shown in figure 3.11 (Urquhart et al., 1970). Furthermore, when high ACTH concentrations are used, the decline in cortisol secretion when ACTH is removed is
36
further prolonged (cf. figure 3.12; Li and Urquhart, 1969).
Cortisol Secretion
Rate
Figure 3.11 10
o
1
o
v
•
y
,
,
10 100 1000
[ACTH] in Blood (~U/ml)
3.5 - 4
ml/minjAdrenal Flow 7.0 - 8 ml/min
steady state relationships between cortisol secretion rate and ACTH concentration at different blood flow rates. From Urquhart et al., 1970.
The results in figures 3.8 to 3.12, show that the response of the adrenal cortex to ACTH is highly non linear and depends not only on the current concentrations of ACTH in the gland, but also on the amounts of ACTH infused up to forty minutes prior to an observation.
"
Cortisol Secretion
Rate Cug/min) [ACTH] (pU/ml)
Figure 3.12
6
o
30
o
T~
o
Time (Min)
2
I
J
030
1
Decay of cortisol secretion rate following cessation of ACTH. Two infusions are shown i.e. 30 ~U/ml and 2 ~U/ml. From Li and' Urquhart,1969.
3.5
Glucocorticoid System ModelsTh~ operation of the glucocorticoid system is summarized as follows.
Nervous stimulation of the hypothalamus near the brain produces a secretion (CRH) which excites the pituitary to produce a polypeptide ACTH.
ACTH, as its name adrenocorticotrophic hormone implies, stimulates the adrenal cortex to synthesize a steroid
cortisol (or corticosterone) from cholesterol through about a dozen known chemical transformations •.
Cortisol is carried by the blood back to the region of the pituitary and hypothalamus where it suppresses the
production of ACTH. Both cortisol and ACTH can be estimated chemically, and their interaction is apparent from such
38 This is the system which is to be modelled, so that its behaviour as a function of time can be imitated and predicted quantitatively. In the remainder of this chapter, published models of the glucocorticoid system and its component parts are described.
The first dynamic model of the whole glucocorticoid system was published by Urquhart et ale
(1959).
Theirhydraulic analogue of the pituitary-adrenal system shows the main features of this system (cf. figure 3.13). It has more recently been extended and refined to accommodate new data. The operation of the hydraulic model is now described.
Hypothalamus?
o
Level Setting Device
Plasma Cortisol
Conc.
((!Extra Hepatic Metabolism
L
Adrenal Cortisol Secretion
Liver Load
~
V1
~
Hepatic ,
Metabolism
'!~~
,IFigure 3.13 Hydraulic analogue of pituitary adrenal system. From Urquhart et ale
(1959).
Water in a tank, representing cortisol, is released via two valves. The first is controlled by liver enzymes which degrade cortisol, and the other is fixed, representing other degradative pathways. The flow from both valves is
dependent on the height of the water in the tank. Water enters the tank by a third valve, representing the adrenal cortex, which is controlled by a level sensitive device, the hypothalamus and the pituitary, which opens the valve when the water level falls. The action of the model is
similar to the common water cistern in which the height of the water is maintained at a steady level.
While the hydraulic model describes most of the important features· of the glucocorticoid system, it
oversimplifies many of them. Some of these simplifications are listed below.
Cortisol exists in plasma in a number of forms e.g. free or "nativefl cortisol, and bound cortisol. It is
thought that only the free cortisol affects the feedback site in the hypothalamus (cf. Yates and Urquhart, 1962). In the hydraulic model there is no distinction made between the different forms of cortisol.
The rate of secretion of cortisol is assumed to be a linear function of ACTH concentration, whereas in reality the relationship between the two hormones is appreciably nonlinear (cf. Li and Urquhart, 1969).
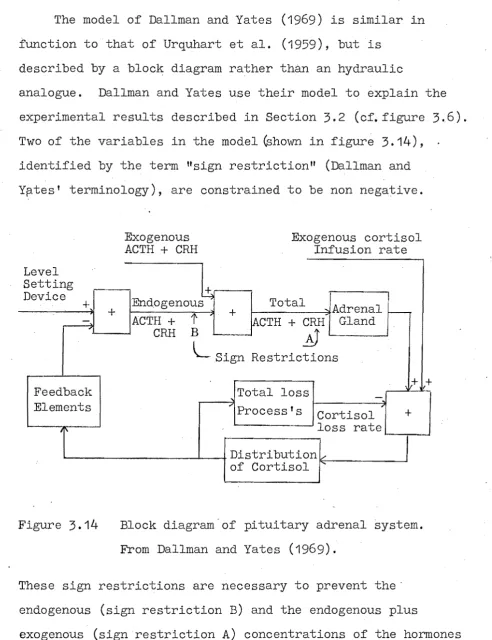
The model of Dallman and Yates (1969) is similar in function to that of Urquhart et al. (1959), but is
40
described by a block diagram rather than an hydraulic
analogue. Dallman and Yates use their model to explain the experimental results described in Section 3.2 (cf.figure 3.6). Two of the variables in the model ~hown in figure 3.14),
identified by the term "sign restrictionll (Dallman and Yp.tes' terminology), are constrained to be non negative.
Level Setting Device
+
+-
, Feedback Elements [image:51.570.49.542.46.687.2]~ i'
Figure 3.14
Exogenous ACTH + CRH
+ EndogenousY ACTH +
t
CRH B
+
Exogenous cortisol Infusion rate
Total Adrenal
... '
-~CTH + CRH Gland
~
L
Sign Restrictions+
Total loss
-.. Process f s
Cortisol + loss rate Distribution v
of Cortisol ....
Block diagram'of pituitary adrenal system. From Dallman and Yates (1969).
+
These sign restrictions are necessary to prevent the' endogenous (sign restriction B) and the endogenous plus
exogenous (sign restriction A) concentrations of the hormones CRH or ACTH becoming negative. Analogue computer simulation of the model shows that these sign restrictions must be
and Yates
(1969;
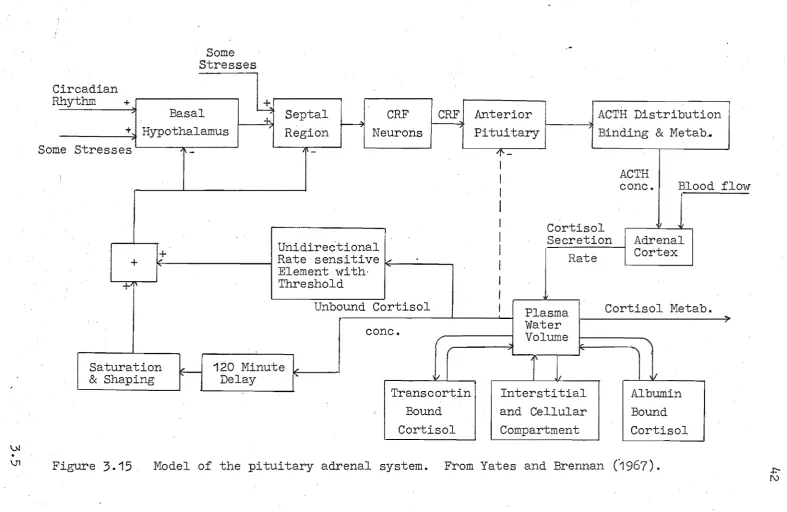
cf. section 3.2). Sign restriction A is unnecessary providing exogenous CRH and ACTH infusions are maintained positive.The most complex published model of the glucocorticoid system is that due to Yates and Brennan
(1967),
which is also described by Yates et ale(1968).
Their model isreproduced in block diagram form in figure
3.15.
Important a~pects of the model are listed below.Three forms of cortisol are described in the model. These are, firstly, free cortisol, which is shown distributed into two compartments - the plasma and the extracellular
spaces; secondly, cortisol which is bound to the plasma protein albumin,and finally cortisol bound to a sUbstance called "transcortin".
The non linearities known to occur in the inter-action of ACTH and cortisol, are described by the
"Unidirectional rate sensitivell adrenal model which is
described in the next section (section
3.7).
The metabolism of ACTH, i.ts binding to SUbstances in the blood and its distribution in the plasma compartment are accounted for by the model.
Only the free cortisol affects the feedback path, this feedback acting at two sites in the hypothalamus - the median eminence and septal regions.
\.>l • \J1 Circadian Some Stresses + Basal ______ ~~Hypothalamus
+
I
~
SeptalH
CRF~
Region NeuronsSome Stresses~----~---~
CRF
J
AnteriorPituitary 1 - - - l I I
ACTH Distribution Binding
&
Metah.ACTH
conCa Blood flow
+
Unidirectional
It
I
Rate sensitive i<:k----...Element with· Threshold
+
Unbound Cortisol conca
/
Saturation
H
120 Minuter--
111
&
Shaping DelayI
TranscortinI
Bound Cortisol Cortisol Secretion Plasma Water.
Adrenal CortexVolume
k:
-,
[image:53.824.12.800.29.541.2]Interstitial Albumin and Cellular Bound Compartment Cortisol
Figure
3.15
Model of the pituitary adrenal system. From Yates and Brennan(1967).
,
Yates and Brennan (1967) have adjusted the parameters of their model so that the model.variables (e.g. the various hormone concentrations) are representative of a small dog. The response of the model, particularly that of the
variables cortisol and ACTH, provides a close account of
reality. However, some of the model variables are not easily compared with their physical counterparts because the
5Mbstances cannot be measured. For example, pregnenolone concentration within the cell might be important, but is impossible to measure in the in vivo system.
Many of the glucocorticoid subsystems (e.g. the neural regions), are modelled as functional blocks which provide the right sort of input-output relationships - little attention has been paid to whether the mechanisms of these blocks mimics the real system, simply because so little is known about these regions. Operationally these blocks provide an adequate account of the function of these regions until better information is available.
Empirical mathematical functions are used to describe the input-output relationships of the adrenal gland and hypothalamus-pituitary complex in models developed by Dolkas and Leon (1970), and Stoke ly and Howard (1972). These models describe the time response of corticosterone and ACTH concentrations in the plasma of rats, following injections of corticosterone. In Stokely and Howards'
(1972) model, infusions of CRH (cf. section 3.1) and