MODELLING THE EFFECTS OF PHASE
CHANGE MATERIALS ON THE ENERGY
USE IN BUILDINGS
Jasper Prins (s0112240)
CIVIL ENGINEERING AND MANAGEMENT
GRADUATION COMMITTEE Prof.dr.ir. A.G. Dorée ir. A.G. Entrop
FEBRUARY 2012
Index of document: Modelling the effects of Phase Change Materials on
the energy use in buildings
Paper 4.
Abstract 5.
1 Introduction 5.
2 Research methodology 6.
3 Thermal behaviour of the boxes 11.
4 Data experiments and model 14.
5 Discussion 18.
6 Conclusions & Recommendations 19.
Acknowledgements 20.
References 20.
Research Proposal 22.
Index 23.
1 Problem statement 24.
2 Goal 26.
3 Research questions 26.
4 Materials and methods 33.
References 35.
Documentation on the Paper 37.
1 Digital available documentation 38.
2 Initial characteristics test boxes 38.
3 Used types of sensors 38.
4 Overview thermocouples test-boxes 39.
5 Physical characteristics construction components test boxes 40.
6 Solar radiation and outdoor temperatures of 4-6-2011 till 9-6-2011 42.
7 Solar radiation and outdoor temperatures of 8-7-2011 till 13-7-2011 46.
8 Solar radiation and outdoor temperatures of 19-8-2011 till 24-8-2011 51.
9 Averages and standard deviation on indoor temperatures 56.
10 Blueprints heavy insulated boxes 58.
Paper: Modelling the effects of Phase Change
Materials on the energy use in buildings
Modelling the effects of Phase Change
Materials on the energy use in buildings
Results of Experiments and System Dynamics Modelling
Abstract
The current era is in need for more and more sustainable energy solutions. Phase Change Materials (PCM’s) are a solution for a more sustainable build environment because they can help to reduce the energy use of
buildings during heating and cooling of the indoor air. This paper presents the results of recent experiments that have been executed with test boxes. In addition a System Dynamics model has been developed to find out how PCM’s can be used efficiently without testing in reality.
The first experiment, in which PCM’s were applied in a concrete floor, shows a reduction of peak temperatures with 4˚C ± 0.7˚C on maximum temperatures and over 1.5 ˚C ± 0.7˚C on minimum temperatures during warm periods. The model confirmed these findings, although the predicted reductions were slightly. During the second experiment more PCM’s were applied by mounting them into the walls using gypsum plasterboard to increase the latent heat capacity. Remarkably, both the experimental set-up as the model showed that the increase of PCM´s (of almost 98%) causes hardly any difference compared to the first situation. Adapting the exterior in a way to absorb more solar energy, increases the average indoor temperature but decreases the reduction of peak temperatures. Again the model confirmed these findings of the experiment. These results show that the effect of PCM’s varies on different climatological contexts and with different construction components physics. This means no straight forward advice on the use of PCM’s for a building design can be given. The solution for this problem is provided by the model, showing that the effects of PCM’s can be modelled in order to use PCM’s in an effective way in different climatological contexts and with different characteristics of construction components. The research shows that a simple model is already capable of predicting PCM performance in test boxes with reasonable accuracy. Therefore it can be used as a template for designing improved tools to come to an effective use of PCM’s in buildings.
1
Introduction
The energy consumption of the built environment accounts for more than 40% of the total energy consumption in Europe (EC, 2002). Therefore, lowering the energy use of the built environment would have a large impact on the reduction of greenhouse gasses (carbon emission) and improving the environment. One way to achieve significant energy savings in the built environment in the Netherlands and therefore in the total Dutch energy consumption, is to lower the energy use for heating and cooling of dwellings.
So the power of PCM’s is its characteristic of phase transition and the storage (or releasing) of thermal energy during this transition.
PCM’s are used already in constructions for a while using active systems. The use of PCM’s in construction materials in a passive way is relatively new. The great advantage of passive use is the ease of mixing the PCM’s with for instance concrete, but they can also be mixed with plaster. Also the application of PCM treated bricks is known (Lai & Chiang, 2006). In all these cases of passive use, no extra systems or layers need to be added into a construction, avoiding extra labour. Also no extra maintenance of a system is needed.
Currently, reducing energy consumption is mainly focused on new buildings. “The upgrading and maintenance of existing buildings receives little attention in the context of carbon reduction although it contributes to the lifetime carbon emissions in a way that cumulatively may be significant (Forster et al., 2011).
The application of PCM’s in traditional construction materials makes it also easier to be applied in existing buildings, so also in the context of carbon reduction (energy saving) PCM’s can offer a solution in the existing built environment. Gypsum, for instance, can absorb up to 25 weight percentage of PCM. Research by Feldman et al. (1989, 1991) shows that gypsum–PCM composite can be used to reduce overheating. Gypsum wallboard has also been studied, numerically and experimentally in a full scale test room (Athienitis et al, 1997). “Their numerical results are in good agreement with experimental data. Moreover, the PCM used shows a decrease in overheating and a decrease of energy consumption” (Kuznik & Virgone, 2009). Schossig et al. (2005) integrated microencapsulated PCM into gypsum wallboard. Their full size tests show that such composite lowers the temperature by up to 4°C.
2
Research methodology
The next section explains methodology of the research that has been conducted.
2.1 Previous PCM research
Entrop et al. (2010, 2011) performed already some research on PCM’s in concrete floors in test boxes. These test boxes appeared to be available and suitable for this research, because the dimensions of these boxes are already carefully determined: “The references for the dimensions of the scaled boxes are the living room of the standardized row house of SenterNovem (2006) and the test boxes used by Kissock et al. (1998)”(Entrop et al., 2010). The main conclusion from the previous conducted research was: “The application of PCMs in concrete floors resulted in a reduction of maximum floor temperatures up to 16 ˚C ± 2% and an increase of minimum temperatures up to 7 ˚C ± 3%. The results show the relevance of an integral design in which the thermal resistance of the building shell, the sensible heat capacity of the building and the latent heat capacity of the PCMs are considered simultaneously” (Entrop et al., 2011).
In the previous research using the experimental set-up, PCM's were applied in the concrete floor only. As mentioned before, PCMs can easily be applied in other construction materials as well, like gypsum plasterboard. This makes it possible to increase the latent heat capacity of a(n) (existing) construction by applying it in other construction parts, besides the floor. However, does this make any difference for the indoor climate? Therefore the first experiment will be the application of gypsum plasterboard in the test boxes. In box A and C (with PCM's), so called Smartboard (Knauf, 2006) will be applied. Smartboard is gypsum plasterboard integrated with PCM's, called Micronal (BASF, 2009).
PCM's are used more efficiently while they can be charged further and more often (during colder periods compared to non-black boxes).
2.2 Experimental set-up
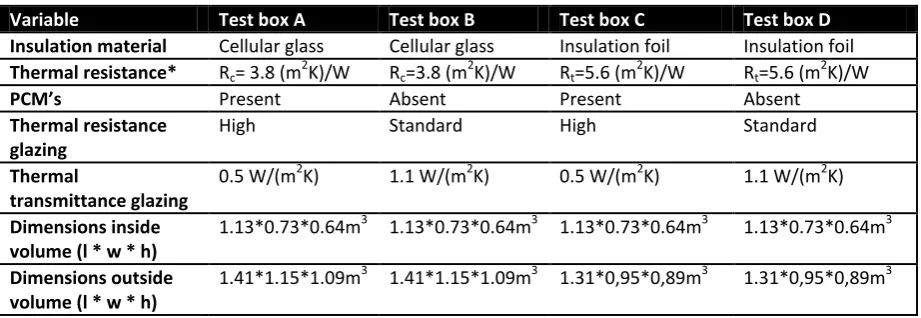
The reference Dutch row house has got a ground surface of 8.92 x 5.10 m2 (l × w) with a living room of 26.1 m2. The internal height of the first floor is 2.6 m. (Entrop et al., 2010). The sizes of the test boxes of Kissock et al. (1998) are 1.22 x 1.22 x 0.61 m3 (l × w × h). A plastic container with sizes that approaches the dimensions of 1.024 x 1.02 x 0.52 m3 (l × w × h) is used as a base for the test boxes. These sizes make the test boxes approximate a scale of 1 to 5 compared to the reference row house. “These dimensions will result in an air volume that is 115 times smaller and a floor surface that is thirty times smaller than the original living room. The impact of this down scaling is expected to be relatively small, because the mass of air and heat capacity per kilogram are low compared to the mass and heat capacity of the floor” (Entrop et al., 2010). Inside each box, 14 thermocouples (accuracy ±0.5 °C) are installed and at the location of the test boxes a weather station (Davis Advantage Pro 2, accuracy ±0.5 °C) is installed to collect temperature data. The weather station collects data about solar radiation (accuracy ±5%). Two out of the four boxes the floors contain micro-encapsulated PCM’s, so called Micronal (BASF, 2009). In Table 1 a concise description of the used test boxes can be found. BASF (2009) claims the melting point of the used type of Micronal to be around 23˚C, however the experiment of Hunger et al. (2009) shows a transition range of 22.1 ± 0.1 ˚C to 25.2 ± 0.1 ˚C. This transition range will be used in the upcoming experiments. Because of this transition range, it is important to distinguish three situations like Entrop et al. (2011) already stated:
1. the PCM’s are not thermally charged, because of low levels of irradiance and low ambient temperatures lower than 22.1 ˚C;
2. most or even all PCM’s are thermally charged during daytime, because of significant irradiance and temperatures above 25.2 ˚C during the day and below 22.1 ˚C during the evening or night;
3. all PCM’s are thermally charged during the day and stays charged during the night, because of high levels of irradiance and temperatures continuously exceeding 22.1 ˚C.
[image:7.595.66.527.528.687.2]These three states can be used to analyse the results in order to explain the effects of PCM’s on the indoor temperature.
Table 1: Concise description of used test boxes.
Variable Test box A Test box B Test box C Test box D
Insulation material Cellular glass Cellular glass Insulation foil Insulation foil
Thermal resistance* Rc= 3.8 (m2K)/W Rc=3.8 (m2K)/W Rt=5.6 (m2K)/W Rt=5.6 (m2K)/W
PCM’s Present Absent Present Absent
Thermal resistance glazing
High Standard High Standard
Thermal
transmittance glazing
0.5 W/(m2K) 1.1 W/(m2K) 0.5 W/(m2K) 1.1 W/(m2K)
Dimensions inside volume (l * w * h)
1.13*0.73*0.64m3 1.13*0.73*0.64m3 1.13*0.73*0.64m3 1.13*0.73*0.64m3
Dimensions outside volume (l * w * h)
1.41*1.15*1.09m3 1.41*1.15*1.09m3 1.31*0,95*0,89m3 1.31*0,95*0,89m3
* Values are according specifications of manufacturer
During the research four boxes are used which were changed during the research, because of the different experiments. The first experiment will be the baseline experiment, in which the boxes were not changed and will be the same as in the experiment of Entrop et al. (2010, 2011) as described above. For the second
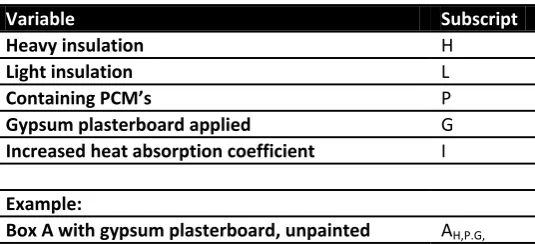
This means the latent heat capacity will be increased with 551kJ from 563 kJ to 1114kJ. For the third experiment, the heat absorption coefficient will be increased as well. This will be done by painting the boxes black where the original colour was white. This means an increase of the heat absorption coefficient of 0.7 from 0.25 to 0.95 (Castenmiller, 2004). To keep the references to the different states of the boxes in the text clear, the boxes will be coded according Table 2.
Table 2: Coding boxes.
Variable Subscript
Heavy insulation H
Light insulation L
Containing PCM’s P
Gypsum plasterboard applied G
Increased heat absorption coefficient I
Example:
Box A with gypsum plasterboard, unpainted AH,P.G,
2.3 Modelling method
In order to perform a sensible and reasonable experiment, first the relevant ins and outs of the test boxes should be familiar. The description above of the set-up of Entrop et al. (2011) is not sufficient to specify the ins and outs. That is why at first a constructional physics model is made. This model contains some blueprints of the test boxes as well as an overview on the used materials with its characteristics, on especially thermo physics.
A System Dynamics model (SD-model) is made based on the characteristics of the test boxes represented in the constructional physics model. In this systems model variables and factors which influence the indoor
temperatures are linked. For this model the software package “VENSIM” is used. “VENSIM is a visual modelling package that allows you to conceptualize, document, simulate, analyse, and optimize models of dynamic systems. VENSIM provides a simple and flexible way of building simulation models from causal loop or stock and flow diagrams” (Ventana Systems, 2007). VENSIM is chosen, because of this simple and flexible way of building models. But also because of its possibility of to visualize the linking of the different factors influencing each other.
2.4 Environmental and climatic context
Figure 1: Average ambient temperatures in the region of Twente 2001-2010 (KNMI, 2012).
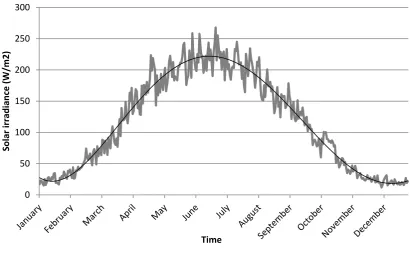
Figure 2: Daily average solar irradiation in the region of Twente 2001-2010 (KNMI, 2012).
During three different periods, experiments are done in order to collect data. At the site weather data was collected by the Davis Advantage Pro 2. For the period of the baseline experiment the outdoor temperature varies from 10.8 ˚C ± 0.5 ˚C to 33.8 ˚C ± 0.5 ˚C and the solar irradiance reaches a maximum of 892 W/m2 ± 5% (see Figure 3). For the second period, where the latent heat capacity was increased, the outdoor temperature varies from 10.9 ˚C ± 0.5 ˚C to 32.2 ˚C ± 0.5 ˚C and the solar irradiance reaches a maximum of 943 W/m2 ± 5% (see Figure 4) For the third and last period, where the heat absorption coefficient was increased, the outdoor temperature varies from 9.7 ˚C ± 0.5 ˚C to 34.8 ˚C ± 0.5 ˚C and the solar irradiance reaches a maximum of 832 W/m2 ± 5% (see Figure 5).
0 2 4 6 8 10 12 14 16 18 20
Tem
perature
˚C
Time
0 50 100 150 200 250 300
Solar
irr
adia
nc
e
(W/m2)
[image:9.595.91.502.330.584.2]
Figure 3: Outdoor temperatures and solar radiation of the 4th of June 2011 till the 10th of June 2011.
Figure 4: Outdoor temperatures and solar radiation of the 8th of July 2011 till the 14th of July.
0 100 200 300 400 500 600 700 800 900 1.000
10 15 20 25 30 35
Solar
ra
diation
(w
/m²)
Outd
oor
Tem
perature
(˚C)
Day
Outdoor solar
0 100 200 300 400 500 600 700 800 900 1.000
10 15 20 25 30 35
Solar
ra
diation
(W/m
²)
Outd
oor
Tem
perature
(C
°)
Day
[image:10.595.95.523.334.538.2]Figure 5: Outdoor temperatures and solar radiation of the 19th of August 2011 till the 25th of August 2011.
3
Thermal behaviour of the boxes
The next section shows how the model has been constructed
3.1 Construction components physics
For this research an existing set-up is used. For the SD-model, the boxes used in this set-up need to be specified, to get a realistic model. Therefore the total -value per side of the test boxes is determined based on the used materials and the surface resistances. “The thermal resistance of an open surface depends upon the conduction, convection and radiation at that surface. The air in contact with a surface forms a stationary layer which opposes the flow of heat. Surface resistances are usually found by consulting standard values that have been found by measurement or by advanced calculations” (McMullan, 2007). Based on the next
characteristics of a material, the - value can be determined:
λ [W/(m * K)] which represents the thermal conductivity of an element; R [(m2 *K)/W] which represents the heat resistance of an element;
U [W/(m2 * K)] which represents the heat transfer coefficient of an element. λ, R and U are material dependent and related to each other;
and, (Equation 1)
, in which: (Equation 2)
- d, is the thickness of the layer [m]
The total R of an element can be determined by summing all individual R-values per material layer. Or in formula form:
, in which: (Equation 3)
- , is the total R-value for the element [(m2 *K)/W]
- , is the summation of . and are surface resistances
(McMullan, 2007) [(m2 *K)/W]
0 100 200 300 400 500 600 700 800 900 1.000
10 15 20 25 30 35
Solar
ra
diation
(W/m
²)
Outd
oor
Tem
perature
(C
°)
Day
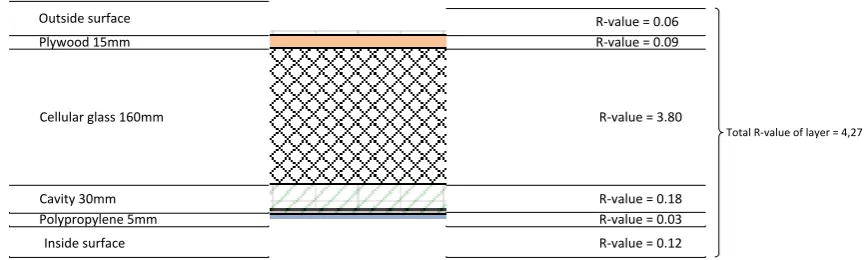
Plywood 15mm
Cellular glass 160mm
Cavity 30mm Polypropylene 5mm Outside surface
Inside surface
R-value = 0.09
R-value = 3.80
R-value = 0.18 R-value = 0.03 R-value = 0.06
R-value = 0.12
[image:12.595.86.519.76.206.2]Total R-value of layer = 4,27
Figure 6: Cross section of test box (heavy insulated, east wall), for each layer the R-value is determined, to determine the total R-value of the cross section.
3.2 System Dynamics model
Based on the characteristics of the experimental set-up a SD-model is created. This model provides insights in the functioning of the set-up as well as the variables influencing the system in a real situation. In this way, the predicted effects of changing those variables can be represented easily without wasting time and resources when changing the real situation without knowing the effects.
A few thermodynamic equations are used in the model, to calculate the indoor temperature, based on conduction of energy through the different sides of the boxes. Conduction through an element can be described as:
, in which: (Equation 4)
- Q, is the energy flux through the element [W] - A, is the surface of the element [m2]
- ΔT, is the difference in temperature between the indoor and outdoor surface of the element [°C] - Rc, is the Rc-value of the element based on the construction physics model [(m2 *K)/W]
According to the previous formula, ΔT is built up out of the indoor and outdoor surface temperature. In this case the outdoor surface temperature is assumed to be influenced by the outdoor temperature (Tout) and the
amount of solar radiation (IR). Both factors are input for the model and measured in the experimental set-up. Solar radiation is measured in W/m2, while temperature is given in ˚C or ˚K. Therefore the input for solar radiation is converted to an increase of the surface temperature (TIR) according to Bougiatioti et al. (2009) and
Castenmiller (2004) based on the heat absorption coefficient (α). Conclusively, ΔT can be described as:
ΔT = (Tout + TIR)- Tin, in which: (Equation 5)
- Tin, is the indoor temperature of the box. It is assumed that the indoor surface temperature is nearly
the same as the indoor temperature, because of the small indoor air volume [˚C]
The incoming energy provided by the solar radiation causes an object (the box) to emit energy immediately by radiation. This amount of energy has to be subtracted from Q and is described by:
, in which: (Equation 6)
- E, is the amount of emitted energy [W] - σ, is the Stefan-Boltzmann constant [Wm−2˚K−4] - ε, is the emissivity coefficient [-]
- ΔT, is the difference between outdoor surface temperature and outdoor temperature [°C]
, in which: (Equation 7)
- C, is the heat capacity of the indoor air [J/(kg * ˚K)]
- Qtotal, is the total amount of energy through all the elements [W]
- ΔT, is the increase or decrease of the indoor temperature caused by the energy flux [°C]
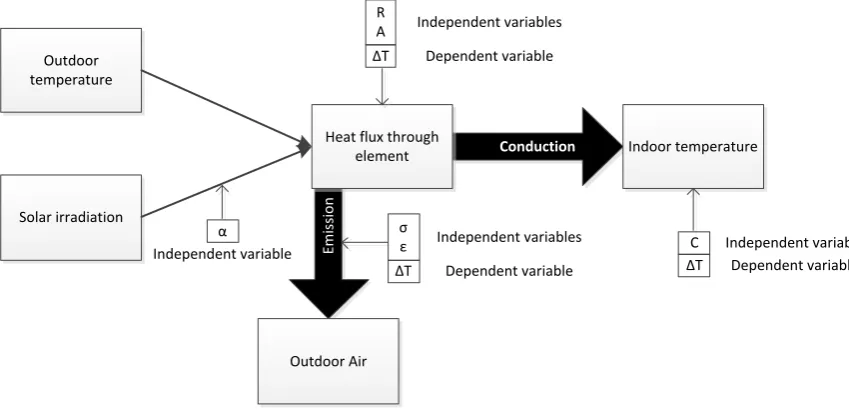
A simplified representation of the description above and the relation between the equations in the SD-model can be found in Figure 7.
Em
is
si
o
n
Solar irradiation Outdoor temperature
Conduction
Heat flux through
element Indoor temperature R
A
Outdoor Air ΔT
Independent variables Dependent variable
σ ε ΔT
Independent variables Dependent variable
C ΔT
Independent variable Dependent variable α
[image:13.595.72.497.193.398.2]Independent variable
Figure 7: Simplified representation of relations in the SD-model. Table 3: List of variables.
Symbol Unit Description Fixed values
λ W/m˚K Thermal conductivity
R m2˚K/W Thermal resistance
Rc m2˚K/W Total thermal resistance of a layer
Ris m2˚K/W Thermal resistance inside surface 0.1 ~ 0.15
Ros m2˚K/W Thermal resistance outside surface 0.04 ~ 0.06
U W/m2˚K Heat transfer coefficient
d m Thickness of a layer
Q W Energy flux
Qtotal W Total energy flux
A m2 Surface area
ΔT ˚C Temperature difference
Tout ˚C Outdoor temperature
Tin ˚C Indoor temperature
Tir ˚C Temperature increase caused by IR
C J/(kg * ˚K) Heat capacity
α - Heat absorption coefficient 0.25 ~ 0.95
ε - Emissivity coefficient
σ Wm−2˚K−4 Stefan-Boltzmann constant 5.67*10-8
[image:13.595.66.407.455.709.2]a trendline. To erase the non-fluency partly, the method of moving average is applied on the input data (with n=10). A trendline, based on a fifth or sixth grade polynomial function, is fitted into this moving average with help of Microsoft Excel. Microsoft Excel determines trendlines based on the method of least squares (Woldberg, 2005).
As a consequence of using trendlines both the input and the output are approximations of the real data. This is not a problem, as the model is used to get a general impression of the system and changes made in the system.
4
Data experiments and model
In the next section the results of the experiment and the simulations of the model will be presented.
4.1 Baseline experiment
An existing experimental set-up is used; therefore some data on weather circumstances (temperature, solar radiation, wind, wind direction) is readily available. These data already represents the effect of PCM's applied in a concrete floor and can be used preliminary to validate the SD-model. This existing data already shows the positive effects of PCM's in a concrete floor on the indoor temperature of the boxes.
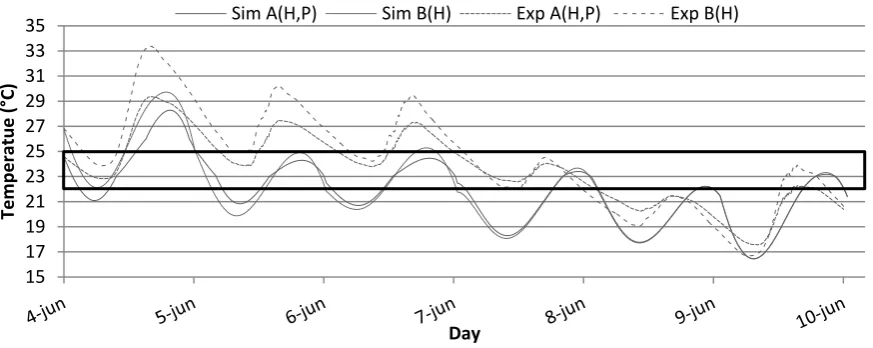
From the 4th of June 2011 till the 10th of June 2011, the baseline data experiment was performed. The weather data of this period (Figure 3) is used as input for the model for the simulation of this period. In Figure 8: Results baseline experiment and simulation box A & B of the 4th of June 2011 till the 10th of June
the indoor temperatures of Box AH,P and BH of the experimental set-up (Exp A(H,P) & Exp B(H)) and simulation
(Sim A(H,P) & Sim B(H)) are represented. Figure 9 shows the indoor temperatures of Box CL,P and DL of the
experimental set-up (Exp C(L,P) & Exp D(L)) and simulation (Sim C(L,P) & Sim D(L)) are represented. These indoor temperatures of the experimental set-up are the average of 8 thermocouples, placed on different positions inside the boxes. For the experimental set-up, boxes BH and DL show a higher range in both maximum
and minimum temperatures compared to AH,P and CL,P. These differences reach a maximum of 4°C ± 0.7˚C and
3.7°C ±0.7˚C (heavy and light insulated, respectively) on the first day for the maximum temperatures and 1.1 °C ± 0.7˚C (heavy insulation) on the second day for the minimum temperatures. On both days the PCM’s are fully charged while the temperatures constantly exceed 22.1˚C ±0.5˚C (transition range, indicated by
frame)(situation 3 paragraph 2.2).
For the simulated temperatures it can be seen that they are not exactly the same as the measured
Figure 8: Results baseline experiment and simulation box A & B of the 4th of June 2011 till the 10th of June 2011.
Figure 9: Results baseline experiment and simulation box C & D of the 4th of June 2011 till the 10th of June 2011.
4.2 Increased latent heat capacity
After the baseline experiment, the gypsum plasterboard was applied in the boxes. As a consequence the latent heat capacity increased with 551kJ from 563 kJ to 1114kJ.
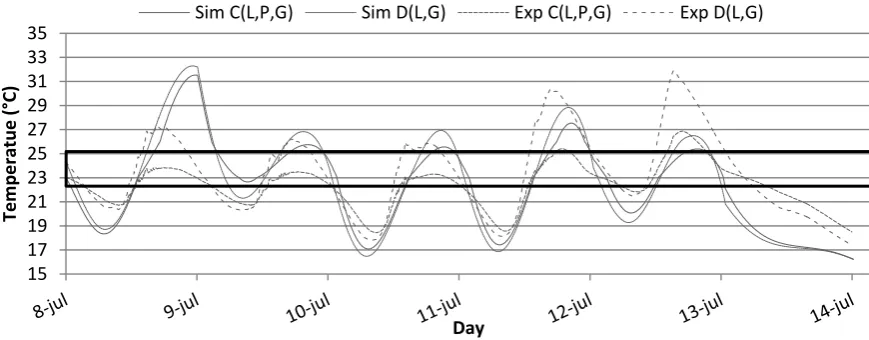
From the 8th of July 2011 till the 14th of July 2011, the experiment with the increased latent heat capacity was performed. The weather data of this period (Figure 4) is used as input for the model for the simulation of this period. In Figure 10: Results baseline experiment and simulation box A & B of the 8th of July 2011 till the 14th of July the indoor temperatures of Box AH,P,G and BH,G of the experimental (Exp A(H,P,G) & Exp B
(H,G) set-up and simulation (Sim A(H,P,G) & Sim B(H,G) are presented. Figure 11 shows the indoor
temperatures of Box CL,P,G and DL,G of the experimental set-up (Exp C(L,P,G) & Exp D(L,G) and simulation (Sim
C(L,P,G) & Sim D(L,G)).
For the experiment, boxes BH,G and DL,G again show a higher range in both maximum and minimum
temperatures compared to AH,P,G and CL,P,G. These differences reach a maximum of 4°C ± 0.7˚C and 5°C ± 0.7˚C
(heavy and light insulated, respectively) on the fourth day for the maximum temperatures and 1.1 °C ± 0.7˚C and 0.7°C ± 0.7˚C (heavy and light insulated, respectively) on the third day for the minimum temperatures.
15 17 19 21 23 25 27 29 31 33 35
Tem
peratue
(°
C)
Day
Sim A(H,P) Sim B(H) Exp A(H,P) Exp B(H)
15 17 19 21 23 25 27 29 31 33 35
Tem
peratue
(°
C)
Day
[image:15.595.80.515.295.463.2]On the fourth day of the simulation these differences reach a maximum of 1.7°C and 1.5°C (heavy and light insulated, respectively) for the maximum temperatures and 1.2 °C and 1.3°C (heavy and light insulated, respectively) for the minimum temperatures.
However, when comparing the differences to the baseline situation, hardly any difference can be seen in the reduction of peak temperatures. Furthermore, the temperatures stay near the transition range (indicated by the frame), but most of the days exceeds the 25.2˚C ± 0.5˚C and during the nights go under the 22.1˚C ± 0.5˚C, indicating situation 2: most or even all PCM’s are thermally charged during daytime (paragraph 2.2). This means the PCM’s can be used to their full capacity, but hardly any difference is seen compared to the baseline situation.
[image:16.595.81.515.304.478.2]The results of the experimental set-up were compared with the simulations of the SD-model. It shows that increasing the latent heat capacity indeed shows no really difference compared to the situation before applying the gypsum plasterboard. And for this comparison it is considered that the environmental circumstances differ a bit of course.
Figure 10: Results baseline experiment and simulation box A & B of the 8th of July 2011 till the 14th of July 2011.
Figure 11: Results baseline experiment and simulation box C & D of the 8th of July 2011 till the 14th of July 2011.
15 17 19 21 23 25 27 29 31 33 35
Tem
peratue
(°
C)
Day
Sim A(H,P,G) Sim B(H,G) Exp A(H,P,G) Exp B(H,G)
15 17 19 21 23 25 27 29 31 33 35
Tem
peratue
(°
C)
Day
[image:16.595.81.516.518.688.2]4.3 Increased heat absorption coefficient
To increase the heat absorption coefficient from 0.25 to 0.95 the exterior surface of the test boxes were painted black in the last experiment.
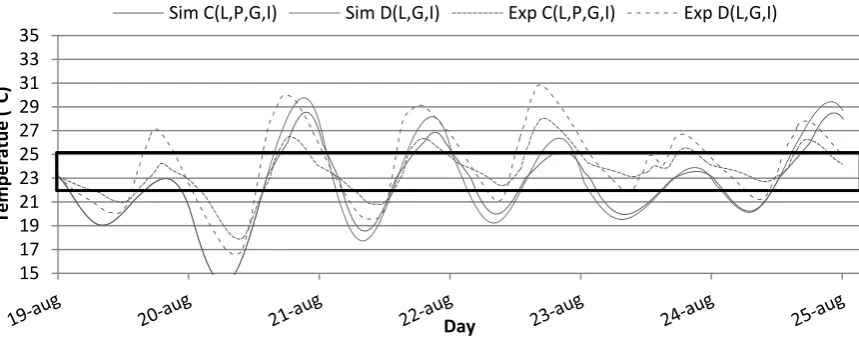
From the 19th of August 2011 till the 25th of August 2011, the experiment with both an increased latent heat capacity as well as an increased heat absorption coefficient was performed. The weather data of this period (Figure 5) is used as input for the model for the simulation of this period Boxes B and D (heavy and light insulated, respectively) again show a higher range in both maximum and minimum temperatures compared to A and C (heavy and light insulated, respectively). On the second day these differences for the experimental set-up reach a maximum of 3.4°C ± 0.7˚C and 3.9°C ± 0.7˚C (heavy and light insulated, respectively) for the maximum temperatures and 1.7 °C ± 0.7˚C and 1.0°C ± 0.7˚C (heavy and light insulated, respectively) for the minimum temperatures. Figure 12 shows the indoor temperatures of Box AH,P,G,I and BH,G,I of the experimental
set-up and simulation. Figure 13 shows the indoor temperatures of Box CL,P,G,I and DL,G,I of the experimental
set-up and simulation.
The differences for the simulation reach a maximum of 1.8°C and 1.2°C (heavy and light insulated,
[image:17.595.81.517.345.514.2]respectively) on the second day for the maximum temperatures and 0.8 °C and 0.8 (heavy and light insulated, respectively) on the third day for the minimum temperatures. Comparing this to the previous experiments the boxes with an increased heat absorption coefficient shows a smaller difference in peak temperatures then the situation without painting.
Figure 12: Results baseline experiment and simulation box A & B of the 19th of August 2011 till the 25th of August 2011.
Figure 13: Results baseline experiment and simulation box C & D of the 19th of August 2011 till the 25th of August 2011.
15 17 19 21 23 25 27 29 31 33 35
Tem
peratue
(°
C)
Day
Sim A(H,P,G,I) Sim B(H,G,I) Exp A(H,P,G,I) Exp B(H,G,I)
15 17 19 21 23 25 27 29 31 33 35
Tem
peratue
(°
C)
Day
[image:17.595.85.515.554.725.2]5
Discussion
The data given by the set-up as well as the model show the effects of applying PCM’s. According to
measurements in the experimental set-up, the boxes with PCM’s have a reduction of peak temperatures up to 5 °C ± 0.7˚C. This finding is in agreement with former research.
However, when the latent heat capacity is increased with almost 98%, both the SD-model as the experiment show no significant difference (0.5°C ± 0.7˚C) with the situation before the increase of the latent heat capacity. An explanation could be the overkill of latent heat capacity. While the boxes are just a scale model, the amount of surface containing PCM’s compared to the volume of the indoor air is much larger as would be in a real dwelling. This might have caused the PCM’s to only reach a partial phase changed state. In other words: the PCM’s are not used to their full capacity, as they don’t melt completely. On the other hand, the ratio of the indoor air compared to the mass of other materials within the thermal shell will be much larger in a real dwelling.
According to the results of the experimental set-up and model, increasing the heat absorption coefficient of the exterior from 0.25 to 0.95 causes a higher average indoor temperature but not a real difference in the
reduction of peak temperatures. However the higher indoor temperatures caused by the increased heat absorption coefficient means that during colder periods the indoor temperatures will be higher and thus results in less need for heating. This means that less energy is needed during colder periods.
These results are of course interesting, but when interpreting these results some remarks need to be
considered. At first the experiment is executed with a scale model of a real dwelling. As mentioned before the ratio outside surface compared to the volume of the inner air becomes smaller when the dwellings are on a bigger scale. Therefore the latent heat capacity needs to be considered carefully when applying it to a bigger scale. This can also mean the reached peak temperature reductions of 4˚C ± 0.7˚C are not on a real scale. However real size tests in other research have shown that this reduction of 4˚C can be met.
Furthermore, the full complexity of a real situation has not been simulated in both the SD-model as well as the scale-model. Interfering variables like interior heating, interior cooling, ventilation, sun blinds etcetera, have not been taken into account while these factors also have an effect on the indoor climate.
The word ‘climate’ is mentioned here, because a living needs to be comfortable. Comfort however, is not only represented by temperature. Other factors like moisture and air flows also influence the comfort of a building. While opening the boxes to apply the gypsum plasterboard, it was noticed the cavity of the boxes with PCM's in their concrete floor were very moist. Apparently condensation took place in the construction. As this research only focusses on the effects on the indoor climate, no further research has been done on this appearance.
The model also showed something else remarkable: although the manufacturer of the insulation foil used for the light insulated boxes claims an Rt-value of 5.6 (m2 K)/W, using this value in the model did not comply at all
with the real situation. The situation with the heavy insulation did comply much better. Of course the
experimental set-up is perfectly shaped; the materials might be lightly torn. This could have caused a decrease of the total Rc-value. Since the only difference between the heavy and light insulated boxes is the used material
and therefore the Rc-value as input, something should be wrong with the Rc-value. Therefore with steps of 0.5
the Rt-value has been lowered from 5.6(m2 K)/W to 0.1(m2 K)/W, resulting in an Rt-value of about 2 (m2 K)/W of
the insulation foil as a better complying value than the specified Rt-value of 5.6 (m2 K)/W by the manufacturer.
Especially during colder periods one can wonder if this will happen. An option therefore would be to use PCM´s with a lower transition range (which are available as well) or even a mixture of PCM’s with a different range.
6
Conclusions & Recommendations
The main objective of this research was to look for an efficient way to use PCM’s in construction. The research has shown an easy application of gypsum plasterboard integrated with PCM’s. This means existing buildings can relatively easy be applied with PCM’s as well, in order to make the built environment more sustainable on energy consumption. The baseline experiments and simulations have shown that PCM's can be a solution to reduce energy consumption in the built environment by reducing indoor peak temperatures. The experiment has shown that indoor peak temperatures can be reduced with up to 4°C ± 0.7˚C and 3.7°C ± 0.7˚C (heavy and light insulated, respectively) and 1.1 °C ± 0.7˚C on the minimum temperatures in the used test boxes. However, applying more PCM’s does not automatically result in a larger reduction of peak temperatures. Although the latent heat capacity was increased with almost 98%, peak temperatures, and maximum and minimum
temperatures did not show a significant difference compared to the baseline experiment. The third experiment conducted, increased the heat absorption coefficient from 0.25 to 0.95 and created a more realistic situation for the Dutch build environment. Compared to the second experiment, peak temperatures showed a smaller reduction, but average indoor temperatures were higher.
Besides the energy savings, also money can be saved (investment excluded to apply PCM’s). When a reduction of 5˚C ±1.4˚C on maximum temperatures can be met in real buildings, less demand for cooling systems is needed in a moderate climate. This will save money on installation of such a system as well as saving on the energy use of such a system. However, the total latent heat capacity has to be considered carefully when applying it on real scale. Furthermore a much more constant temperature is reached, which leads to a more comfortable indoor climate.
A SD-model was developed in order to predict the consequences of changes on the amount of latent heat capacity and heat absorption coefficient in the experimental set-up. The model was validated with existing data of the experimental set-up. With help of this model predictions can be made without wasting resources in real-time. This research has proven that relatively simple SD-model can be used in thermodynamics and building environment as a good alternative. It can be used to take a closer look at the impact of specific variables without using a real-life situation. In this way, the use of PCM’s can be examined in a more efficient way.
The results of the model and experiments show that increasing the heat absorption coefficient of the exterior combined with an increased latent heat capacity result in a higher average indoor temperature. However, when only the latent heat capacity is increased, the same reduction on peak temperatures can be met, compared to a situation with a lower heat absorption coefficient.
A higher absorption coefficient does comply better with a Dutch situation, compared to the white situation where hardly any white buildings can be found in the Netherlands. Moreover, during colder periods compared to the experimental ones, a higher indoor temperature is can be considered more desirable. A higher heat absorption coefficient gives therefore a better result during colder periods. In this research, only the combination of an increased heat absorption coefficient with an increased latent heat capacity was
investigated. It would be interesting to study the effects of an increased heat absorption coefficient without installing more PCM’s.
found in the experimental set-up for example was not expected, but could be relevant for the indoor climate. Further research should be done to find the relation between the moist and the application of PCM’s as effect on the indoor climate. More research is needed as well as on increasing the scale of the test boxes. Preferable a test location on real scale should be used, in other words a real building.
Besides the limitations of the model, it can predict the performance of PCM’s in buildings. Furthermore, this research shows that the performance of PCM’s varies in different circumstances; like the weather (climate), amount of PCM’s and the heat absorption coefficient. This means that PCM’s cannot just be applied in any amount and situation to function in an effective way. A tool (like the SD-model) is needed to predict how PCM’s function in different situation in order to realize an effective application of PCM’s in buildings.
Acknowledgements
The author would like to express his gratitude to BASF, Foamglas, Schüco and Wissink Schilders & Spuiters BV for providing materials applied in the experimental setup. SenterNovem is acknowledged for providing financial support of the research on low exergy techniques which improve the energy performance of buildings (EOS LT02003). Furthermore, prof.dr.ir. A.G. Dorée and ir. A.G. Entrop for their guidance and contributions during the research. And last but not least A.M. Berendsen, MSc, R.W. Berendsen, MSc and M. Prins, MSc for helping to improve the writing in English and general improvements
References
Athienitis, A.K., Liu, C., Hawes, D., Banu, D. & Feldman, D. (1997). Investigation of thermal performance of a passive solar test-room with wall latent heat storage. Building and Environment, 32, 405-410.
BASF (2009). Micronal PCM; intelligent temperature management for buildings.
Bougiatioti, F., Evangelinos, E., Poulakos, G. & Zacharopoulos, E. (2009). The summer thermal behaviour of ‘‘skin” materials for vertical surfaces in Athens, Greece as a decisive parameter for their selection. Solar Energy,
83, 582–598.
Castenmiller, C.J.J., TNO Building and Construction (2004). Surface temperature of wooden window frames under influence of solar radiation. HERON, 49, 339-348.
EC (European Council)(2002). Energy Performance Building Directive, Directive 2002/91/EC of the European Parliament and Council of 16 December 2002 on the Energy Performance of Buildings.
Entrop, A.G., Brouwers, H.J.H. & Reinders, A.H.M.E. (2011). Experimental research on the use of micro-encapsulated Phase Change Materials to store solar energy in concrete floors and to save energy in Dutch houses. Solar Energy, 85, 1007-1020.
Entrop, A.G., Brouwers, H.J.H., Reinders, A.H.M.E. & Müthing, F. (2010). Experimental research on the use of phase change materials to come to passive solar energy concepts.
Feldman, D., Shapiro, M., Banu, D. & Fucks, C.J. (1989). Fatty acids and their mixtures as phase change materials for thermal energy storage. Solar Energy Mater Solar Cells, 18, pp.201–216.
Forster, A.M., Carter, K., Banfill, P.F.G. & Kayan, B. (2011). Greenmaintenance for historic masonry buildings: an emerging concept. Building Research & Information, 39, 654–664.
Hunger, M., Entrop, A.G., Mandilaras, I., Brouwers, H.J.H. & Founti, M. (2009). The behavior of self- compacting concrete containing micro-encapsulated Phase Change Materials. Cement & Concrete Composites, 31, 731–743. Kissock, J.K., Hannig, J.M., Whitney, T.I. & Drake, M.L. (1998). Early Results from Testing Phase Change
Wallboard. First Workshop for IEA Annex 10 April 1998, Adana, Turkey.
Knauf (2006). Micronal® PCM SmartBoard™ 23/26; technical data, material, preparation, jointing, finishing.
KNMI (Royal Netherlands Meteorological Institute), 2012. Weather Conditions per Hour and per 24 hours for the Weather Station Twente 2001–2010. Retrieved January 4, 2012, from
http://www.knmi.nl/daggevens/selectie.cgi
Kuznik, F. & Virgone, J. (2009). Experimental assessment of a phase change material for wall building use.
Applied Energy, 86, 2038–2046.
Lai, C.M. & Chiang, C.M. (2006). How phase changematerials affect thermal performance: hollow bricks.
Building Research & Information, 34, 118–130.
McMullan, R. (2007). Environmental Science in Building (3rd ed.). Palgrave MacMillan.
Schossig, P,, Henning, H.M., Gschwander, S. & Haussmann, T. (2005). Micro-encapsulated phase-change materials integrated into construction materials. Solar Energy Mater Solar Cells, 89, 297–306.
SenterNovem (2006). Referentiewoningen nieuwbouw (in Dutch), (English: References for new houses), in order of the Ministry of Housing, Spatial Development and the Environment, 2KPWB0620.
Ventana Systems, Inc. (2007). VENSIM; Ventana Simulation Environment. User’s Guide Version 5.
Voelker, C., Kornadt, O. & Ostry, M. (2008). Temperature reduction due to the application of phase change materials. Energy and Buildings, 40 , 937–944.
Research Proposal
Index
1 Problem statement... 24
1.1 Introduction ... 24
1.2 Introduction to PCM’s ... 24
1.3 Types of PCM’s ... 25
1.4 Application in materials ... 25
1.5 The (lack) of using PCM’s in The Netherlands ... 26
2 Goal ... 26
3 Research questions ... 26
4 Materials and methods ... 27
4.1 Scale model ... 27
4.2 Micronal ... 28
4.3 Modelling ... 28
4.4 Variable ... 29
4.4.1 Heat capacity ... 29
4.4.2 Painting ... 29
4.4.3 Hypothesis ... 30
4.5 Execution ... 31
4.5.1. Theory ... 31
4.5.2 Modelling ... 32
4.5.3. Experiments ... 32
4.5.4. Analysis ... 33
4.5.5. Conclusions ... 33
5 Limitations and threats for the research ... 33
1
Problem statement
1.1 Introduction
The energy consumption of the built environment accounts for more than 40% per cent of the total energy consumption in Europe (EC, 2002). In modern Dutch dwellings, about 10% of the annual use of primary energy goes to cool the dwelling, whereas about 50% of the primary energy is used for heating. Therefore, lowering the energy use of the built environment would have a great impact on greenhouse gasses reduction and the improvement of the environment. Significant energy savings in the built environment in the Netherlands and therefore in the total Dutch energy consumption can be achieved by lowering the energy used for heating and cooling of dwellings.
Several solutions are already available to save energy on heating and cooling. “A possible solution may be the emplacement of so called phase change materials (PCM’s) that provide for an increase in heat capacity. These materials change their state of aggregation within a defined temperature range. Common PCM’s for the application in buildings show a phase transition from solid to liquid phase and vice versa. It follows then that surface and indoor air temperatures can be reduced by using PCM during hot periods.” (Voelker et al. 2008) Vice versa, indoor temperatures can be increased during colder periods. As a result, people inside a building equipped with PCM’s can experience more comfort than in conventional building. Additionally, and maybe even more important: energy can be saved because the temperature peaks are smaller so less cooling and heating is needed.
During the 1980s, the first research was conducted where phase change materials, especially paraffin, were integrated into building materials to solve the problems of thermal protection in summer (Hawes et al, 1989). But only little research has been done on the application of PCM’s in gypsum plasterboard. Such applications of PCM’s can be very useful during renovation of buildings. Because new buildings are just a small part of the total build environment, more strict regulations (e.g. building code) won’t affect the main part of the build
environment in the reduction of energy consumption. Therefore changes lay within renovating existing buildings, where the application of easy-use materials with PCM’s is a great advantage.
But there could be a disadvantage as well, especially in a moderate climate like in the Netherlands. Because of this moderate climate you can wonder if the PCM’s integrated in a construction will ever be completely charged. To charge (solar) energy is needed which enters the dwelling. Though not much is known about the heat absorption capacity (absorption coefficient) of the interior of buildings and the speed of release of captured solar heat for interior heating during cold evenings or nights (Entrop et al, 2010). So there are uncertainties on how PCM’s affect the indoor temperatures of a building and the effectiveness (fully charging) of these PCM’s
1.2 Introduction to PCM’s
The power of PCM’s is based on simple feature of physics. Every material can exist in three forms, namely: solid, liquid and gas. The phase in which a material appears is dependent on its temperature. The most general and common example is that of water. Everybody knows, below 0°C (273.15°K) water will be ice (solid). Between 0°C and 100°C (373.15°K) water will be liquid and above 100°C it will be steam (gas). However the temperatures of change differ per material, every material has got the same sequence of phases and transition temperature.
transition. This means materials have 2 temperature values at which they can absorb (and release, which is negative absorption) much more energy than at other values of temperature.
As mentioned before this counts only for pure materials. When speaking of non-pure materials, there is not a transition temperature but a transition trajectory. There will be domain of temperatures in which a material changes instead of a steady temperature. For example tap water. Tap water doesn’t consist of just H2O (1 type
of molecule) but also at a lot of additions, like for example Calcium. These additions make the water a non-pure material and therefore tap water has phase change trajectories. But a better example of non-pure material with a changing trajectory is oil, its trajectory is used to distillate the several products (e.g. kerosene, gasoline) out of it.
So the power of PCM’s is it characteristic of phase transition and the adding (or removing) of energy during this transition.
A remark should be made at this point that, given the description above, all materials are a PCM. Therefore suitable materials have to be determined for the construction industry. The idea of this research was to create a comfortable indoor environment. When talking about water and getting the maximum effect out of its heat capacity, 0°C or 100°C should be a comfortable indoor temperature. Of course this is far from comfortable. From now one when talking about PCM’s, PCM’s mean only PCM’s which are really used because of their heat capacity for indoor comfort.
1.3 Types of PCM’s
Several types of PCM’s are available (Sharma et al. 2007). Sharma et al. (2007) Distinguishes three types of PCM’s which are available in any required temperature range; organic, inorganic and eutectic. However, a PCM that has a melting point which is around 20-22°C is nearby a comfortable indoor temperature (Van der Linden et al. 2005) and therefore more suitable for buildings
In the Netherlands there are just a few examples of PCM’s used in buildings;
BG Office at Nieuwegein (PCM applied in concrete floor) WILO Westzaan (PCM applied in concrete roof)
Energy neutral dwelling 2.0 Amsterdam (PCM applied in plaster at walls) RACM Kadegebouw Amersfoort (PCM applied on top of ceiling in plastic bags)
Although there are just a few examples in the Netherlands available, it can be seen there are actually to two types of applications of PCM’s in buildings. First PCM’s can be added separately (RACM Kadegebouw Amersfoort) or it can be applied in construction materials such as concrete and plaster. This application in construction materials is a, so called passive system. No mechanical or electric system is used for charging or discharging the PCM’s
The use of PCM’s in construction materials in a passive way is relatively new, while using an active system was already used much earlier in history as well as a passive system on its own (not integrated in a construction).
1.4 Application in materials
The great advantage of passive use is the ease of mixing the PCM’s with for instance concrete. So no extra systems or layers need to be added in a construction, which avoids extra labour. Also no extra maintenance of a system is needed.
phase change materials were used by Feldman et al (1989) and Feldman et al (1991). Various building materials were used to evaluate their absorption properties and the resulting composites. The gypsum can absorb up to 25 weight % of PCM. The results show that gypsum–PCM composite can be used to reduce overheating. Gypsum wallboard has also been studied, numerically and experimentally in a full scale test room (Athienitis et al, 1997). Their numerical results are in good agreement with experimental data. Moreover, the PCM used shows a decrease in overheating and a decrease of energy consumption” (Kuznik et al 2009). Schossig et al (2005) integrated microencapsulated PCM into gypsum wallboard. And full size tests show that such composite lowers the temperature by up to 4°C.
These full scale test done by Schossig et al (2005) took place at Freiburg, Germany. Because of this location it can give an indication for using PCM’s in The Netherlands, however it can’t be translated fully to a Dutch situation because of the difference in climate. Is the lack of experience in a Dutch climate (or comparable) the reason PCM’s are hardly used in construction in the Netherlands?
1.5 The (lack) of using PCM’s in The Netherlands
It is true little research has been done on using PCM’s in The Netherlands (or comparable situation). This could be the reason for just a few applications of PCM’s in construction in The Netherlands. Perhaps clients and/or contractors need more persuasion before applying PCM’s in their constructions.
The need for PCM’s (or methods to save energy) applied in the Dutch build environment can easily be given; at first there are new regulations which provide in energy savings.
But also indoor climate (comfort) and health can be a reason for using PCM’s. Already is proven PCM’s can take care for a reduction in peak temperatures. This means a more constant temperature during the day. A more constant indoor temperature means more comfort for the people using a building. But also health issues can plead for lower peak temperatures.
In the following sections the goal, research questions and the way to conduct the research are explained. Furthermore this document contains a schematic overview and a planning of the research.
To get more insight in this uncertainty on PCM’s, this research has been initiated.
2
Goal
The goal of this research is to get investigate in what way PCM’s can be used more effective (charged better) when applied in construction elements.
3
Research questions
In order to achieve the earlier mentioned goal, the following research question has been stated:
- How can the latent heat capacity of PCM’s used in constructions be used more effective?
To answer this question, sub-questions are needed to split-up the research. As mentioned in the next chapter, an experimental set-up will be used in this research. Therefore at first it is essential to get an idea of how the PCM’s behave in combination with this set-up:
o How do the test boxes behave?
Theoretically (model)
Then the variables (e.g. heat resistance, heat absorption coefficient, heat capacity) which have theoretical an effect on charging the PCM’s (and therefore the indoor temperature) need to determined:
o Which variables have the most influence on the indoor temperature of the test boxes according to the model?
At last, the determined variable needs to be checked in the experimental set-up.
o If one of those variables will be influenced, does it have the expected consequences on the indoor temperature?
Of course the variable which shall be adopted should be a relevant and sensible. Later on in this document shall be discussed and determined which variable is relevant and sensible. And therefore will be influenced.
4
Materials and methods
In order to answer this question an experimental set-up is needed. This set-up should contain a dwelling, or scale model of it, which contains PCM’s both in some construction parts. An equivalent set-up without PCM’s is needed as reference. Because the effect of PCM’s on the indoor temperature is variable, indoor temperatures should be measured. This could be done with help of thermometers (or thermocouples). Due to time and money limitations, a scale-model would be most efficient to perform a relative short-timed and cheap experiment.
4.1 Scale model
Entrop et al (2010 ,2011) already did some research on PCM’s in concrete floors with help of test boxes. It appears that these test boxes are also suitable and available for this research. The dimensions of these boxes are already carefully determined: “The references for the dimensions of the scaled boxes are the living room of the standardized row house of SenterNovem (2006) and the test boxes used by Kissock et al. (1998).
These test-boxes (fore of them) used by Entrop et al. (2010, 2011) are placed on top of a 40 foot sea container. Furthermore the, for this research necessary, thermocouples are installed with the necessary monitoring equipment as described below:
An amount of 14 thermocouples (Thermocouples type T, ± 0,5 °C) per box are installed; located in the middle of both sides of the boxes, in the middle of the roof and in the middle of the backside. Also temperatures behind the glazing are measured.
Furthermore the solar irradiance is measured using six silicon irradiance sensors Mencke and Tegtmeyer, type Si-01 TC-T) placed horizontally in and on top of two test boxes.
The data of the sensors mentioned above is acquired using eight USB TC-08 of Pico for the thermocouples and two USB 6215 of National Instruments for the solar irradiance sensors. Two personal computers stored the data by making use of a Labview program that has been developed for this purpose. (Entrop et al, 2011)
On the north side of the test boxes a weather station is situated (Vantage Pro 2 of Davis Instruments), which measures the weather conditions. It is equipped with a digital thermometer, humidity meter, cup anemometer for measurement wind speed and a wind vane for measuring the wind direction and a solar sensor.
4.2 Micronal
Several types of PCM’s are available (Sharma et al. 2007). A PCM that has a melting point nearby a comfortable indoor temperature, which is around 20-22°C (Van der Linden et al. 2005) is needed to give a representative scale model of a real situation. As mentioned above the used PCM in the available test boxes is Micronal which is commercially available and has a melting point nearby this 22°C (BASF, 2009). Additionally, Micronal is available in powder form so it can be easily applied in concrete. Furthermore, Knauf developed gypsum plasterboard with Micronal, the so called Masterboard (Knauf, 2006). This makes it easier to add construction parts with PCM’s during the research.
4.3 Modelling
In order to perform a sensible and reasonable experiment, first the relevant ins and outs of the test boxes should be familiar. The description above of the set-up of Entrop et al. (2011) won’t be sufficient. That is the reason at first a constructional physics model is made. This model contains of some blueprints of the test boxes as well as an overview on the used materials with its characteristics, on especially thermo physics, like:
- Dimensions
- Rc value [(m2 *K)/W] (heat resistance)
- U value [W/(m2 * K)] (heat transfer coefficient) - λ value [W/(m * K)] (thermal conductivity) - C value [ J/(kg * K)] (heat capacity)
Secondly a systems dynamics model is made based on the characteristics of the test boxes represented in the constructional physics model. In this systems model variables and factors which have an influence on the indoor temperatures are linked. For this model a software tool is used called: VENSIM.
“VENSIM is a visual modelling tool that allows you to conceptualize, document, simulate, analyse, and optimize models of dynamic systems. VENSIM provides a simple and flexible way of building simulation models from causal loop or stock and flow diagrams.
VENSIM makes it possible to link the variables visual as well as physical by adding physical formulas. If done sufficient, VENSIM can simulate the consequences of changes in the variables. “ (Ventana Systems, Inc., 2007)
In order to check if the model in VENSIM is build sufficient, the model will be verified with the data already existing of some runs of the experimental set-up.
This data of the experimental set-up will be up-loaded into SPSS. SPSS is a statistical software program with the ability to store, edit and analyse data. SPSS is especially suitable, because it can handle large amounts of data, which will be the case in this research.
The statistical analysis with SPSS is needed to determine which variables have significant influence on the indoor temperature of the test-boxes, in order to build a sufficient system dynamics model with VENSIM. Also the data is needed to test if the model build in VENSIM is valid.
When the model in VENSIM is build, tested and find correct, the next step can be made. Within the model of VENSIM the variables can be adjusted and therefore some variables can be found which can be adjusted in the experimental set-up as well. Therefore a prediction can be made of the adjustment of some variables in the set-up. After adjusting these variables in the set-up, data can be collected. This data shall be compared with the data generated by the model. As well the data of the test boxes will be compared with each other.
4.4 Variable
Previously is spoken about a variable which will be adjusted in the experimental set-up (as well as system dynamics model). This variable should be a relevant and sensible one in order to perform a desirable research. In this section the chosen variable will be discussed as well the reason for its selection. In the chapter Social and scientific relevance, the relevance of this variable within the context of the research shall be discussed.
4.4.1 Heat capacity
At first, currently not so much research has been done on PCM’s and their effect as well as their applications in different construction materials. Moreover Entrop (2010 & 2011) already questions the latent heat capacity of the existing test boxes. Therefore the choice is made to increase the latent heat capacity of the boxes by applying gypsum plasterboard
The choice of gypsum plasterboard has been made to use PCM’s in another material (gypsum plasterboard) as already applied in the boxes (concrete floor). There is already a product available with PCM’s, integrated with the same type of PCM’s as used in the concrete floors of the existing test boxes. This way the latent heat capacity of the test boxes, but also real life situations with dwellings, can be extended pretty easy. With this experiment now can be tried if it is easy, besides the assembly, to save energy by applying PCM’s.
Additionally, the increase of the latent heat capacity gives also the opportunity to test if PCM’s applied in other materials (gypsum plasterboard) and construction elements (e.g. walls, roofs) are good options for the
reduction of energy use in dwellings.
This is interesting, because when the application in gypsum plasterboard has got a positive effect on the indoor climate and energy savings, existing buildings can be made more energy efficient in a pretty easy during renovations for example.
4.4.2 Painting
This way two extremes are created, on which more/better conclusions can be drawn on the effectiveness of PCM’s in different situations.
Moreover, the Dutch climate isn’t that warm the PCM’s will be used efficacious, while not charged or not sufficient charged. Therefore more energy input form the environment is needed in case of this passive set-up. Increasing the heat absorption coefficient of the exterior of the boxes could be useful for creating a higher energy input.
So generally speaking, the following things are intended to be achieved with the adjustment of the mentioned variables:
- Placement of Masterboard increase of skimming peak temperatures - Painting increasing scope of exteriors
4.4.3 Hypothesis
Of course these changes are expected to have some influence on the experiments. Just by rational thinking the following hypothesis came up:
- Already is proven, PCM’s can reduce peak temperatures and cause a more constant indoor temperature. Therefore the expectance is adding more PCM’s, in the form Masterboard, will increase this reduction and cause an even more constant indoor temperature.
4.5 Execution
In the previous paragraphs became clear an experimental set-up is available for this research. But there is more needed. In this paragraph will be explained what is going to be done and how to fulfil the research in order to give an answer to the research questions and accomplish the goal. This all is represented in Figure 1
At first an inventory of relevant things available (points 1-6, Figure 1):
- The experimental set-up, with its
o Characteristics (thermo physics)(point 6, Figure 1)
o Existing data, from previous experiments done with it (point 5, Figure 1) - Existing theory on
o PCM’s (in constructions)(point 1, Figure 1)
o Test boxes (point 2, Figure 1)
o Thermo physics (point 3, Figure 1)
1. Theory on PCM’s (in constructions
6. Characteristics Test boxes 2. Theory on test
boxes
3. Theory on thermo physics
9. Adjusted variables in test
boxes 7. Construction
physics model
8. System dynamics model
12. Conclusions 11. Analysis &
comparison
10. New data produced 5. Existing data
produced by test boxes
Available
knowledge Modelling New data New Knowledge
[image:31.595.101.525.222.585.2]4. Literature review
Figure 1: schematic overview research
4.5.1. Theory
With this list of things available the first steps can be made. Based on the available theory (literature) on PCM’s a literature review (point 4, Figure 1) will be made, with the general ins and outs on PCM’s and PCM’s in constructions. Because the research will take place in the Netherlands, as well some knowledge on the use of PCM’s in the Netherlands will be included. Several sources on the topic already have been consulted or could be useful for the research:
o General/background information on PCM’s in constructions
Entrop et al (2011)
Hunger et al (2009)
Khudair et al (2003)
Voelker et al (2008)
o Information on the use of test boxes
Athienitis et al (1997)
Collier et al (1979)
Entrop et al (2010)
Entrop et al (2011)
Ismail et al (1997)
Kissock et al (1998)
Kuznik et al (2009)
o Technical information on used materials
BASF (2009)
Knauf (2006)
4.5.2 Modelling
Together with some theory on (using) test boxes and thermo physics and the characteristics of the existing test boxes, a construction physics model of the test boxes will be made(point 7, Figure 1). As already mentioned in paragraph 4.3 Modelling, this model contains of some blueprints of the test boxes as well as an overview on the used materials with its characteristics, on especially thermo physics, like:
- Dimensions
- Rc value [(m2 *K)/W] (heat resistance)
- U value [W/(m2 * K)] (heat transfer coefficient) - λ value [W/(m * K)] (thermal conductivity) - C value [ J/(kg * K)] (heat capacity)
These characteristics, together with their equations will be put in to EXCEL, in order to make it easier to adjust some values.
Secondly a Systems Dynamics model will be made (point 8, Figure 1) with the software tool VENSIM, based on thermo physics and the characteristics of the test boxes. In paragraph 4.3 Modelling is already explained how this tool works. The values out of the EXCEL file, can be uploaded into VENSIM, which makes it possible to connect this two software programs. By changing a characteristic in EXCEL, VENSIM automatically can calculate the effects of a change.
The model created, will be verified with existing data already available. When necessary the some variables in the model can be adjusted a little in order to make it more correct in predicting the behaviour of the test boxes.
4.5.3. Experiments
When the models are ready, the experiments can be carried out. Therefore a variable has been changed (point 9,Figure 1) as discussed in paragraph 4.4 Variable. At first the latent heat capacity of the test boxes will be increased by the placement of gypsum plasterboard integrated with Micronal. This change will also be put through in to the Systems Dynamics Model. Both the experimental set-up as well as the model will generate data (point 10, Figure 1). The model will produce data as a prediction based on the theory, while the set-up produces data of the real situation.
4.5.4. Analysis
After finishing an experiment, the data of the real situation and the predicted data will be analysed and compared (point 11, Figure 1). In order to give an answer to the research questions, the analysis and comparison will be done on three main points; average indoor temperature, constancy of the indoor temperature and the extremes of the indoor temperature. With help of a statistical software tool, like SPSS, can be determined if changing a variable has got a significant effect on the earlier mentioned three main points.
Generally, the analysis will schematically look like Figure 2. First, based on the theory a Systems Dynamics model is created and the characteristics of the physical model are made clear. Both will produce some data, which can be compared. Based on this data the model can be validated and when necessary adjusted.
Next, an intervention takes places, in this case changing a variable. Again the physical and Systems Dynamics model will produce data (Data 1), which can be compared on the effect of PCM’s and changing the variable with help of the previous data (Data). The Systems Dynamics model can be validated again and adjusted when necessary again.
Theory
Physical model
SD model
Data
Intervention
Physical model1
SD model1
[image:33.595.87.347.306.505.2]Data1
Figure 2
4.5.5. Conclusions
Based on the results of all the research steps described above, some conclusions will be drawn. In order to place these conclusions in a right context, the conclusions will be discussed as well (point 12, Figure 1).
5
Limitations and threats for the research
Of course every research has it is limitations and threats. To minimize the risk of failure of the research, in advantage limitations and threats which can occur have to be considered.
In the following part the limitations and threats which have can possibly occur are listed, as well as some measures to overcome these limitations and threats:
- The experimental set-up