Study on Influence of Cognitive Load for Software
Developer’s Performance using BPNN Algorithm
K.Banu
Research ScholarMother Teresa Women’s University Kodaikanal, Tamilnadu
N.Rama
, PhDResearch Supervisor Presidency College
Chennai -5
ABSTRACT
The development process involved developers contribution based his/her cognitive thinking in the real time process. The developer’s performance is dynamic as per their cognitive load. The cognitive load is un-deterministic as well hidden and integrated in the developer’s process. This paper attempt to identify software developer cognitive measure which influences the development process using neural network back propagation model .It describes the conceptual view on conventional construction of neural network for cognitive measure observation of software development processes. A neural network model designed to present the structure of developer’s performance such as Regularity, Task Completion, Accuracy, Team Involvement and Reporting are used to generate the Performance and Cognitive Load of the output layer. To obtain the Performance and the Cognitive Load from the given input, the Cognitive work load such as physical ability, mental ability, temporal ability, effort, frustration and performance are assigned to a hidden layer. The observation and the results are described and discussed as part of the paper.
Keywords
Cognitive load, Performance, Neural network, Back Propagation, Influence factor
1. INTRODUCTION
The software development process is integrated and improved with its architecture, functional analysis and the development process resources. The cognitive models are used for the computations to empower the process and its applications[1].The development process are highly involved the contribution of developers based on their thinking and acting intelligence[2]. The developer performance reflected the development of software and its quality. The developer’s intellectual capacity influenced the cognitive measures and its loads [3,4].The cognitive process of the developers are created major impact on the quality of the software therefore this paper aimed to design a model to determine the influencing cognitive factors to the software developers performance. Using statistical measures, how much the cognitive load influences the performance of the software developer’s is not predictable in the developer’s process [.5]. The cognitive models are determined simulating the neural computations process [6]. They related to cogitation and human performance related learning and its impact are evaluated to improve the human behavior [ 7,8]. The model construction for cognitive process introduced by Luce for psychology [9] and based on the evaluations of Massaro [10].The model was used for multiple functionality of human by Meyer in 1997[11]. In continuing the process Rigier[12] and Ritter [13] attempted to design mathematical models for
computational process. The theoretical aspects and its computational are addressed by R.sun [14, 15, 16]. It leads the basic computational and biological properties of individual neurons and networks of neurons, which give rise to basic processing mechanisms like spreading activation, inhibition, and multiple constraint satisfaction. It examine a range of cognitive and emotional phenomena within this framework, including attention, memory, language, higher-level cognition, motivation, emotion, and personality which creates an impact on their performance. Therefore, this paper adopts the neural network model to evaluate the performance of the software developers and overcome the inadequacy of the statistical basic measures.
2. NEURAL NETWORK FOR
COMPUTING DEVELOPER
COGNITION
The neural network based learning [17, 18] is a process adopted the layer based approach. This model comes under the prediction system. It is used to determine the developers performance based on their cognitive load. It is used to forecast some future values of the input data. It provides the option for the identification of developer’s skill in different multidisciplinary domains according to their cognitive load and performance. With the help of this back propagation neural network model the developer’s performance as well as the quality of the product can be improved.
2.1 Back propagation algorithm
It is systematic method of training multi-layer artificial neural networks [19]. A Back propagation network consists of three layers of units, an input layer, at least one hidden layer, and an output layer. Units are connected in a feed-forward fashion with input units fully connected to hidden layer and hidden units fully connected to units in the output layer. When a back propagation is cycled an input pattern is forwarded to the output units through the intervening input-to-hidden and hidden-to-output weights. The application of the generalized delta rule thus involves two phases: During the first phase the input is presented and propagated forward through the network to compute the output values for each output unit. This output is compared with its desired value do, resulting in an error signal for each output unit. The second phase involves a backward pass through the network during which the error signal is passed to each unit in the network and appropriate weight changes are calculated.
Step 1:
Normalize the input and output with respect to their maximum values. For each training pair, assume that in normalized form there are
ℓ inputs given by { I } I and
ℓ x 1.
n outputs given by{ O }O
n x 1
Step 2:
Assume that the number of neurons in the hidden layers lie between 1 < m < 10.
Step 3:
Let [V] represents the weights of synapses connecting input neuron and hidden neuron. Let [W] represents the weights of synapses connecting hidden neuron and output neuron. Initialize the weights to small random values usually from -1 to +1;
[ V ]0 = [random weights ] [ W ]0 = [ random weights]
∆[ V ]0 =
[∆ W ]0 = [ 0 ]
For general problems λ can be assumed as 1 and threshold value as 0.
Step 4:
For training we need to present one set of inputs and outputs. Present the pattern as inputs to the input layer { I }I then by using linear activation function, the output of the input layer may be evaluated as.
ℓ x 1. ℓ x 1.
Step 5: Compute the inputs to the hidden layers by multiplying corresponding weights of synapses as
m x 1.
m x ℓ. ℓ x 1.
Step 6: Let the hidden layer units, evaluate the output using the sigmoidal function as
m x 1
Step 7: Compute the inputs to the output layers by multiplying corresponding weights of synapses as
{ I }o = [ W ]T { O }H n x 1 n x m m x 1
Step 8: Let the output layer units, evaluate the output using sigmoidal function as
Note: This output is the network output
Step 9: Calculate the error using the difference between the network output and the desired output as for the jth training set as
Step 10: Find a term {d } as
n x 1 Step 11: Find [ Y ] matrix as
[ Y ] = { O }H { d }
m x n m x 1 1 x n
Step 12: Find
[∆W] t + 1 = α [∆W] t + η [Y] m x n m x n m x n
Step 13: Find
{ e } = [ W ] { d } m x 1 m x n n x 1
(OHi) ( 1- O Hi)
{ d * } = ei m x 1 m x 1
Find [ X ] matrix as
[ X ] = { O }I { d* } = { I }I { d *}
1 x m ℓ x 1 1 x m ℓ x 1 1 x m
Step 14: Find
[ ∆ V ]t + 1 = α [ ∆ V ] t + η [ X ]
1 x m 1 x m 1 x m
Step 15: Find
Step 16: Find error rate as
Error rate =
Step 17: Repeat steps 4 to 16 until the convergence in the error rate is less than the tolerance value.
The Back propagation algorithm is converted for determining the influence factors of the software developers
2.2 Model for back propagation algorithm
the network parameters that result improved performance. As per the network structure developers industrial observations and their cognitive work load are used to generate the Performance and Cognitive Load of the output layer. Since
[image:3.595.91.467.140.322.2]the developer’s skills are multidimensional it improves the performance of the developer’s as well as the quality of the product.
Fig 1: Neural Network model for Developers Performance determination
3. IMPLEMENTATION AND RESULT
ANALYSIS
There are five input attribute weights are presented in line to the six hidden neurons. The weight values from 1st row to 5th row represents regularity, task completion , accuracy , team involvement and reporting of the input layer which interacted with Mental Demand, Physical Demand, Temporal
Demand, Performance, Effort and Frustration weight values . The value Vo denotes the weight value of the input layer to the hidden layer in Table1. The hidden layer to the output layer values are states as Wo. There are two output columns which represents the cognitive load and the performance. The six internal attributes produce the weighted value of output Wo presented on the Table2.
Table1: Initial Vo weight values
Cognitive load /External Factors
Mental Demand
Physical demand
Temporal Demand
Performance Effort Frustration
Regularity 1.629447 0.195081 0.315226 0.283773 1.311481 1.51548
Task Completion 1.811584 0.556996 1.941186 0.843523 0.071423 1.486265
Accuracy 0.253974 1.093763 1.914334 1.831471 1.698259 0.784454
Team Involvement 1.826752 1.915014 0.970751 1.584415 1.867986 1.310956
Reporting 1.264718 1.929777 1.600561 1.918985 1.35747 0.342373
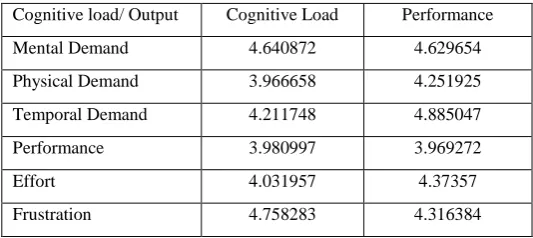
Table 2: Initial computed Wo values
Cognitive load/ Output Cognitive Load Performance
Mental Demand 4.640872 4.629654
Physical Demand 3.966658 4.251925
Temporal Demand 4.211748 4.885047
Performance 3.980997 3.969272
Effort 4.031957 4.37357
[image:3.595.164.431.608.727.2]As pre the observation of table 2, first column maximum value 4.75 denotes frustration influenced on the Cognitive Load. At the same time the second column maximum value Temporal Demand 4.88 influenced the Performance. But the values of the influences are changed during the iteration and the optimized values are obtained. The maximum values of internal cognitive loads factors are consider as an influencing factor for the external factors. The obtained values and its influencing impacts are discussed further.
4
. DISCUSSION ON COMPUTED
COGNITIVE FACTOR VALUES
Employee Cognitive (Internal) load is depending on external factors weights values. As per the observation on above presented obtained NN percentage weights the following are derived
Regulatory influenced by frustration .The influencing percentage on frustration by regularity is 27.36%
Temporal demand weights are forced based on task completion and accuracy. The Temporal demand forced 28.79 % on Task Completion and 28.39 % on accuracy
Tem involvement and reporting depends on physical demand. The team involvement dependency is 33.65 % and reporting is 33.91 according to physical demand
Regularity minimum value of 3.43 % applied for physical demand
Task completion minimum percentage 1.13 least influenced for effort cognitive load
The accuracy minimum percentage 3.75 least affected on mental demand
Team involvement minimal value 14.4 made the minimum force on temporal demand ,
[image:4.595.49.549.340.464.2] Frustration percentage value 6.29 is affected at the minimal according to the report
Table 3: External variables and Cognitive weight values (Input-to-Hidden)
Cognitive load /External Factors Mental Demand
Physical demand
Temporal Demand
Performance Effort Frustration
Regularity
24.01 3.43 4.68 4.39 20.80 27.86
Task Completion
26.69 9.79 28.79 13.05 1.13 27.32
Accuracy
3.74 19.22 28.39 28.34 26.93 14.42
Team Involvement
26.92 33.65 14.40 24.52 29.62 24.10
Reporting
18.64 33.91 23.74 29.70 21.52 6.29
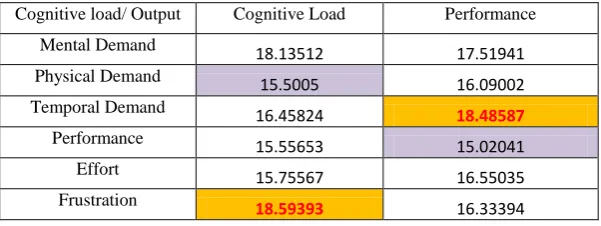
Table 4: Cognitive weight values and output variables (Hidden-to-Output)
Cognitive load/ Output Cognitive Load Performance
Mental Demand
18.13512 17.51941
Physical Demand 15.5005 16.09002
Temporal Demand 16.45824 18.48587
Performance
15.55653 15.02041
Effort
15.75567 16.55035
Frustration
18.59393 16.33394
The cognitive load and performance are based on the developer’s internal factors. The maximum value of cognitive load 18.59 % is observed for the frustration and the performance influence 18.48 according to the temporal demand weight values. The cognitive load is not affected much because of the physical demand minimum value 15.50 %. The overall performance is also not majorly disturbed based on the cognitive performance minimum value of 15.02 %.
5.
CONCLUSION
A neural network model with 5:6:2 designed to present the structure of developer’s performance such as Regularity, Task
[image:4.595.148.449.493.606.2]6. REFERENCES
[1] M. Dawson, (2002). Computer modelling of cognition: Levels of analysis. In:Nadel, L. (ed.), Encyclopedia of Cognitive Science. pp. 635-638. Macmillan,London, UK.
[2] Brain Drain: Evaluating the Impact of Increased Cognitive Load During Self-Paced Running Performance, J McCarron, TL Hodgson, MF Smith, Published in British Journal of sports Medicine, 2013.
[3] Analysis of Developers Cognitive Complexity Association for software development K.Banu , Research Scholar, Mother Teresa Women’s University , Kodaikanal, Tamilnadu & Dr.N.Rama, Research Supervisor, Presidency College, Chennai -5
[4] Comparative Study on Multidimensional Developers Performance with Cognitive Load K.Banu , Research Scholar, Mother Teresa Women’s University , Kodaikanal, Tamilnadu & Dr.N.Rama, Research Supervisor, Presidency College, Chennai -5
[5] Software Developers Performance relationship with Cognitive Load Using Statistical Measures K.Banu , Research Scholar, Mother Teresa Women’s University , Kodaikanal, Tamilnadu & Dr.N.Rama, Research Supervisor, Presidency College, Chennai -5
[6] P. Dayan, (2003). Levels of analysis in neural modeling. In: L. Nadel (ed.),Encyclopedia of Cognitive Science. Macmillan, London.
[7] S. Grossberg, (1982). Studies of Mind and Brain: Neural Principles of Learning, Perception, Development, Cognition, and Motor Control. Norwell, MA: Kluwer Academic Publishers.
[8] D. Hintzman, (1990). Human learning and memory: Connections and dissociations. In: Annual Review of Psychology, pp.109-139. Annual Reviews Inc, Palo Alto, CA.
[9] R.D.Luce ,(1995) .Four tensions concerning mathematical modeling in psychology. Annual Review of Psychology, 46, 1-26. Annual Reviews Inc, PaloAlto, CA.
[10] D. Massaro, (1988). Some criticisms of connectionist models of human performance. Journal of Memory and Language, 27, 213-234.
[11] D. Meyer and D. Kieras, (1997). A computational theory of executive cognitive processes and human multiple-task performance: Part 1, basic mechanisms.Psychological Review. 104 (1), 3-65.
[12] T. Regier, (2003). Constraining computational models of cognition. In: L.Nadel (ed.), Encyclopedia of Cognitive Science. Macmillan, London. pp.611-15.
[13] F. E. Ritter, Shadbolt, N., Elliman, D., Young, R., Gobet, F., and Baxter,G., (2003). Techniques for Modeling Human Performance in Synthetic Environments: A Supplementary Review. Human Systems Information Analysis Center, Wright-Patterson Air Force Base, Dayton, OH.
[14] R. Sun, (2005). Theoretical status of computational cognitive modeling. Technical report, Cognitive Science Department, Rensselaer Polytechnic Institute,Troy, New York.
[15] R. Sun (ed.), (2006). Cognition and Multi-Agent Interaction: From Cognitive Modeling to Social Simulation. Cambridge University Press, New York.
[16] R. Sun, (2007). The importance of cognitive architectures: An analysis based on CLARION. Journal of Experimental and Theoretical Artificial Intelligence, in press.
[17] J. Hertz, A. Krogh, R.G. Palmer, Introduction to the Theory of Neural Computation, Addison-Wesley, Reading, MA, 1991.
[18] D.P. Bertsekas, J.N. Tsitsiklis, Neuro-Dynamic Programming, Athena Scientific, Belmont, MA, 1996.
[19] Neural Networks on the NetBeans Platform , Zoran Severac published by Oracle, Feb 2011.