Clustering Multi-Attribute Uncertain Data using
Probability Distribution
Kulkarni V.V
PG Student
N. K. Orchid College of Engineering and Technology, Solapur-413002
Bag .V.V
Associate Professor
N. K. Orchid College of Engineering and Technology, Solapur-413002
ABSTRACT
Clustering is an unsupervised classification technique for grouping set of abstract objects into classes of similar objects. Clustering uncertain data is one of the essential tasks in mining uncertain data. Uncertain data is typically found in the area of sensor networks, weather data, customer rating data etc. The earlier methods for clustering uncertain data based on probability distribution, uses Kullback-Leibler divergence to measure similarity between two uncertain objects. In this paper, uncertain object in discrete domain is modeled, where uncertain object is treated as a discrete random variable. The Jenson-Shannon divergence is used to measure the similarity between two uncertain objects and integrate it into partitioning and density based clustering approaches. Experiments are performed to verify the effectiveness and efficiency of model developed and results are at par with the existing approaches.
General Terms
Clustering AlgorithmsKeywords
Clustering, Uncertain Data, Discrete Domain, Multi-Attribute Data
1.
INTRODUCTION
Clustering is a fundamental data mining task. Clustering has been studied for years in data mining, machine learning, pattern recognition, bioinformatics, recommendation systems and some other fields. The process of grouping a set of physical or abstract objects into classes of similarobjects is called clustering. A cluster is a collection of data objects that are similar to one another within the same cluster and are dissimilar to the objects in other clusters [2], [4]. In computer science, uncertain data is the notion of data that contains specific uncertainty. When representing such data in a database, some indication of the probability of the occurrence of various values is considered. Uncertain data exist in Temperature data, sensor data, and marketing data. Clustering uncertain data has been well recognized as an important issue [1][2][5][10].The problem of clustering multi-attribute uncertain data according to their probability distribution happens in many scenarios.
For example, the customer ratings on different mobiles, on different aspects of mobiles like features, performance, design, value etc. customer satisfaction to particular mobile can be considered as an a uncertain object. Also two mobiles have same mean score, are substantially different if their score variances are different. Also it is
needed to consider the similarity of both the mobiles based on different aspects.
As another example, in recommendation system for generating list of good restaurants according to the consumer preferences. Consumer gives preferences or ratings on different services like overall rating, food rating, service rating etc. Consumer preferences to a particular restaurant can be considered as an uncertain object. Also, it is needed to consider the preferences on different aspects if also mean of two restaurants preferences is same, but their variances are different. Data uncertainty brings new challenges to clustering, since clustering uncertain data demands a measurement of similarity between uncertain data objects[1][2][5].
2.
LITERATURE REVIEW
The previous studies on clustering uncertain data are largely various extensions of the traditional clustering algorithms designed for certain data. As an object in a certain data set is a single point, the distribution regarding the object itself is not considered in traditional clustering algorithms. Traditional methods to cluster uncertain data uses geometric distance-based similarity measures, and cannot capture the difference between uncertain objects with different distributions. Specifically, three categories exist in literature, namely partitioning clustering approaches, Density based clustering approaches, clustering with KL divergence. Third approach considers the probability distribution as similarity measure for clustering uncertain object and uses KL divergence [11].
2.1
Partitioning Clustering Approaches
Given D a data set of n objects and k the number of clusters to form.A partitioning algorithm organizes the objects into k partitions where each partition represents a cluster. The clusters are formed to optimize an objective partitioning criterion, such as a dissimilarity function based on distance, so that the objects within a cluster are similar whereas the objects of different clusters are dissimilar [4].Partitioning clustering approaches extend the k-means method with the use of the expected distance to measure the similarity between two uncertain objects. The expected distance between an object P and a cluster centre c is
29 assigned to [6]. The second algorithm uses the idea of min
max distance pruning in UK-means with the objective of reducing the number of expected distance calculations.UK-means starts by randomly selecting k points as cluster representatives. Each object is then assigned to the cluster whose representative has the smallest expected distance from ( ) among all clusters. In literature, traditional clustering approaches for clustering uncertain data extend the geometric distance based approaches and which considers only the expected distance of uncertain object and not considering the distribution of uncertain object[7].
2.2
Density Based Clustering Approaches
DBSCAN (Density-Based Spatial Clustering of Applications with Noise) is a density-based clustering algorithm. Density-based clustering methods have been developed to discover clusters with arbitrary shape. These typically regard clusters as dense regions of objects in the data space that are separated by regions of low density. DBSCAN grows clusters according to a density-based connectivity analysis. The algorithm grows regions with sufficiently high density into clusters and discovers clusters of arbitrary shape in spatial databases with noise. It defines a cluster as a maximal set of density-connected points[4]. In many modern applications ranges e.g. clustering of moving objects or sensor database, only uncertain data is available. For instance, in the area of mobile services the objects continuously change their position, so that exact position information is often not available. Fuzzy distance measure is used for measuring similarity between two fuzzy objects [8]. In real applications there is often no sharp boundary between clusters so that fuzzy clustering is useful for such data. Membership degrees between one and zero are used in fuzzy clustering instead of crisp assignments of data to cluster. The algorithm FDBSCAN is based on an enhanced version of core object definition and the core object probability of an object O indicates the likelihood that O is core object. The probability definition of core object differs from traditional approach where the similarity between fuzzy objects is measured by their distance expectation values [9]. In literature, fuzzy distance based approaches are used to extend the traditional density based clustering approaches. Fuzzy distance based approach extend traditional density based approach based on fuzzy distance measure and not considering the probability distribution of uncertain object.2.3
Clustering Using KL-Divergence As a
Similarity Measure
Clustering uncertain objects according to the similarity between their probability distributions occurs in many scenarios. In information theory, the similarity between two distributions can be measured by the Kullback-Leibler divergence. The distribution difference cannot be captured by geometric distances. Uncertain objects are considered as random variables with certain distributions and both the discrete case and the continuous cases are considered. An uncertain object is considered as a random variable following a probability distribution in domain D. Uncertain objects can have any discrete or continuous distribution. In the discrete case, the domain has a finite number of values, for e.g., the rating of a camera can only take a value in {1, 2, 3, 4, and 5}. In the continuous case, the domain is a continuous range of values, for e.g., the
temperatures recorded in a weather station are continuous real numbers. Kullback-Leibler divergence is used to measure the similarity between two distributions [11].
2.3.1
KL divergence
In the discrete case, let and be two probability mass functions in a discrete domain D with a finite or countable infinite number of values. The Kullback-Leibler divergence (KL divergence for short) between and is
( || ) =
3.
METHODOLOGY
The first paper to study clustering uncertain objects using probability distribution as a similarity measure and also used KL divergence to measure the similarity between two uncertain object [11].The sources of Multi-attribute uncertain data are customer ratings on mobiles on different aspects of mobiles like features, performance, design, value etc. In such a scenario we need to consider the probability of occurrences of rating on each mobile on each aspects of a mobile. So to cluster mobiles based on ratings on different aspects it is needed to consider the probability distribution as a similarity measure.
3.1
Uncertain Objects And Probability
Distribution
Uncertain object is considered as a random variable following a probability distribution in a domain D. Uncertain object is modeled only in discrete case. If the domain is discrete with a finite or countably infinite number of values, the object is a discrete random variable and its probability distribution is described by a probability mass function. For example, the ratings of mobile are a discrete set {1, 2, 3, 4, and 5}.
For discrete domains, the probability mass function of an uncertain object can be directly estimated by normalizing the number of observations against the size of the sample. Formally the pmf (Probability mass function) of object P is
Where is an observation of P and is the cardinality of a set.
3.2
Jenson-Shannon Divergence
In probability theory and statistics, the Jensen–Shannon divergence is a popular method of measuring the similarity between two probability distributions. It is also known as information radius or total divergence to the average. It is based on the Kullback–Leibler divergence, with some notable (and useful) differences including that it is symmetric and it is always a finite value. The Jensen– Shannon divergence (JSD) is a symmetrized and smoothed version of the Kullback–Leibler divergence.
It is defined by
Where
3.3
Clustering Algorithms
based approaches. In this section, the clustering methods for JS-Divergence to cluster Multi-attribute uncertain objects in these two categories are presented. In section 3.3.1 presents a Randomized Uncertain K-Medoids algorithm andsection 3.3.2 presents an Uncertain DBSCAN algorithm based on JS-Divergence.
3.3.1
Partitioning Clustering Approaches
A Partitioning clustering method organizes a set of n uncertain objects Ο into k clusters C1,….Ck, such that
for
any .Using JS-Divergence as similarity ,a partitioning clustering method tries to partition objects into k clusters and chooses the best k representatives, one for each cluster, to minimize the total divergence. Using divergence as a similarity, a partitioning clustering method tries to partition objects into k clusters and chooses the best k representatives, one for each cluster to minimize the total divergence. In partitioning clustering approaches we adopt the K-Medoids method to demonstrate the performance.
3.3.1.1
Randomized Uncertain K-Medoids
Algorithm
The randomized Uncertain K-Medoids method contains two phases, building phase and swapping phase.
Building Phase: In the building phase, the method obtains an initial clustering by selecting k representatives randomly one after another. At the beginning the building phase is simplified by selecting the initial k representatives as random. Non-selected objects are assigned to the most similar representative according to JS-Divergence. After assigning the non-selected objects to nearest representative, the total current error is calculated for this assignment i.e. current error.
Swapping Phase: In the swapping phase, the method iteratively improves the clustering by swapping a non-representative object with the non-representative to which it is assigned. Then, in the swapping phase, we iteratively replace representative by non-representatives objects. In each iteration, a non-representative object P is randomly selected to replace the representative C to which P is assigned. To determine whether P is a good replacement of C, we examine the two cases in swapping phase.
If currently belongs to C, when C is replaced by P, we will assign to P or one of another k-1 existing representatives, to which is the most similar.
If currently belongs to a representative other than C, and is reassigned to P.
After all non-representative objects are examined, the total decrease of the total divergence by swapping P and C is recorded. In swapping phase non-representatives are swapped with the representative, the total error is calculated for this assignment i.e. changed error. Current error and changed error are compared for replacing the non-representative with representative.
3.3.2
Density based clustering Approaches
DBCAN (Density-Based Spatial Clustering of Applications with Noise) is a density- based clustering algorithm. Density-based clustering methods have been developed to discover clusters with arbitrary shape. These typically regard clusters as dense regions of objects in the data space that are separated by regions of low density.
DBSCAN grows clusters according to a density-based connectivity analysis.
3.3.2.1
Uncertain DBSCAN Algorithm
The Uncertain DBSCAN method finds dense regions through core objects whose -neighbourhood contains at least µ objects. Formally P is a core object, if
An object Q is said to be directly density-reachable from an object P if and P is a core object. Every core object forms a cluster and a non-core object is assigned to the closest core object if it is direct density reachable from this core object. The algorithm iteratively examines objects in the dataset until no new objects can be added to any cluster. The quality of clustering for Uncertain DBSCAN algorithm depends upon the parameters and µ.
4.
EXPERIMENTAL ANALYSIS
4.1
Synthetic Dataset
The synthetic dataset is generated in discrete domain. The user ratings on different mobiles like Samsung, Micromax, Nokia, and Lava etc from different websites like Samsung website, 91mobiles.com are collected The ratings on five different attributes or features of mobile like Features, Performance, Design, Value, Overall ratings are collected. The ratings are in the range of 1 to 5 and the total 100 mobiles are considered in evaluation i.e. 100 uncertain objects are used to evaluate the performance.
4.2
Real Dataset
To perform experiments and analyze the results of approach, real dataset on Restaurant and Consumer ratings is used from UCI Machine Repository. The dataset consist of total 130 restaurants and also contains different context information about the consumer and demographic information about the different restaurants.It contains ratings of consumer for different restaurants on different aspects like Overall rating, Food rating, Service rating etc. The ratings are in the range of (0, 1 and 2). The results are analyzed based on Randomized Uncertain K-Medoids algorithm and Uncertain DBSCAN algorithm, in both case i.e. KL-Divergence and JS-Divergence.
4.3
Experimental Results
In experimental results the clustering quality of JS divergence is compared with clustering quality of KL divergence in partitioning clustering and density based clustering approaches. There are two methods i.e. External validation techniques and internal validation techniques.Internal validation techniques use internal criteria to measure the clustering quality. External validation techniques use external criteria to compare the quality of clustering. External validations techniques like precision, recall and F-Measure are used as the quality measurements. In statistical analysis the F-Measure is a measure of a test's accuracy. It considers both the precision P and the recall R of the test to compute the score. The F-Measure score can be interpreted as a weighted average of the precision and recall, where an F-Measure score reaches its best value at 1 and worst score at 0.
31 objects are called a pair if they appear in the same cluster
in a clustering. We define
TP true positive, the set of common pairs of objects in both G and C;
FP false positive, the set of pairs of objects in C but not G; FN false negative, the number of pairs of objects in G but not C
Then, the precision, recall and F-Measure of a clustering C are calculated as
Precision(C) = Recall(C) =
F-Measure =
[image:4.595.325.541.95.259.2]
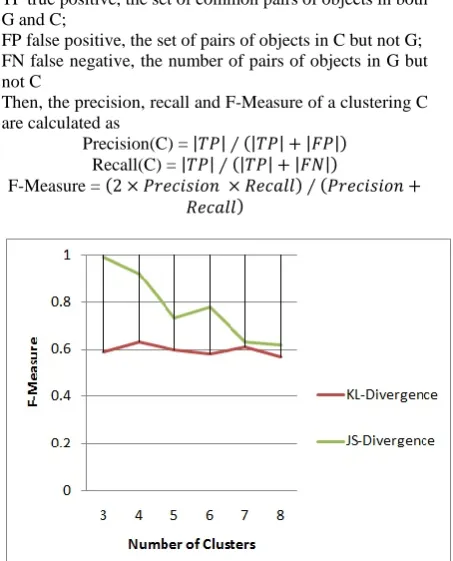
Figure 1: Graph on comparison for Randomized Uncertain K-Medoids F-Measure values between
[image:4.595.77.304.109.390.2]KL-Divergence and JS-KL-Divergence against the number of clusters
Table 1: F-Measure values in both case for number of clusters for Randomized Uncertain K-Medoids
Number of Clusters
F-Measure for KL-Divergence
F-Measure for JS-Divergence
3 0.59 0.99
4 0.63 0.92
5 0.60 0.73
6 0.58 0.78
7 0.61 0.63
8 0.57 0.62
Figure.1. shows comparison graph on F-Measure values for Randomized Uncertain K-Medoids algorithm between KL-Divergence and JS-Divergence. Table 1 contains list of F-Measure values in both case. In both case F-Measure is measured against the number of clusters. Clustering quality of KL-Divergence is shown by red line in graph and for JS-Divergence it is shown by green line in graph. The values for F-Measure for KL-Divergence lies in the range of 0.5 to 0.6 and in same case value of F-Measure for JS-Divergence lies in the range of 0.6 to 0.9.
The Figure.1. shows that the F-Measure value decreases as the number of cluster increases. JS-Divergence is symmetric, so it considers the similarity of both the uncertain objects. The quality of clustering is also depend
upon the user input ‘k’ i.e. number of clusters,for partitioning clustering approaches.
Figure 2: Graph on comparison for Randomized Uncertain K-Medoids, F-Measure values between
[image:4.595.343.526.333.444.2]KL-Divergence and JS-KL-Divergence against the number of features
Table 2: F-Measure values in both case for number of features for Randomized Uncertain K-Medoids
Number of Features
F-Measure for KL-Divergence
F-Measure for JS-Divergence
1 0.60 0.78
2 0.59 0.77
3 0.61 0.82
4 0.58 0.80
5 0.60 0.69
To evaluate the performance and quality of clusters based on different features listed in dataset, the clusters are formed for number of features which shows the similarity between the different features. The total five features are used for evaluations which are Features, Performance, Design, Value, and Overall Rating.Figure.2. shows graph for comparison on F-Measure values for Randomized K-Medoids algorithm between KL-Divergence and JS-Divergence against the number of features. Table 2 contains list of F-Measure values in both case.
[image:4.595.93.275.464.599.2]Figure 3: Graph on comparison for Uncertain DBSCAN, F-Measure values between KL-Divergence
[image:5.595.96.273.325.439.2]and JS-Divergence against the number of features
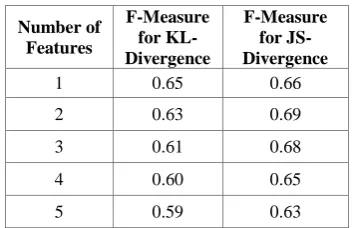
Table 3: F-Measure values in both case for number of features for Uncertain DBSCAN
Number of Features
F-Measure for KL-Divergence
F-Measure for JS-Divergence
1 0.65 0.66
2 0.63 0.69
3 0.61 0.68
4 0.60 0.65
5 0.59 0.63
Figure.3. shows graph for comparison on F-Measure values for Uncertain DBSCAN algorithm between KL-Divergence and JS-KL-Divergence against the number of features. In both cases F-Measure is measured against the number of clusters. Table 3 contains list of F-Measure values in both case. Clustering quality of KL-Divergence is shown by red line in graph and for JS–Divergence it is shown by green line in graph. The performance of Uncertain DBSCAN algorithm depends upon the two factors -neighbourhood and µ-minimum number of objects. Experiments are performed for µ=3 and, variations in the values of . The performance of clustering is analyzed in both cases by increasing the number of features. The F-Measure values for KL-Divergence lies in the range of 0.6 and for JS-Divergence it lies in the range of 0.6 to 0.67.
In experimental results the clustering quality of Jenson-Shannon Divergence is compared with the Kullback-Leibler Divergence for discrete case. Jenson-Shannon Divergence is similar to Kullback-Leibler divergence with some notable and useful difference. JS-Divergence is
symmetric and KL-Divergence is asymmetric. Jenson Shannon-Divergence considers the similarity of
both the uncertain object.
5
CONCLUSION
In this paper clustering multi-attribute uncertain data based on probability distribution in discrete case is modeled. The results are analyzed and compared based on Jenson-Shannon Divergence and Kullback-Leibler Divergence as a similarity measurement. The data considered only in the discrete case, like multi-attribute data like customer ratings on different mobiles on different features or aspects of mobile. The KL-Divergence and JS-Divergence are integrated in the partitioning clustering and density based clustering approaches.
The contribution of this paper is to analyze the results of Jenson-Shannon Divergence as a similarity measure in discrete case and evaluation of the effectiveness of probability distribution as a similarity measure in real time datasets. In future, we will study problems related to evaluation policies related to clustering Multi-Attribute uncertain data.
6.
REFERENCES
[1] R.Cheng, D. V. Kalashnikov, and S. Prabhakar. Evaluating probabilistic queries over imprecise data. In SIGMOD, 2003.
[2] N. N. Dalvi and D. Suciu. Management of probabilistic data: foundations and challenges. In PODS, 2007.
[3] A.K.JAIN Michigan State University, M.N.MURTHY Indian Institute of Science and P.J.FLYNN The Ohio State University “Data Clustering: A Review”.
[4] Jiawei Han, Micheline Kamber “Data Mining Concepts and Technique”.
[5] J.Pei, B.Jiang, X.Lin and Y.Yuan “Probabilistic skylines on uncertain data”. In VLDB, 2007. [6] WangKayNgai, Ben Kao, ChunKitChui, Reynolds
Cheng, Michael Chau, KevinY.Yip “Efficient Clustering Of Uncertain Data”. In ICDM, 2005. [7] B. Kao, S. D. Lee, D. W. Cheung, W.-S. Ho and K. F.
Chan. Clustering uncertain data using voronoi diagrams. In ICDM, 2008.
[8] Hans-Peter Kriegel, Martin Pfeifle “Density Based Clustering of Uncertain Data”. In KDD 2005. [9] H.P.Kriegel and M. Pfeifle. Hierarchical
density-based clustering of uncertain data. In ICDM, 2005. [10]A.Banerjee, S.Mergu, I.S.Dhillion, and J. Ghosh
“Clustering Using Bregman Divergences“. Journal of Machine Learning Research, 2003.