Abstract—Functional Electrical Stimulation requires an accurate model of electrically stimulated muscles to control the muscle contraction force. Characterization of electrically stimulated muscle is complex because of the non-linearity and time-varying nature of the system with interdependent variables. The muscle model consists of relatively well known time-invariant passive properties and uncertain time-variant active properties. In this research a new approach for estimating nonlinear active properties of the electrically stimulated quadriceps muscle group is investigated. The objective of this study is to develop a model that could be used to describe active joint properties including continuous-time nonlinear activation dynamics and nonlinear static contraction. As an example, the modelling of a freely swinging lower leg by electrical stimulation of the quadriceps is considered.
Keywords—Knee joint, functional electrical stimulation, genetic algorithm, fuzzy inference system
I. INTRODUCTION
HE identification of the joint/muscle properties of lower limbs in people with spinal cord injury (SCI) has been a topic of active research for several decades. Many researchers have developed electrically stimulated muscle models ranging in levels of sophistication from simple to complex. The use of electrical signals to restore the function of paralyzed muscles is called functional electrical stimulation (FES). FES is a promising method to restore mobility to individuals paralyzed due to SCI. Modelling and parameter identification of both the passive and active joint properties are needed to improve control of this nonlinear time varying system. In order to develop a control strategy for the FES to make the movement of the leg correctly, a proper model of the stimulated muscle has to be used. Most muscle models built either on experimental or physiological bases are not appropriate for control applications, since these models characterize each muscle feature alone, and sometimes there is no connection between the modelled features which may prevent from modelling the whole muscle as one model [7].
The muscle is assumed to consist of two components: an active force generator and parallel passive properties. Riener
Manuscript received May 29, 2009. The financial support of Higher Education Ministry of Malaysia is greatly acknowledged.
B.S.K.K.Ibrahim is with the Department of Automatic Control and System Engineering, University of Sheffield, UNITED KINGDOM on study leave from the University Technology Tun Hussein Onn, Malaysia (e-mail :[email protected]).
M.S.HUQ, M.O. TOKHI, S.C. GHAROONI, R. JAILANI & Z.HUSSAIN are with Department of Automatic Control and System Engineering, University of Sheffield, UNITED KINGDOM.
and Edrich [10] suggested that active and passive muscle properties should be identified separately as it is easier so to identify. Other researchers such as Zajac [11] and Pandy et al. [12] used a musculo-tendon model, in which the passive and the active forces are generated by single muscle. However, such models have too many parameters that cannot be identified non-invasively due to the muscle-joint redundancy of the musculoskeletal system. The muscle force is controlled by changing the number of active motor units by pulse width modulation, using constant-frequency stimulation. The active component is composed of two parts: muscle activation and muscle contraction. Muscle activation [Nm] is computed from the pulse width of electrical stimulation. Muscle contraction results from combination of the angle and moment-velocity relations. Therefore, muscle contraction is computed from the knee joint angle and the knee joint velocity.
This paper describes a new estimation method of active component of electrically stimulated knee joint model using genetic algorithm (GA) to fit the experimental data. Fuzzy modelling is used to represent the active components (combination of the muscle activation and contraction) of the knee joint model. The inputs for the fuzzy inference system (FIS) are stimulation pulse width, knee joint angle and knee joint velocity, while the output is the active torque. The method requires passive properties and equation of motion to be known a priori. Passive properties such as elasticity moment and viscosity are identified using the pendulum test. The equation of motion is represented by a dynamic model of the lower limb using the Visual Nastran4D (Vn4D) computer aided design software program. The model is implemented in MATLAB/SIMULINK with Fuzzy Logic Toolbox and the computed motion is visualized by graphic animation using Vn4D.
II. MATERIAL AND METHODS
The shank-quadriceps dynamics are modelled as the interconnection of a passive part and an active part. The total knee-joint moment is given by [4]
d s g
i
M
M
M
M
M
a (1)where
M
arefers to an active knee torque produced byelectrical stimulation,
M
sis the knee joint elastic moment andd
M
is the viscous moment representing the passive behaviourof the knee joint. The inertial (
M
i) and gravitational (M
g)moments are represented by the Vn4D dynamic model of the lower limb in this study.
Identification of Active Properties of Knee
Joint using GA Optimization
B.S. K. K. Ibrahim, M.S.Huq, M.O. Tokhi, S.C. Gharooni, R. Jailani and Z.Hussain
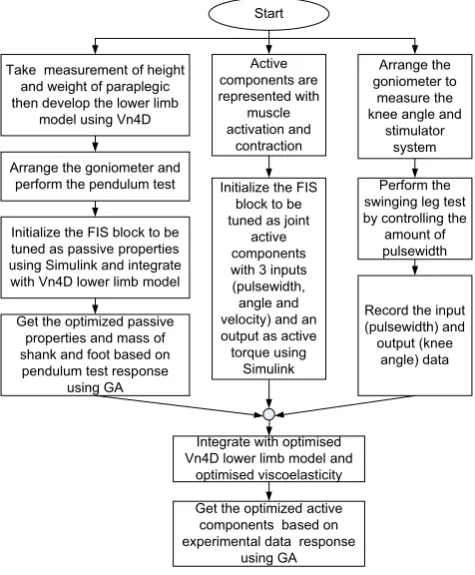
In this section, first the use of pendulum test result for optimizing the passive properties and masses of the lower limb model is briefly described. Second, an electrically stimulated swinging leg test is presented to get the experimental data to realize the new technique of identification. Lastly a new method for evaluating a fuzzy system’s performance to represent the active components of knee joint model is outlined. The estimation procedure of the active properties of paraplegic using the optimized segment masses and the passive properties of the knee joint model are as shown in Figure 1.
7DNHPHDVXUHPHQWRIKHLJKW DQGZHLJKWRISDUDSOHJLF WKHQGHYHORSWKHORZHUOLPE
PRGHOXVLQJ9Q'
3HUIRUPWKH VZLQJLQJOHJWHVW E\FRQWUROOLQJWKH
DPRXQWRI SXOVHZLGWK
5HFRUGWKHLQSXW SXOVHZLGWKDQG RXWSXWNQHH
DQJOHGDWD $UUDQJHWKH JRQLRPHWHUWR PHDVXUHWKH NQHHDQJOHDQG
VWLPXODWRU V\VWHP
*HWWKHRSWLPL]HGSDVVLYH SURSHUWLHVDQGPDVVRI VKDQNDQGIRRWEDVHGRQ SHQGXOXPWHVWUHVSRQVH
XVLQJ*$
6WDUW
,QLWLDOL]HWKH),6EORFNWREH WXQHGDVSDVVLYHSURSHUWLHV XVLQJ6LPXOLQNDQGLQWHJUDWH ZLWK9Q'ORZHUOLPEPRGHO
,QLWLDOL]HWKH),6 EORFNWREH WXQHGDVMRLQW
DFWLYH FRPSRQHQWV ZLWKLQSXWV SXOVHZLGWK DQJOHDQG YHORFLW\DQGDQ RXWSXWDVDFWLYH WRUTXHXVLQJ
6LPXOLQN
,QWHJUDWHZLWKRSWLPLVHG 9Q'ORZHUOLPEPRGHODQG
RSWLPLVHGYLVFRHODVWLFLW\ $UUDQJHWKHJRQLRPHWHUDQG
SHUIRUPWKHSHQGXOXPWHVW
*HWWKHRSWLPL]HGDFWLYH FRPSRQHQWVEDVHGRQ H[SHULPHQWDOGDWDUHVSRQVH
XVLQJ*$ $FWLYH FRPSRQHQWVDUH UHSUHVHQWHGZLWK
PXVFOH DFWLYDWLRQDQG
[image:2.595.46.284.202.490.2]FRQWUDFWLRQ
Fig. 1. Estimation procedure
A. Pendulum Test
Pendulum test can be used to evaluate the viscosity and elasticity moments of the knee to represent passive resistances to joint motion associated with structural properties of the joint tissue and of muscular-tendon complex. In this study, firstly the result obtained from the pendulum test is used with GA optimization approach to identify and estimate the passive properties such as elasticity moment, damping coefficient of viscosity and mass of the foot and shank of paraplegic. The goal of GA optimization process is to minimize the error between the knee angle obtained experimentally and from the model.
B. Swinging leg test using electrical stimulation
Active properties including muscle activation and contraction are identified from an electrically stimulated swinging leg test. The computer controlled functional electrical stimulator system is tested on paraplegic subject. HASOMED current-controlled stimulation device was used to
send the signals to the muscles. The unit is small and the generators can deliver trains of stimuli with variable current strengths and variable pulse widths. The technical specifications of this device are listed in Table 1. In the PC-controlled configuration the stimulator device can be simply connected to PC via USB interface port.
TABLE I
TECHNICAL CHARACTERISTICS OF THE STIMULATOR
Parameter Range
Current 0 . . . 126mA in 2mA steps
Pulse width ȝVLQȝssteps
Frequency 25 Hz
The identification experiment was performed on the knee joint of paraplegic subject.The subject sat on a chair, which allowed the lower leg to swing freely, while the hip angle was fixed at 70° of flexion as shown in Figure 2.
Fig. 2. Computer controlled functional electrical stimulator system
[image:2.595.353.504.344.485.2]The quadriceps muscle was stimulated using adhesive surface electrodes with the cathode (negative) placed just proximally over the estimated motor point of rectus femoris and the anode (positive) approximately 4-cm proximal of the patella as shown in Figure 3. Electrodes are applied to the skin above the relevant muscles at a distance of 10-15 cm.
[image:2.595.379.476.599.722.2]The knee joint angle was monitored by a goniometer with the arrangement shown in Figure 4.
Fig. 4 Arrangement of goniometer
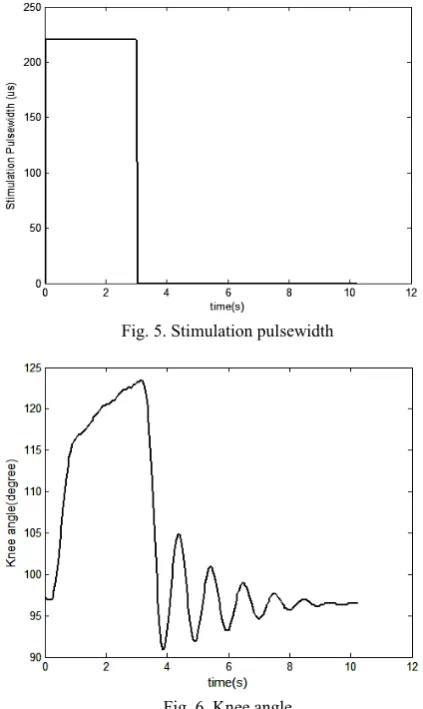
[image:3.595.309.484.177.310.2]The stimulation current was fixed to 40mA and frequency was set to 25Hz with a doublet type pulse. The input and output from this experiment are shown in Figures 5 and 6 respectively. Active component identification was performed on the quadriceps (knee extensor) muscle group only. The subject was a 48 year-old T2&T3 incomplete paraplegic male, 20 years post-injury with height = 173cm and weight =80kg. Informed consent was obtained from the subject.
[image:3.595.54.266.366.721.2]Fig. 5. Stimulation pulsewidth
Fig. 6. Knee angle
C. Identification Approach
1. Lower Limb Model and Passive Properties
The lower limb model is a swinging leg composed of two rigid segments: the thigh and the shank-foot. The model of a dynamic system of the lower limb thus built using Vn4D is shown in Figure 7.
Fig. 7. Lower limb model
[image:3.595.355.498.405.475.2]It is vital that the dimensions of the leg are chosen correctly. This is because the simulation results will be dependent upon the dimensions. The lower limb model dimensions are based on the subject’s lower limb measurements as shown in Table 2.
TABLE II
ANTHROPOMETRIC DATA OF PATIENT
Segment Length
[m]
Thigh 0.4239
Shank 0.4256
Foot 0.0675
The estimated passive properties such as elastic moment and viscous moment from pendulum test have been applied to the model as passive joint moments as shown in Figure 8.
Fig. 8. Schematic representation of the model developed
[image:3.595.310.536.524.614.2]obtained experimentally and from the model response. The output prediction errors can be defined as
follows:-) ( ˆ ) ( )
(t y t y t
e (2)
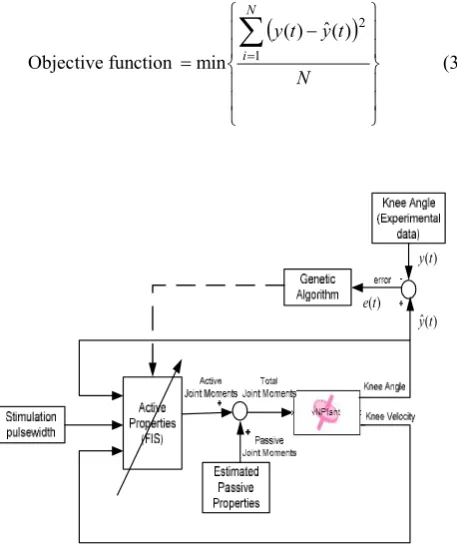
where y(t)is the experimental data and yˆ(t)is the estimated current output of knee angle. The estimated output, one measure the ‘goodness of fit’ of the identified model using the objective function by minimizing the mean-squared error (MSE) Objective function
° ° ¿ ° ° ¾ ½ ° ° ¯ ° ° ® ¦
N t y t y N i1 2 ) ( ˆ ) (min (3)
[image:4.595.57.286.185.458.2]) (t e ) (t y ) ( ˆt y
Fig. 9. Optimization of active properties
GAs are search algorithms based on the mechanics of natural selection and population genetics theory. They were introduced in 1975 by John Holland [2]. First, an initial population comprising 50 individuals is generated. Each individual corresponds to a chromosome, which is a set of specific genes from the biological point of view. The performance of each member of the population is assessed through an objective function imposed by the problem. This fires the process of selecting pairs of individuals which will be mated together during reproduction. Each individual is assigned a fitness value derived from its raw performance measure, given by the objective function. This value is used in the selection to bias towards more fit individuals. Highly fit individuals, relative to the whole population, have a high probability of being selected for mating, whereas less fit individuals have a correspondingly low probability of being selected [1].
The configuration of the fuzzy expert system model is shown in Figure 10. In the fuzzification, crisp inputs are fuzzified into linguistic values to be associated to the input linguistic variables. After fuzzification, the inference engine refers to the fuzzy rule base containing fuzzy IF-THEN rules
to derive the linguistic values for the intermediate and output linguistic variables. Once the output linguistic values are available, the defuzzifier produces the final crisp values from the output linguistic values. One of the methods to make sure that the universe of discourse covers the whole range without going over is by applying scaling factors. Therefore four scaling factors are used to normalize the variables between -1 to +1. These are; (S1) knee angle scaling factor, (S2) pulsewidth scaling factor, (S3) angular velocity scaling factor and (S4) scaling factor of fuzzy system output.
6
6
6
6
Fig. 10. A fuzzy expert system model
In order to efficiently design a controller while assuring high performance, the fusion of Fuzzy Logic Control (FLC) and GA is steadily growing, mainly to optimise fuzzy rules and/or fuzzy membership functions (MFs) [8]. Tarng and Nian [9].proposed an automatic synthesis of MFs based on a GA to control non-linear and time-varying tuning processes. The effectiveness of the technique was shown by a computer simulation and by experimental verification. In this study GA based optimization of the fuzzy system is adapted for modelling purposes. There are 689 parameters to optimize including 60 parameters relating to the triangular MF, 625 rule weights for the fuzzy rules and 4 scaling factors. The first rule for this system with three inputs (pulsewidth, angle and velocity) and one output is as: ‘If input 1 is MF 1 and input 2 is MF 1 and input 3 is MF1, then output 1 is MF 1’. There are 5 MFs, therefore the combination of different rules for this system can reach up to 625 rules.
III. RESULTS AND DISCUSSION
[image:4.595.309.541.238.319.2]Fig. 11 Convergence of the GA
The responses of the active experimental knee angle and the simulation result are shown in Figure 12. It is noted that the two agree closely with one another.
Fig. 12. The experimental by measured and simulated knee angles
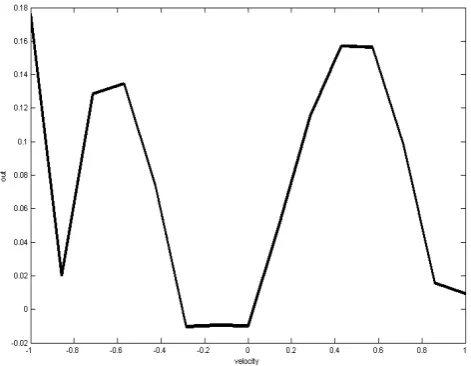
[image:5.595.309.546.88.244.2]The nonlinear active components represented by non-linear function of fuzzy model with scaling factor for the normalization and denormalization of 3 fuzzy system inputs and outputs were as S1= 0.0061322, S2=0.0059891, S3=0.0082962 and S4=91.696. In the fuzzy system, 625 weights associated with the fuzzy rules between 0 and 1 were optimised. The fuzzy system takes into account the nonlinearity in the active component of the knee joint model. The presence of the non-linearities in the active components of the joint model can be noted on this uneven surface shape of the fuzzy mapping surface. Figure 13 shows the cross section of the fuzzy control surface of pulsewidth and fuzzy output relationship with fixed knee angle and angular velocity. Figure 14 shows the cross section of the fuzzy control surface of knee angle and fuzzy output relationship with fixed pulse width and angular velocity and Figure 15 shows the cross section of the fuzzy control surface angular velocity and fuzzy output relationship with fixed pulse width and knee angle. These 3 surfaces were generated by the 625 fuzzy rules.
Fig. 13. Fuzzy control surface of pulsewidth and output
Fig. 14. Fuzzy control surface of knee angle and output
[image:5.595.46.286.275.441.2] [image:5.595.310.550.275.443.2] [image:5.595.309.545.492.675.2]IV. CONCLUSION
A new approach of identification and estimation of the active properties of the knee joint of SCI patient has been presented. Fuzzy model identification has shown an effective tool for the approximation of uncertain nonlinear systems. GA has been used to optimize the fuzzy system properties by optimizing the membership functions, weight rules and scaling factors to represent the active properties with combination of muscle activation and contraction. The identified and estimated stimulated model exhibited good prediction capabilities. This model can be used with passive joint properties to get the complete model of knee joint. The complete model of joint thus obtained can be used for the design of controllers for FES stimulation.
.
REFERENCES
[1] A. Chipperfield, P. Fleming, H. Pohlheim, and C. Fonseca, Genetic algorithms toolbox user’s guide, Research Report 512, Dept. Automatic Control and Systems Engineering, University of Sheffield, Sheffield, U.K. 1994.
[2] D. E. Goldberg, Genetic algorithms in search, optimization and machine learning. Reading, MA: Addison-Wesley, 1989.
[3] D.A.Winter. Biomechanics and motor control of human movement. 2nd edition, Wiley-Interscience, New York, 1990.
[4] M. Ferrarin, and A. Pedotti, The relationship between electrical stimulus and joint torque: a dynamic model. IEEE Transactions on Rehabilitation Engineering, 8 (3), pp 342-352, 2000.
[5] M. Ferrarin, F. Palazzo, R. Riener, and J. Quintern. Model-based control of FES-induced single joint movements. IEEE Transactions on Neural Systems and Rehabilitation Engineering, 9 (3), pp. 245-257, 2001.
[6] M. S. Valle, A. Casabona, R. Sgarlata, R. Garozzo, The pendulum test as a tool to evaluate passive knee stiffness and viscosity of patients with rheumatoid arthritis. BMC Musculoskeletal Disorder, 2006.
[7] R. Massoud. Intelligent control techniques for spring assisted FES-cycling. PhD Thesis. The University of Sheffield, Sheffield, UK, 2007.
[8] O.Cordon, , F. Herrera, et al. Recent advances in genetic fuzzy systems, Information sciences, 136: 1-5, 2001.
[9] Y.S. Tarng, C.Y. Nian. Automatic synthesis of membership functions for the force control of turning operations, Journal of Materials Processing Technology 65: 80-87,1997.
[10] R. Riener and T. Edrich,Significance of passive elastic joint moments in FES, Proceedings of the 2nd Conference of IFESS, pp. 103-106, 1997.
[11] F.E. Zajac, Muscle and tendon properties: models, scaling, and application to biomechanics and motor control. CRC Critical Reviews in Biomedical Engineering 17, pp. 359-411, 1989. [12] M.G. Pandy, F.E. Zajac, E.Sim, W.S. Levine, An optimal control
model for maximum-height human jumping, Journal of