Volume 72– No.3, May 2013
Automated Classification of Centroblast Cells using
Morphological and Texture Features
Sandhya B.S
Department of ECE,SJBITVTU Belgaum,Karnataka India
Chayadevi M.L
Department of ISE,JSSATEVTU Belgaum,Karnataka India
Anitha P
Department of ECE,SJBIT VTU Belgaum,Karnataka
India
ABSTRACT
The early detection of lymphoma in patients can greatly increase the probability of recovery. Centroblasts of lymphoma are conventionally identified under microscopes by expert doctor’s manually. cytogenetics and immunopheno typing are currently used. A novel method has been proposed to recognize centroblast (CB) cells from non centroblast (non-CB) cells for computer assisted evaluation of lymphocyte centroblasts. The novel aspects is to identify the centroblast cells with prior information. Geometric and texture features are extracted from the input image for identification and classification. Important geometric features like area, boundingbox, convex area, perimeter, major-axis, minor-axis, solidity are extracted. Texture features are extracted using Log-Gabor filter. Combined features of texture and morphology improve the performance of the system significantly. Supervised support vector machine (SVM) classifier is used to classify centroblast (CB) and non-CB cell.
Keywords:
Lymphocyte, centroblast, texture feature, geometrical feature, SVM classifier, Gabor filter.1.
INTRODUCTION
Lymphoma is a type of cancer that begins in immune system cells called lymphocytes. Lymphoma is a cancer cell and it occurs when lymphocytes are in a state of uncontrolled cell growth and multiplication. Lymphoma occurs when lymphocyte B or T cells transform and begin growing and multiplying uncontrollably. Lymph nodes or lymph tissues collect more abnormal lymphocytes in spleen or tonsils, and a mass of cells together form a tumor. Tumors grow and occupy the surrounding space of tissues and organs, taking away oxygen and nutrients from them. There are two types of lymphoma: Hodgkin lymphoma [1] (HL, also called Hodgkin's disease) and non-Hodgkin lymphoma (NHL). Both HL and NHL can occur in the same places and have symptoms of similar type. At microscopic level HL and NHL differences are visible. Hodgkin lymphoma develops from a specific abnormal lineage of B cells. NHL may derive from either abnormal B or T cells. Centroblasts [2] are large non cleaved( division) cells. Centroblasts of Lymphoma are conventionally identified, analyzed and classified by pathologist under microscope for most of the diseases like cancer. Disease Centroblastic lymphoma is one of 3 morphologic variants of diffuse large B cell lymphoma (DLBCL). Centroblast (CB) and non-centroblast (non-CB) cells are identified as CB contains larger, darker nucleoluses with more objects and higher texture compared to non-CB. The analysis of histopathological image is done manually by the pathologist to detect disease which leads to subjective
diagnosis of sample which varies with level of expertise of examiner. Expert pathologists identify the centroblast under microscope based on the size and specific quantifying structures in the image as CB and non-CB.
Kamel [2] et al., have discussed about follicular lymphoma identification using spectral domain color texture features with quadratic discriminant analysis (QDA) classifier and principal component analysis (PCA) methods which results in 82.56% accuracy. Fabio scotti [3] have discussed about automatic morphological analysis for acute leukemia identification in peripheral blood microscope images using inductive classifier (feed-forward neural networks) based on the morphological features of the leukemia. Basavaraj S. Anami [7] et al.,have discussed about combined features of color, texture and edge based approach for identification and classification of Indian medicinal plants using SVM and RBE-NN classifier. The classification accuracies for color, edge texture features are 74% and 80% respectively.
In this paper CB and non-CB cells are identified using image processing techniques with proposed automation methods to extract morphological geometrical and texture features with support vector machines (SVM) [7] which is neural network classifier for better accuracy and results. The proposed method gives better accuracy results of 84.53% with the best SVM classifier.
2.
MATERIALS AND METHODOLOGY
Volume 72– No.3, May 2013
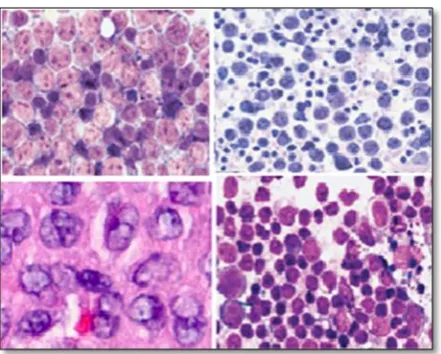
Fig 1: digital images with CB and non-CB cells.
Geometric area of the larger cell and its texture features are extracted for the identification of CB and non-CB cells. Input image has to preprocessed to eliminate noise and blur images.
[image:2.595.70.260.324.679.2]Fig 2: centroblast cells
Fig 3: non centroblastcells
Cell segmentation algorithm
(a) Read an input image for training and testing. (b) Preprocess the input image to remove noise. (c) Perform image smoothening using disc smooth
operator.
(d) Detect Edge using canny edge detector to obtain continuous edges.
(e) Perform opening and closing operation.
(f) Dilation morphological operator has been applied for edge connectivity. Disc dilation of radius 3 has been considered for better results.
(g) Connected components are filled using image hole filling method.
(h) Calculate area of the filled holes, then consider maximum area of the image( larger area is a CB cell) is considered and it is normalized for feature extraction.
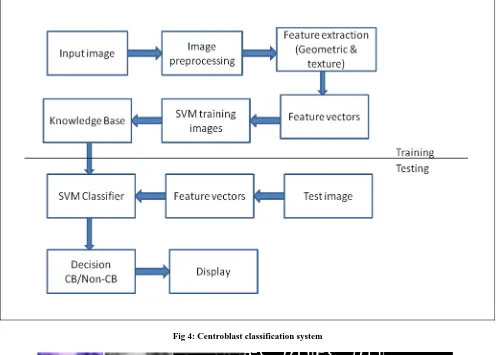
The cell segmentation algorithm is represented in Fig 4 and the results of the above algorithm are shown in Fig 5 below. Feature extraction [5-6] is a step for finding the morphology of lymphocytes. Geometric and Texture features are extracted for identification and classification. Eight geometrical features and fifty texture features are extracted before the classification.
Geometrical feature extraction:
Some of the important Geometrical features [3-6] extracted from the lymphocyte image are Area, BoundingBox, MajorAxisLength, MinorAxisLength, Orientation, ConvexArea, Solidity and Perimeter.Area : number of pixels of the selected patterns Area=
Bounding box: smallest rectangle containing the region with n pixels.
BoundingBox is [ul_corner width], where ul_corner is the upper left corner of the box and width specifies the width of the bounding box across the dimensions.
MajorAxisLength: specifies the length (in pixels) of the major axis of the ellipse.
MinorAxisLength: specifies the length (in pixels) of the minor axis of the ellipse.
Orientation: it is the angle between the x-axis and the major axis of the ellipse.
Convex area: Binary image that specifies the convex hull, with all pixels filled in polygon area.
Solidity: is the extent to which the shape is convex or concave. Solidity = Ab/H, Ab is the area of the shape region and H is the convex hull area of the shape.
Perimeter: the distance between each adjoining pair of pixels around the border of the region
Volume 72– No.3, May 2013
Fig 4: Centroblast classification system
(a)
(b) (c) (d) (e) (f)
Fig 5. (a) Original image (b) gray imgae (c) canny edge detection (d) image dilation (e) connected component hole filling of cells (f) max area identification
Texture feature extraction: Image texture is a function of homogeneity, roughness, smoothness, coarseness etc,. Fourier filters are used for extracting entropy, homogeneity, contrast, spatial frequency using Gabor method. Gabor is the most important method for texture features extraction. Log Gabor filters [8-9] has been used for edge detection, texture representation and discrimination. The impulse response function of the Gabor is the Fourier transform of Gaussian and Fourier transform of the Harmonic function.
g (x,y; λ, θ, φ, σ, γ) = exp (- exp ( i(- )
λ represents the wavelength of the sinusoidal factor, θ represents the orientation, φ is the phase offset, σ is the sigma of the Gaussian envelope and γ is the spatial aspect ratio of the image. The parameters will be calculated using Gabor function.
Wavelength (λ): represents the wavelength of the cosine factor of the Gabor kernel filter.
Orientation (θ): specifies the orientation of the normal to Gabor function. Orientation values are measured between 0 and 360o(degrees).
Phase offset(s) (φ): is the argument of the cosine factor of the Gabor function .its values range between -180 and 180(deg). Aspect ratio (γ): also known as spatial aspect ratio, specifies the ellipticity of the support of the Gabor function.
Bandwidth (b): The half-response spatial frequency bandwidth b of a Gabor filter is the ratio σ / λ, where σ and λ
[image:3.595.52.548.73.428.2]Volume 72– No.3, May 2013
Table 1: geometrical feature values of the sample image
Area Bounding
box
Major axis
length
Minor axis
length
orientation Convex
area
Solidity perimeter
1.7970
0.0450
0.0497
0.0463
-0.0685
1.8170
0.0010
0.1554
1.6450
0.0460
0.0480
0.0439
-0.0305
1.6790
0.0010
0.1634
1.9490
0.0530
0.0532
0.0468
0.0131
1.9810
0.0010
0.1634
6.8820
0.0940
0.0976
0.0905
0.0722
6.9890
0.0010
0.3102
802.00
31.000
35.0124
31.1773
-52.60
848.00
0.9458
109.84
2.4230
0.0580
0.0637
0.0487
0.0386
2.4510
0.0010
0.1844
1.7360
0.0430
0.0507
0.0438
0.0833
1.7580
0.0010
0.1536
Classification: Support Vector Machine (SVM) is a supervised classifier for the non-linear classification problem where the hyper-plane is not defined linearly. SVM classifier separates the set of objects into different objects to make optimal separation of test cases with different available training samples. SVM accepts the input lymphocyte images and predicts the 2 possible classes of outputs as CB and non-CB of the image. SVM testing and training gives better accuracy of the classification compared to the other classifiers.
3. RESULTS AND DISCUSSION
Digital Images of lymphocytes were collected from various hospitals. 100 images are considered for the experimental purpose. 70 and 30 images are used for training and testing respectively for SVM classifier. 70 trainig images are supervised or labelled by the expert doctors as CB and non-CB. Fig 6(a) represents the output automated classification GUI in matlab for the input testing image with the results classified as CB and non-CB. In the Fig 6(b) the original image contains both centroblasts and non-centroblast cells. Fig 6 (c) show the classified output of the cells named as 01 as non-centroblast cell and 02 as centroblast cell. The count of CB and non-CB helps the doctors to decide the intensity of the disease. 84.53% accuracy has been achieved using SVM classifier with Log gabor and geometric features.
(a)
Volume 72– No.3, May 2013
(c)
Fig 6: (a) Classification GUI (b) Testing Original image
(c) classfication of testing image as 01(non-CB cell) and 02 (CB cell).4. CONCLUSION
In this paper automated classification of centroblast cells using geometric, Log Gabor filter and supervised SVM classifier is proposed. Important geometric features like area, boundingbox, convex area, perimeter, major-axis, minor-axis, solidity are extracted. Texture features are extracted using Log-Gabor filter. Combined features of texture and morphology improve the performance of the system significantly. Results shows the better classification accuracy of the proposed method which helps in the early diagnosis and treatment of the disease. This method also provides the count of CB and non-CB which helps the doctor to decide the intensity of the disease for the further treatment. Further studies will be focused on the overlapped cell identification as CB and non-CB.
5. REFERENCES
[1] N.R. Griffin, M.R. Howard, P.Quirke, C. J. O’Brian, J.A., Child, C.C.Bird, Prognostic indicators in centroblastic centrocytic lymphoma, Journal of Clinical Pathology, 1988.
[2] Kamel Belkacem-Boussaid, Olcay Sertel, Gerard Lozanski,Arwa Shana’aah, Metin Gurcan, Extraction of color features in the spectral domain to recognize centroblasts in histopathology, International Conference of the IEEE EMBS, USA, September 2-6, 2009.
[3] Fabio scotti, automatic morphological analysis for acute leukemia identification in peripheral blood microscope images,IEEE international conference on computational intelligence for measurement systems and applications, CIMSA 2005.
[4] Chayadevi ML, Raju GT, Dataminig, classification and clustering with morphological features of microbes, International journal of computer applications IJCA, vol 52, aug 2012.
[5] Gonzalez, Woods, and Eddins, Digital Image Processing Using MATLAB 2nd Edition, 2009
[6] Riries rulaningtya, Adriyan B.Suksmono, Tati, Automatic classification of tuberculosis bacteria using neural network, International conference on Electrical Engg & Information, 2011.
[7] Basavaraj S. Anami, Suvarna S. Nandyal, A. Govardhan, A Combined Color, Texture and Edge Features Based Approach for Identification and Classification of Indian Medicinal Plants, International Journal of Computer Applications, Volume 6, September 2010.
[8] Ju Han 1, Kai-Kuang Ma, Rotation-invariant and scale-invariant Gabor features for texture image retrieval, Image and Vision Computing 25,Elsevier, 2006. [9] J. Mao, A. Jain, Texture classification and segmentation
using multiresolution simultaneous autoregressive models, Pattern Recognition 25, 1992.
[10] O. Sertel, J. Kong, G. Lozanski, U. Catalyurek, J. Saltz, M. N.Gurcan, “Computerized microscopic image analysis of follicular lymphoma”, SPIE Medical Imaging’08, San Diego, California, February, 2008. [11] O. Sertel, J. Kong, U. Catalyurek, G. Lozanski, A.