http://dx.doi.org/10.4236/ojee.2015.44006
Flat Panel Solar Thermoelectric System Size
Optimisation at Different Vacuum Levels
Kazuz Ramadan
College of Engineering Technology, Tripoli, Libya
Received 27 August 2015; accepted 21 November 2015; published 24 November 2015
Copyright © 2015 by author and Scientific Research Publishing Inc.
This work is licensed under the Creative Commons Attribution International License (CC BY). http://creativecommons.org/licenses/by/4.0/
Abstract
A systematic experimental investigation to understand the effect of heat loss and the thermoelec- tric aspect ratio (cross sectional area and length) on a flat plate solar thermoelectric system per-formance was carried out. The investigation involved a series of experiments on systems with 4 different sizes of thermoelectric generators, and it was tested in 5 different vacuum levels during the steady-state. The detailed experimental investigation provided a substantial amount of data, which revealed that the system performance of both heat and electricity power were improved when the heat lost was minimised. The system’s performance strongly depended on the aspect ra-tio of the thermoelectric generators. This finding might have a significant impact on the cost of the system by saving the user’s and the manufacturer’s time in examining different TEGs with differ-ent aspect ratios in order to get the optimum size optimisation of the hybrid system, as well as re-duce the manufacturing cost.
Keywords
Flat Roof Top Solar Collector, Hybrid Solar Thermoelectric System, The Optimal Heat and Electric Power, Seebeck Effect, Aspect Ratio, Vacuum Levels
1. Introduction
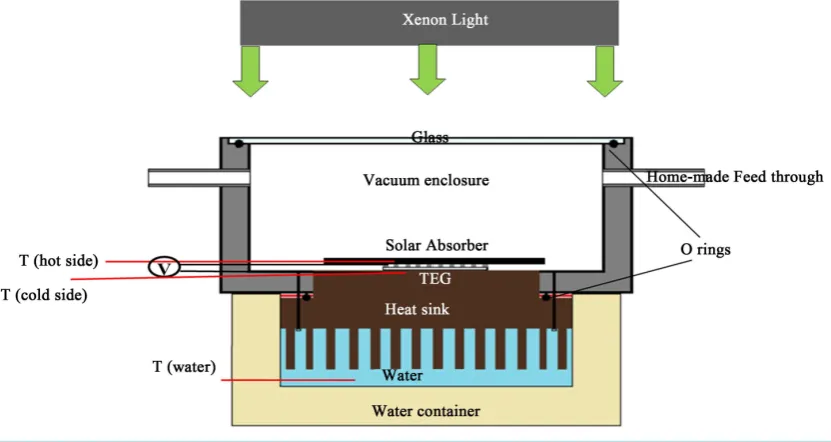
A flat panel solar thermoelectric system including a vacuum chamber was designed. The system consists of three major parts—a vacuum cavity, a heat sink and a water container. The solar absorber and the TEG are placed in an aluminium vacuum chamber, which is sealed from the top by special glass and from the bottom by a heat sink. The TEG is sandwiched between the solar absorber and the heat sink. In order to facilitate the mea-surement of temperatures, the back of the solar absorber and the top of the heat sink were grooved with channels in which two thermocouples were inserted for temperature measurements of the cold and hot sides of the TEG, respectively. To ensure good thermal contact, the solar absorber were pressed against the TEG and, in turn, against the heat sink by four plastic screws with the gaps filled with the heat sink compound (thermal paste).
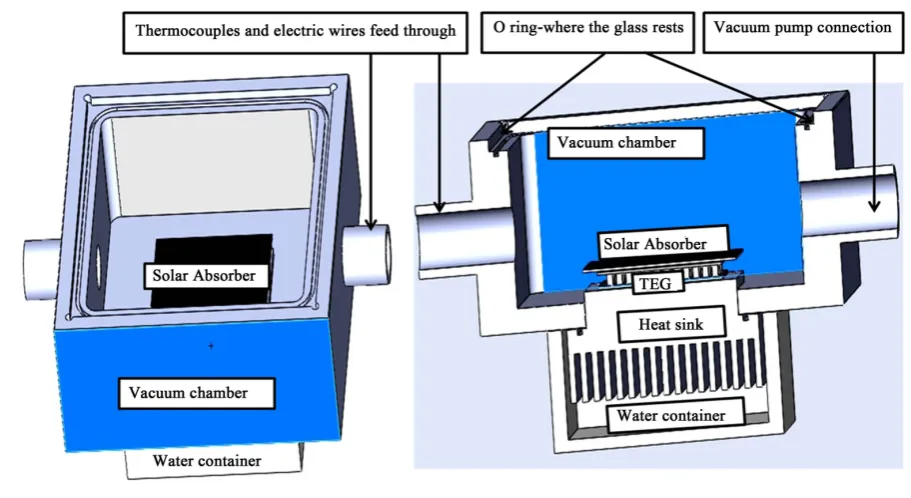
[image:2.595.106.522.488.709.2]As shown in Figure 1 andFigure 2, the assembly, consisting of the solar absorber, the TEG and the heat sink, which was inserted into the opening at the bottom of the aluminium vacuum chamber and was sealed with an O-ring that was placed on the edge of the heat sink and that was secured with four screws. As a result, the top parts of the assembly (including the solar absorber, the TEG and the heat sink) were kept in the vacuum enclo-sure, while the lower parts of the assembly (i.e. the heat sink fins) were outside the vacuum chamber, and were submerged in a thermally insulated water container. The top seal of the vacuum chamber is a piece of special glass measuring 170 mm × 170 mm × 5 mm. The glass seal allows light irradiation to enter the vacuum chamber and to shine onto the solar absorber. The light energy absorbed by the solar absorber is converted into thermal energy. It passes through the TEG and the heat sink into the water. The control of the vacuum level in the chamber leads to control of the heat losses. The experiments were performed in five different environmental conditions and levels. They are categorised as follows:
Figure 2. The cross section of the experimental kit.
Condition 1: The system without glass (an unglazed system), at atmospheric pressure. Condition 2: The system with glass cover (a glazed system), but at atmospheric pressure. Condition 3: A glazed system at a vacuum level of 2 × 10⁻¹ mbar.
Condition 4: A glazed system at a vacuum level of 8 × 10⁻² mbar. Condition 5: A glazed system at a vacuum level of 5 × 10⁻² mbar.
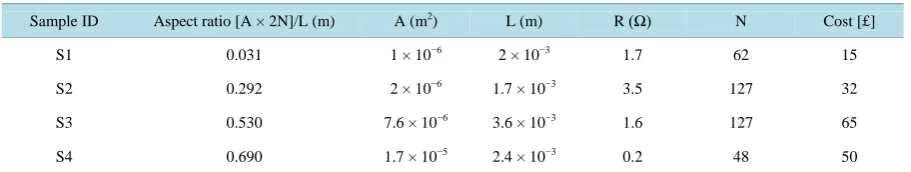
Four TEG devices with different sizes were also employed. The dimensions, aspect ratios and internal resis-tances of these devices are shown in Table 1.
3. Results
3.1. Determination of Thermal Power
Since the thermal and electrical power that are produced by the system depended directly on the temperature difference (∆T) across the TEG, the temperature differences (Th − Tc) of the TEGs were recorded from the
mo-ment when the light source was switched on until the period when the system reached the steady state. The measurement was repeated for each TEG under each of the 5 different vacuum conditions, and results are shown in Figure 3, which displays the temperature difference (∆T) of four different sizes of solar thermoelectric
sys-tem (TEG aspect ratios) as a function of operating the vacuum levels.
Figure 3 proves that increasing the vacuum levels enhances the TEG ∆T, resulted by minimising of the heat
loss, the smaller the TEG used in the system, the more significant the enhancement is. An increase of 25% was obtained in the system with the smallest TEG when the operating environment changed from Condition 2 (non-vacuum) to Condition 3 (low vacuum). The maximum increase in ∆T is 45%, which corresponds to the change of the operating environment from Condition 1 to Condition 5. The results show the clear dependence of the temperature difference on the operating environment. Increasing the vacuum level improves the ∆T. This ef-fect is more significant in a system with a smaller aspect ratio. This can be understood through the influence of the vacuum on the convective heat loss. With the knowledge of the ∆T that was obtained from the experiment for each system, the thermal power (QTEG) at the steady state can be calculated using the Fourier law of heat
conduction (Equation (1)), this was due to the fact that more than 70% of the heat transferred through the TEG device was caused by the conduction effect (Suter et al. 2011).
(
,) (
TEG h c)
TEGk A T T
Q
L
−
Figure 3. The temperature differences (∆T) across the 4 different TEGs’ aspect ratios at the steady state as a function of the
operating environments.
Table 1. The dimensions, aspect ratios, internal resistances and cost of the TEG devices that are employed in this experiment.
Sample ID Aspect ratio [A × 2N]/L (m) A (m2) L (m) R (Ω) N Cost [£]
S1 0.031 1 × 10⁻⁶ 2 × 10⁻³ 1.7 62 15
S2 0.292 2 × 10⁻⁶ 1.7 × 10⁻³ 3.5 127 32
S3 0.530 7.6 × 10⁻⁶ 3.6 × 10⁻³ 1.6 127 65
S4 0.690 1.7 × 10⁻⁵ 2.4 × 10⁻³ 0.2 48 50
where k is the thermal conductivity of the TEG materials with a value of 1.5 W∙m−1∙K−1.
The thermal powers that are transferred into the hot water through the TEG devices under the 5 operating conditions were calculated, and they are displayed as a function of the aspect ratio of the TEGs inFigure 4, and as a function of the vacuum level in Figure 5(using the same set of data). The dependence of the thermal power on the aspect ratio is evident. It can be seen that the thermal power at operation Condition 1 is ~2.5 W for the smallest TEG Sample (S1), with an aspect ratio of 0.031 meter, while it is ~17 W for the largest TEG Sample, with an aspect ratio of 0.68 metres, and the thermal power also increases with the increasing vacuum level. However, the increase caused by increasing the vacuum level is limited if compared with the amount of increase that can be achieved by changing the aspect ratio.
3.2. Determination of the Electrical Power Output
The open circuit voltages from the output terminals of the TEGs were recorded as a function of time, from the moment when the light source was switched on until the period when the system reached the steady state. With knowledge of the internal resistances of the TEGs, the electrical powers generated by the TEGs were calculated using the following equation, which was cited in the literature [4].
2
4 TEG V P
R
= (2)
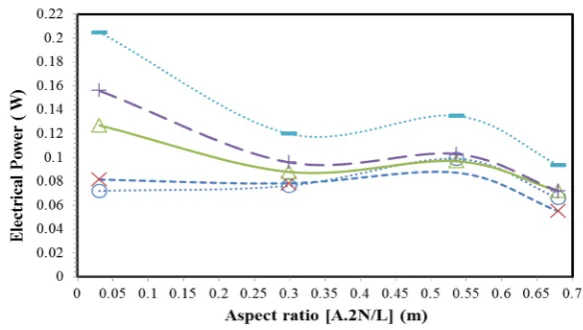
And the results were displayed as a function of time, as shown in Figure 6 and Figure 7.
[image:4.595.87.543.324.410.2]Figure 4.Thermal power transferred into hot water through the TEG devices at the steady state as a function of the TEG aspect ratio.
Figure 5. Thermal power transferred into the hot water through the TEG devices at the steady state as a function of vacuum levels.
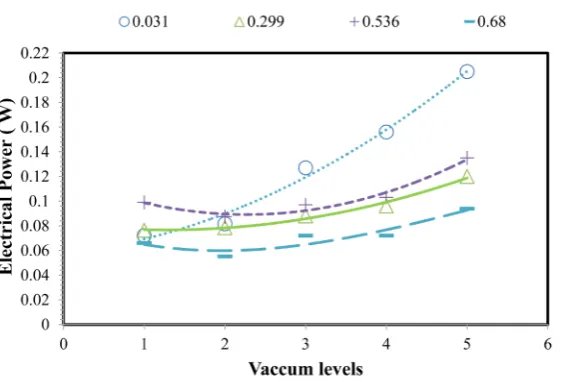
[image:5.595.164.456.531.696.2]Figure 7. The electrical power as a function of the vacuum levels operating for 5 different TEGs.
stantial—an increase by 64% from operation in Conditions 1 to 5, while the improvement is much less in the TEGs that have large aspect ratios. The optimal aspect ratio to obtain the maximum electrical power output is also affected by the environment conditions that are operating. This result clearly demonstrates that selecting a TEG with an appropriate aspect ratio is crucial in order to obtain the best available power output for a given en-vironmental operating condition. It brings significant benefits both to improving the maximum electrical power output (0.1 W to 0.2 W) and to reducing the manufacturing costs, by saving material when using the small as-pect ratio (0.031 metres) instead of the larger one (0.536) (the TEG material costs can be reduced to almost a 17 times of the original cost). The significant increase in the electrical power output of the TEG with the smallest aspect ratio is due to the fact that the temperature difference across the TEG increased significantly when the heat loss from the system was reduced through the use of a vacuum.
3.3. Determining the Optimal TEG Aspect Ratio for Maximum Electrical Power
As the results obtained in Figure 4 and Figure 6indicate, the aspect ratio required to obtain the maximum thermal power output is different from that required for the electrical power output. Changing the vacuum level can have significant impact on determining the optimal TEG size optimization (aspect ratio) as clearly shown in Figure 5
and Figure 7. In general, the system with a large TEG size optimization works more efficiently when the heating application is required. On the other hand, the system with a small TEG size optimization and a high vacuum level is more efficient if the electric applications are needed more. Based on the results obtained from this investigation, the system with a small aspect ratio at a higher vacuum level provides the highest electrical power and therefore a detailed investigation of this system was carried out. Previous study [5] that enabled to estimate the optimal TEG size was employed; this was in order to achieve the optimum electrical power output from the system.
As the method mainly dependent on determines the temperature different cross the TEG (∆T) at the steady state condition. ∆T has been estimated by using the parameters of the smallest TEG size, where the TEG area [(A) × (2N)] value was [(1 × 10⁻³ m2) × (2 × 31)] and the input heat power value was (23 W). As the ∆T was obtained, then the maximum electrical power can be calculated based on the following equation [4].
(
)
(
)
2 2 2 2 2 1N A T
P rLc n L L α ρ ∆ = + + (3)
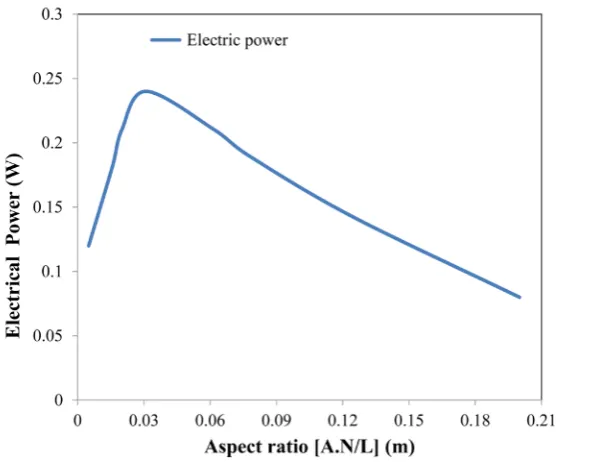
tem-perature difference was established and, consequently, the electrical power was estimated. The results are shown in Figure 8, below. To determine the optimal TEG size optimization (the ratio of area to length-A/L) for achieving the maximum electrical power output, the theoretical model previously [5] developed was employed.
Figure 8shows the estimated electrical power of the system based on the parameters of the smallest TEG size when operating at higher level of vacuum (level 5 and assuming the heat loss = 0), at TEG size optimization (aspect ratio). Results of comparing the value of the electric power obtained using the calculation method [5] to the value obtained showed good agreement, the calculation results was 10% higher than the measured results. The optimal aspect ratio for the 2 N of the TEG which can achieve the maximum electrical power can be deter-mined from Figure 8. Figure 9 demonstrates the optimum design of single element (leg) of 2 N when the sys-tem under condition 5 (vacuum of 5 × 10⁻² mbar) gives the single element dimension of 1 mm × 1 mm × 2 mm as the optimum design.
4. Conclusion
In this study, the experimental results investigated the optimum thermoelectric generator aspect ratio, which could be added to solar thermal system based on flat panel in order to achieve the optimum heat and electrical power production from hybrid solar thermoelectric system based on a flat panel under different vacuum levels, as well as the influence of the heat lost on the system’s performance. The results showed that the system performance of both
[image:7.595.255.373.570.697.2]Figure 8. The estimated electrical power as a function of the TEG aspect ratio.
I would like to thank Dr. Gao Min, Dr. John Bomphrey and all of the team member’s of the mechanical work-shop at Cardiff school of engineering for their advices and assistance.
References
[1] Kiziroglou, M., Samson, D., Becker, T., Wright, S.W. and Yeatman, E.M. (2011) Optimization of Heat Flow for Phase Change Thermoelectric Harvesters. Power MEMS 2011, Seoul, 15-18 November 2011.
https://workspace.imperial.ac.uk/opticalandsemidev/Public/Publications/11_PowerMEMS_Paper_final_withnote.pdf
[2] Edgar, A., Urbiola, C. and Vorobiev, Y. (2013) Investigation of Solar Hybrid Electric/Thermal System with Radiation Concentrator and Thermoelectric Generator. International Journal of Photo Energy, 2013, Article ID: 704087. [3] Daniel, K., Poudel, B., Feng, H.-P., Christopher Caylor, J., Yu, B., Yan, X., Ma, Y., Wang, X.W., Wang, D.Z., Muto,
A., McEnaney, K., Chiesa, M., Ren, Z.F. and Chen, G. (2011) High Performance Flat Panel Solar Thermoelectric Ge- nerators with High Thermal Concentration. Nature Materials, 10, 532-538.
http://www.nature.com/nmat/journal/v10/n7/full/nmat3013.html http://dx.doi.org/10.1038/nmat3013
[4] Ramadan, K. (2015) The Optimal Flat Panel Solar Thermoelectric Geometries for Heat and Electric Power Production.
European Scientific Journal, 11, 1857-7881.