Virus Detection using Artificial Neural Networks
Shivani Shah
1 Dwarkadas J. Sanghvi College of Engineering Mumbai, Maharashtra,India
Himali Jani
1 Dwarkadas J. Sanghvi College of Engineering Mumbai, Maharashtra,India
Sathvik Shetty
1Dwarkadas J. Sanghvi
College of Engineering Mumbai, Maharashtra,
India
Kiran Bhowmick
1 Dwarkadas J. Sanghvi College of Engineering Mumbai, Maharashtra,India
ABSTRACT
A virus is defined as a program that spreads or replicates by copying itself, and generally has malicious effects. The antivirus systems used today mainly detect malware on the basis of known virus patterns, making detection of a new virus very difficult. This deficiency can be overcome by training an artificial neural network with the inputs from Portable Executable (PE) Structure of executable files, as they learn from the training data and will be able to identify unknown virus patterns. PE Structure contains various fields by which one can identify virus infected executable files from the legitimate ones without executing them, and Fisher Score can be used to select the most relevant features (fields) to speed up the analysis. A new technique of identifying virus infected files by using Fisher Score and applying them as input to the neural network is proposed.
General Terms
Virus, Program, Patterns, Executable files
Keywords
PE Structure, Feature, Fisher Score, Artificial Neural Network
1.
INTRODUCTION
Nowadays modern society faces the increased problem of information security from virus infected files. These files can severely affect applications in the system as well as intrude the system files, which consequently can lead to entire breakdown of a computer system. There are several ways for identifying such malware:
1. Comparing the software with known virus definition files to find matching patterns. It uses existing virus files to look for patterns using which virus definition files are created. New files are compared with virus definition files to find out if they are malicious.
2. Monitoring behavior of executable files in the system to find any abnormal activities performed by them (Example: Writing to system files etc.). Executable files can perform malicious activities only if they are executed by a user. Usually these files try to get access to unauthorized areas in computers or try to write to system files. Hence one can look for these activities and warn the user about the presence of a virus.
3. Executing suspected files in a virtual environment to look for suspicious activities. It creates a virtual environment in which it runs these files to check if they are malicious.
1.1
ISSUES IN EXISTING SYSTEM
As discussed, there are several methods for identification of malicious software. But there are some issues in these approaches: In the first method i.e. comparing the software with virus definition files, it is difficult to detect new viruses as it is unaware about patterns in a new virus.
In the second method i.e. looking for abnormal activities performed by executable files, it is inefficient because by the time one finds out that it is a malicious software, it is too late as it has already started executing and it is difficult to stop a virus after it has begun its execution in computer.
In the third method one needs to create a virtual environment and run suspicious files in it which, although effective, is time consuming and costly.
1.2
PROPOSED SOLUTION
This paper utilizes the advantages of neural networks to create a system which is self-learning. This system works in an adaptive environment taking various inputs of a file to determine whether it is a legitimate or malicious file.
The inputs considered for the neural network training are the various fields of Portable Executable structure (PE structure). Various PE header attributes are collected and provided as input to train the neural network. The fields of the PE header give a lot of information about the code inside the .exe file. The significant advantage of using this technique is that all the required information about the file is obtained without actually executing it. Thus the risk of getting the system infected by executing a virus infected file is eliminated. The important fields of PE structure in virus detection are discussed in the next section.
The PE header contains numerous fields. Making use of all the fields would make the system very time consuming and tedious. Also, there are some fields which do not give any distinguishing information for differentiating a legitimate file from a virus infected one. Thus to improve speed of the system, feature selection is performed. Feature selection involves implementation of algorithms which can find those features or attributes which will give the best distinguishing factors for the system.
2.
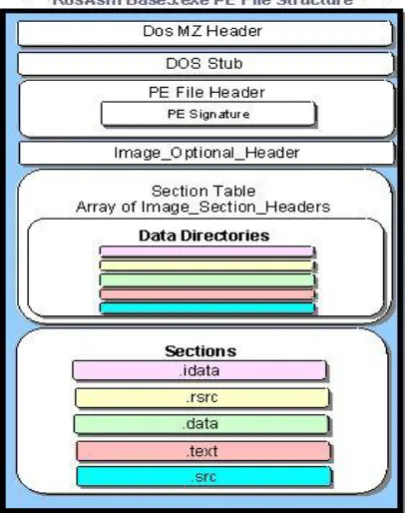
PORTABLE EXECUTABLE
STRUCTURE
Figure 1: PE Structure
2.1
PE HEADER
The first important part of the PE format is the PE header. The PE file has a header area with a collection of fields at an easy to find location. The PE header describes vital pieces of the portable executable image. The following list entails important fields of the image file header:
WORD Machine
WORD NumberOfSections WORD Characteristics WORD Magic DWORD SizeOfCode
DWORD AddressOfEntryPoint DWORD ImageBase
DWORD SectionAlignment DWORD FileAlignment DWORD SizeOfImage DWORD Checksum
2.2
PE FIELDS
There are various fields in the PE structure which can be used as features for distinguishing legitimate and virus infected files. Following is the list of fields used as features:
DOS Checksum
Number Of Sections
Time Stamp
Number Of Symbols
Size Of Code
Size Of Initialized Data Section
Size Of Uninitialized Data Section
Major OS Version
Minor OS Version
Major Image Version
Minor Image Version
Major Subsystem Version
Minor Subsystem Version
Entry Point
Image File Checksum
Size Of Exports
Size Of Imports
Size Of Resources
Size Of Exceptions
Size Of Attribute Certificate Table
Major Linker Version
Minor Linker Version
DLL Characteristics
3.
FEATURE SELECTION
A feature refers to an aspect of the data. There are 3 kinds of features namely [25]
1. Relevant: These features are influential in determining the output.
2. Irrelevant: These features are not influential in determining the output.
3. Redundant: These features need not be considered due to them being very similar to another feature, in terms of their influence on the output.
Thus, when considering a subset of features, the most relevant features must be chosen, as they are the most effective ones, having maximum impact on the output. In machine learning, the network is trained by considering a subset of features as input to the learning algorithm. This is mainly due to the fact that all the features aren’t useful or relevant. Feature selection is the process of selecting the subset of best features among all features.[16] Identifying the most relevant feature helps in reducing classification error.
The main uses of feature selection are
It is very useful in data mining [16] and machine learning.
It is used in the categorization or classification of patterns.
It is used to avoid the curse of dimensionality.[23] Feature selection has the following advantages [25]
It improves speed of data analysis.
It reduces space required as irrelevant and redundant features are ignored.
It improves accuracy of the result.
It removes irrelevant and redundant data.
3.1
FEATURE SELECTION
ALGORITHMS
The following are some of the feature selection algorithms used:
3.1.1
CHI Square
The disadvantages associated with CHI Square technique are
It behaves haphazardly for minute expected counts, due to lack of positive examples.
Text Classification Problem.[13]
It cannot find out if dependency between feature and class is negative or positive. This results in wrongly selecting irrelevant or ignoring relevant features.
X
2=
3.1.2
Information Gain
Information Gain, as the term suggests, is the amount of information gained by considering a particular feature. It measures the decrease in entropy when a feature is taken into account [25]. Lesser the entropy, lesser is the randomness, more is the information. It is defined as the difference between original uncertainty, or entropy, and expected posterior entropy after considering the feature. The higher the Information Gain, greater is the decrease in entropy, greater is the information obtained, so more relevant is the feature. The lower the Information Gain, lesser is the decrease in entropy, lesser is the information obtained, so more irrelevant is the feature. The main disadvantage of Information Gain technique is that it gives high rank to those attributes with large number of values. [1]
IG(A)=Entropy(Original)-Entropy(A)
3.1.3
Gain Ratio
Gain Ratio technique is primarily based on Information Gain method [1]. It overcomes the shortcomings of Information Gain technique by normalizing the score of a feature’s contribution. The result of this is that the value of Gain Ratio will always fall in the range of [0, 1]. [15]
SplitInfo is defined as the probable information gained by partitioning training set D into v partitions, leading to v outcomes on a feature, say A. High SplitInfo implies that the partitions are more or less uniform. Low SplitInfo implies that the partitions are uneven in size. [14]
3.1.4
T-Test
The T-Test method involves comparison between groups. It measures if 2 groups are statistically different from each other. [25] T is defined as the ratio between difference between the mean of 2 groups and dispersion of the scores. Higher the value of T, more is the difference between the 2 groups. Lower the value of T, lesser is the difference between the 2 groups.[25]
However, T-Test has some disadvantages. T-test is based on some assumptions:
The populations should be normally distributed. But if scores are not normally distributed then this algorithm would not be effective.
All the population must have same variance. If you have widely different N in each group then this algorithm would not work properly.
The T-Test for independent means only examines means; it has virtually nothing to say about individual scores. It is important to keep track of the fact that the conclusions are about means, not about individuals.
3.1.5
Fisher Score
Fisher Score technique is one of the most important methods of features selection. The basic idea of Fisher Score is to find a subset of features of the data such that in the data space spanned by selected features, distance between data points in different classes are as large as possible and distance between data points in the same class are as small as possible[1]. Fisher score computes the difference, in terms of mean and standard deviation, between positive and negative examples relative to a particular feature. It assigns ranks to each feature. Rank of a feature is defined as the ratio between absolute difference between the means of positive and negative examples and the sum of the standard deviations of the positive and negative examples, when considering that feature. [1] A large value of a rank implies greater difference in positive and negative examples, considering that feature, hence is more important for separating positive and negative values. Thus, this feature is relevant. A small value of rank would imply a lesser difference in positive and negative examples, hence is less important for separating positive and negative values. Thus, this feature is irrelevant.
=
4.
NEURAL NETWORK
Taking inspiration from biological neural networks, Artificial Neural Networks was introduced which solved many real world problems. The advantage of using neural networks is that it learns through the training data, updates its weights and gives accurate results. For problems which require training and learning, neural networks is the most feasible solution.
A neural network has two or more layers. First is the input layer which takes the inputs. Then there are hidden layers. The number of hidden layers can vary. The more the number of hidden layers the more accurate the results would be. But having more hidden layers can increase computational time. The last layer is the output layer which gives the output.
There are two types of learning algorithms for neural networks:
Supervised learning algorithm: In supervised algorithms, the classes are predetermined. These classes can be conceived of as a finite set, previously arrived at by a human. In practice, a certain segment of data will be labeled with these classifications. The machine learner's task is to search for patterns and construct mathematical models. These models are then evaluated on the basis of their predictive capacity in relation to measures of variance in the data itself. Decision tree induction, Naive Bayes etc. are examples of supervised learning techniques.
Unsupervised learning algorithm: Unsupervised learners are not provided with classifications. In fact, the basic task of unsupervised learning is to develop classification labels automatically. Unsupervised algorithms seek out similarity between pieces of data in order to determine whether they can be characterized as forming a group. These groups are termed as clusters, and there is a whole family of clustering machine learning techniques. In short, unsupervised learning algorithms have no human intervention.
In finding unknown malwares, no prior knowledge of which data belongs to which group is known. Hence unsupervised learning is the best solution to the problem. This paper uses Kohonen’s Self-Organizing Map for the problem.
Self-Organizing Map (SOM): The Self-Organizing Map is one of the most popular neural network models. It belongs to the category of competitive learning networks. The SOM is based on unsupervised learning, which means that no human intervention is needed during the learning and that little needs
to be known about the characteristics of the input data. One could, for example, use the SOM for clustering data without knowledge of the class memberships of the input. The SOM can be used to detect features inherent to the problem and thus has also been called SOFM, the Self-Organizing Feature Map. It takes input data and it finds the similarity in data and accordingly creates a group. Since for the problem of finding unknown malwares one does not have prior knowledge, SOM as an unsupervised learning algorithm is used.
5.
SYSTEM IMPLEMENTATION
The system implementation is carried out in 2 phases. The first phase performs the feature selection procedure by taking input from the files which make up the training data. Phase 2 performs the training of the neural network and then classifies a file as either legitimate or virus infected.
5.1
PHASE 1
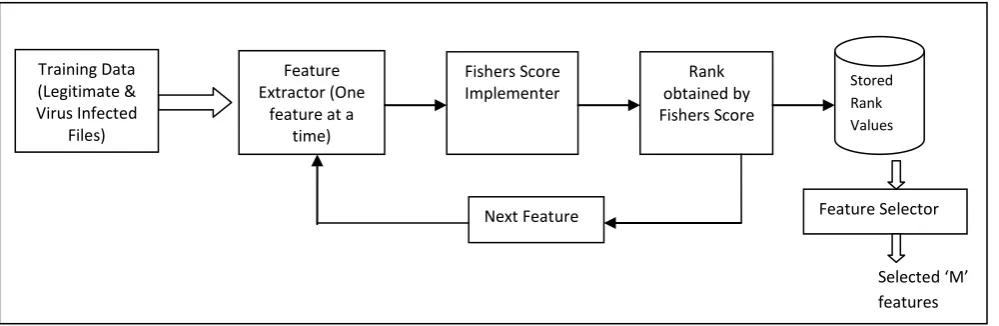
In Phase 1, the Training Data, which comprises of two types of executable files-legitimate and virus infected, is given as input to the Feature Extractor. The Feature Extractor takes a one feature (PE Structure field) at a time from all files present in the Training Data, and sends it to the Fisher Score Implementer. This in turn evaluates the most optimum or relevant features, using Fisher Score technique. It assigns a rank to each feature which will be stored in the Database. Finally, the Feature Selector selects the ‘M’ most relevant features based on their rank. It then provides them as input to Phase 2.
[image:4.595.55.555.408.571.2]
Figure 2: Phase 1-Feature Selection
Selected ‘M’ features (Input to Phase 2) Feature
Extractor (One feature at a
time)
Fishers Score Implementer
Rank obtained by Fishers Score
Next Feature
Stored Rank Values
Feature Selector Training Data
(Legitimate & Virus Infected
Figure 3: Phase 2-Training and Classification of .exe file
5.2
PHASE 2
The Input from Phase 1, which comprises of the ‘M’ most relevant features, is given as input to the neural network. Using these features, the neural network trains itself, and then whenever a file is given as input, it will classify it as either a legitimate or a virus infected file.
6.
ANALYSIS
[image:5.595.43.552.415.576.2]To analyze which features are most appropriate for distinguishing malicious and legitimate files, Fisher Score feature selection algorithm is applied on ten features from PE structure. PE structure can be viewed using PE parser. Twenty files have been taken for the experiment, ten legitimate and ten virus infected files. Following are the data used while applying Fisher score, Table 1 and 2 contains PE values of legitimate files and Table 3 and 4 contains PE values of virus files:
Table 1. Feature values from PE structure of five legitimate files
Features File 1 File 2 File 3 File 4 File 5
MajorLinkerVersion 2 8 2 2 10
MinorLinkerVersion 22 0 25 56 0
SizeOfInitializedData 472576 745472 18608128 107008 79872
SizeOfUninitializedData 19456 0 0 3584 0
MajorOSVersion 4 4 5 4 5
MinorOSVersion 0 0 0 0 2
MajorImageVersion 1 1 0 1 0
MinorImageVersion 0 0 0 0 0
Checksum 695126 0 19630716 141070 225362
DLLCharacteristics 0 0 33088 320 33088
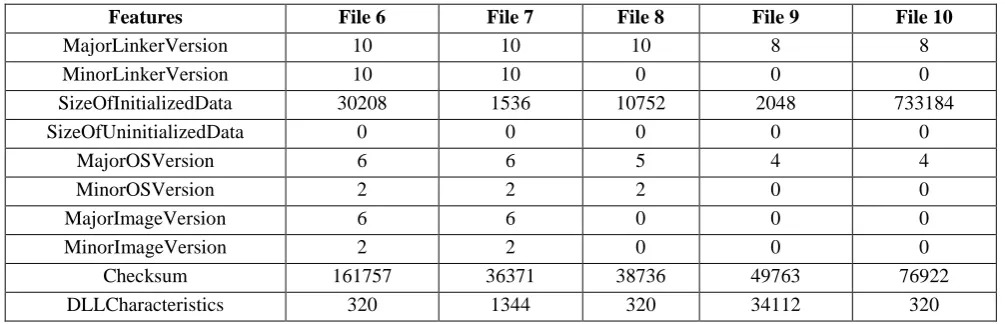
Table 2. Feature values from PE structure of five legitimate files
Features File 6 File 7 File 8 File 9 File 10
MajorLinkerVersion 10 10 10 8 8
MinorLinkerVersion 10 10 0 0 0
SizeOfInitializedData 30208 1536 10752 2048 733184
SizeOfUninitializedData 0 0 0 0 0
MajorOSVersion 6 6 5 4 4
MinorOSVersion 2 2 2 0 0
MajorImageVersion 6 6 0 0 0
MinorImageVersion 2 2 0 0 0
Checksum 161757 36371 38736 49763 76922
DLLCharacteristics 320 1344 320 34112 320
Input Layer Hidden Layer
Neural Network
Output
Input from Phase 1
1
2
M
Legitimate
[image:5.595.46.549.607.769.2]Table 3. Feature values from PE structure of five virus infected files
Features File 1 File 2 File 3 File 4 File 5
MajorLinkerVersion 5 6 3 2 7
MinorLinkerVersion 2 0 0 25 10
SizeOfInitializedData 64000 121344 4608 944640 65536
SizeOfUninitializedData 0 1024 0 0 0
MajorOSVersion 4 4 4 4 4
MinorOSVersion 0 0 0 0 0
MajorImageVersion 0 0 0 0 0
MinorImageVersion 0 0 0 0 0
Checksum 0 0 0 0 0
[image:6.595.43.549.297.458.2]DLLCharacteristics 0 0 0 0 0
Table 4. Feature values from PE structure of five virus infected files
Features File 6 File 7 File 8 File 9 File 10
MajorLinkerVersion 2 5 8 2 6
MinorLinkerVersion 25 0 0 25 0
SizeOfInitializedData 12288 95232 135168 61440 212992
SizeOfUninitializedData 274432 0 0 651264 0
MajorOSVersion 1 4 4 4 4
MinorOSVersion 0 0 0 0 0
MajorImageVersion 0 0 0 0 0
MinorImageVersion 0 0 0 0 0
Checksum 0 0 716819 0 0
DLLCharacteristics 0 0 0 0 0
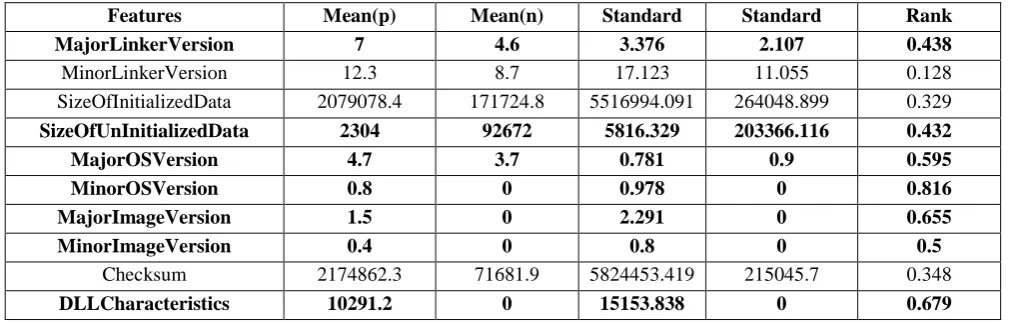
Table 5. Fishers score results (p: positive examples n: negative examples)
Features Mean(p) Mean(n) Standard
Deviation(p )
Standard Deviation(n)
Rank
MajorLinkerVersion 7 4.6 3.376 2.107 0.438
MinorLinkerVersion 12.3 8.7 17.123 11.055 0.128
SizeOfInitializedData 2079078.4 171724.8 5516994.091 264048.899 0.329
SizeOfUnInitializedData 2304 92672 5816.329 203366.116 0.432
MajorOSVersion 4.7 3.7 0.781 0.9 0.595
MinorOSVersion 0.8 0 0.978 0 0.816
MajorImageVersion 1.5 0 2.291 0 0.655
MinorImageVersion 0.4 0 0.8 0 0.5
Checksum 2174862.3 71681.9 5824453.419 215045.7 0.348
DLLCharacteristics 10291.2 0 15153.838 0 0.679
After finding out the values of the features of the twenty files, mean and standard deviation is calculated and then Fisher Score algorithm is applied to find out the rank of each feature.
According to the rank, seven features with top ranks were selected. Features selected are shown in bold in the table. Table 5 contains the rank of each feature.
Hence, Fisher Score is very useful in finding out the most relevant and effective features. These features would then be applied to the neural network.
7.
CONCLUSION
[image:6.595.46.554.499.660.2]fields) were found out which can be given as inputs to the neural network. Inputs are the most important part of neural networks as choosing efficient inputs gives accurate results.
Hence, the seven most relevant features are chosen by applying Fisher Score algorithm on data from PE structure. By training the neural network with a variety of files one can identify whether a file is legitimate or virus infected. The significant advantage which one gets by using this technique is that execution of a file is not required. Hence, this system can overcome the drawbacks of the classical anti-virus softwares which rely on traditional virus definition files.
8.
REFERENCES
[1] DimaStopel, ZviBoger, Robert Moskovitch, Yuval Shahar and Yuval Elovici, “Improving Worm Detection with Artificial Neural Networks through Feature Selection and Temporal Analysis Techniques”.
[2] Hassan Khan, FauzanMirza and Syed Ali Khayam, “Determining malicious executable distinguishing attributes and low-complexity detection”, J ComputVirol DOI 10.1007/s11416-010-0140-6.
[3] AltyebAltaher, SureswaranRamadass and Ammar Ali, “Computer Virus Detection Using Features Ranking and Machine Learning”, Australian Journal of Basic and Applied Sciences, 5(9): 1482-1486, 2011: ISSN 1991-8178.
[4] QuanquanGu, Zhenhui Li, Jiawei Han, “Generalized Fisher Score for Feature Selection”.
[5] Xiaofei He, Deng Cai, ParthaNiyogi, “Laplacian Score for Feature Selection”.
[6] Zheng Zhao, Lei Wang, Huan Liu, and Jieping Ye, “On Similarity Preserving Feature Selection”, IEEE TRANSACTIONS ON KNOWLEDGE AND DATA ENGINEERING.
[7] Daoqiang Zhang1, Songcan Chen1 and Zhi-Hua Zhou2, “Constraint Score: A New Filter Method for Feature Selection with Pairwise Constraints”.
[8] Koji Tsuda, Motoaki Kawanabe and Klaus-RobertMuller, “Clustering with the Fisher Score”.
[9] B.Azhagusundari, Antony SelvadossThanamani, “Feature Selection based on Information Gain”, International Journal of Innovative Technology and Exploring Engineering (IJITEE), ISSN: 2278-3075, Volume-2, Issue-2, January 2013.
[10]RahmanMukras, NirmalieWiratunga, Robert Lothian, SutanuChakraborti, and David Harper, “Information Gain Feature Selection for Ordinal Text Classification using Probability Re-distribution”.
[11]ZhaohuiZheng, Xiaoyun Wu, RohiniSrihari, “Feature Selection for Text Categorization on Imbalanced Data”.
[12]Phayung Meesad1, Pudsadee Boonrawd2 and Vatinee Nuipian2,3, “A Chi-Square-Test for Word Importance
Differentiation in Text Classification”, 2011 International Conference on Information and Electronics Engineering IPCSIT vol.6 (2011) © (2011) IACSIT Press, Singapore.
[13]George Forman, “An Extensive Empirical Study of Feature Selection Metrics for Text Classification”, Journal of Machine Learning Research 3 (2003) 1289-1305 ;Submitted 5/02; Published 3/03.
[14]Anuj Sharma, ShubhamoyDey, “Performance Investigation of Feature Selection Methods and Sentiment Lexicons for Sentiment Analysis”, Special Issue of International Journal of Computer Applications (0975 – 8887) on Advanced Computing and Communication Technologies for HPC Applications - ACCTHPCA, June 2012.
[15]TodorGanchev, PanagiotisZervas, Nikos Fakotakis, George Kokkinakis, “Benchmarking Feature Selection Techniques on the Speaker Verification Task”.
[16]Huan Liu and Lei Yu, “Toward Integrating Feature Selection Algorithms for Classification and Clustering”, IEEE TRANSACTIONS ON KNOWLEDGE AND DATA ENGINEERING, VOL. 17, NO. 4, APRIL 2005.
[17]Eric Filiol, “Malware pattern scanning schemes secure against black-box analysis”, Springer-Verlag France 2006.
[18]Yanfang Ye , Dingding Wang , Tao Li , Dongyi Ye, Qingshan Jiang, “An intelligent PE-malware detection system based on association mining, ” Springer-Verlag France 2008.
[19]Zheng Zhao, Fred Morstatter, Shashvata Sharma, Salem Alelyani, AneethAnand, Huan Liu, “Advancing Feature Selection Research- ASU Feature Selection Repository”.
[20]Yibin Liao, “PE-Header-Based Malware Study and Detection”.
[21]Isabelle Guyon, Andr´eElisseeff, “ An Introduction to Variable and Feature Selection”, Journal of Machine Learning Research 3 (2003) 1157-1182.
[22]Joel Yonts, “Attributes of Malicious Files”, SANS Institute InfoSec Reading Room.
[23]Lei Yu, Huan Liu, “Efficient Feature Selection via Analysis of Relevance and Redundancy”, Journal of Machine Learning Research 5 (2004) 1205–1224, Submitted 1/04; Revised 5/04; Published 10/04.
[24]Jianqing Fan, Richard Samworth, Yichao Wu, “Ultrahigh Dimensional Feature Selection: Beyond The Linear Model”, Journal of Machine Learning Research 10 (2009) 2013-2038, Submitted 12/08; Revised 5/09; Published 9/09.