Bacterial Foraging Algorithm for Reliability Performance
of Radial Distribution System with DG
E.R Biju
Assistant Professor Department of EEE Annamalai University
Tamilnadu, India
M. Anitha
Associate Professor Department of EEE Annamalai University
Tamilnadu, India
ABSTRACT
Assessment of customer power supply reliability is an important part of distribution system operation and planning. Distribution system reliability assessment is able to predict the interruption profile of a distribution system based on system topology and component reliability data. In this paper, a methodology has been developed for reliability enhancement of radial distribution system having distributed generation (DG). DG is being adopted in distribution networks with one of the objectives being enhancement of system reliability. By determining the optimum values of failure rates/repair times, reliability of the distribution system has been optimized subjected to constraints on customer and energy based indices i.e. SAIFI, SAIDI, CAIDI, AENS, and ASAI. The objective function includes (i) cost of modification for failure rates/repair times (ii) additional cost of expected energy supplied by DG. A recently developed Bacterial foraging algorithm (BFA) is employed to solve the optimization problem. The proposed algorithm has been implemented on an eight node distribution network. The obtained results are compared with PSO, CAPSO and DE algorithms.
Keywords
Distributed generation, bacterial foraging algorithm, reliability indices, radial distribution network.
NOMENCLATURE
λs : total failure rate up to load point from source, rs : average
interruption duration from source, λdg : failure rate of DG, rdg :
average outage duration of DG, : Failure rate of kth section,
: average repair time of kth section, and are the cost coefficients, EENSO: expected energy not supplied without DG, EENSD: expected energy not supplied with DG, ADCOST: additional cost per KWh, Li: average load connected
at ith load point, λsys,i : system failure rate at ith load point, Ni :
number of customers at load point i, Usys,i : average annual
outage duration at ith load point, S: set of distribution segments in series upto kth load point, λsw : failure rate of manual switch,
s: service restoration time from DG.
1.
INTRODUCTION
It is of great significance to evaluate reliability of individual customer service which can significantly affect the design and operating characteristics of power systems, especially distribution systems. The majority of distribution systems are designed to operate with a radial topology. Radial distribution systems have many series components between a substation and a load point. A failure of any component in the series path results in the outage of a load point. Analysis of customer failure statistics indicates that distribution systems make a significant individual contribution to overall customer supply
unavailability. Approximately 80% of all customer interruptions occur due to failures in the distribution system [1]. Nowadays distributed generation is the best way to be used in the distribution system, to improve the reliability of the system [2]. Due to the problems associated with the establishment of new transmission lines, environmental pollution and due to restructuring and competition in power systems have increased the deployment of DGs to improve the reliability of the distribution systems. Other potential benefits of DGs are: power loss reduction, voltage support, ancillary services support etc. In distribution systems, DG can provide benefits for the consumers as well as for the utilities, especially in sites where the central generation is impracticable or where there are deficiencies in the transmission system. Generally DGs are installed in strategic points of the electric power system and mainly close to load centers. Though the use of DG has many benefits, it involves high capital cost to the system. The time necessary to start up the DG should also be taken into account for the reliability evaluation of distribution system. If this time is sufficiently short, the customers suffer a momentary interruption, while, if not, they suffer a sustained interruption. Distribution system reliability performance is optimized with respect to failure rate and repair time allocation to each distribution segment. Failure rate and average repair time are reduced by intensifying fault avoidance and corrective repair measures. In the literature, many researchers have attempted the optimization of distribution system reliability performance using various algorithms such as gradient projection method, primal dual interior point algorithm, value based approach, modified genetic algorithm [3 - 8]. In-Su et al [9] described an analytical method to determine the reliability of a distribution system with DG. They considered three modes of operations of DG such as stand by unit, peaking unit and mixed mode operation. Gozel et al [10] determined optimal allocation and sizing of DGs using an analytical method (in view of minimum) line loss. Singh and Varma [11] proposed multi-objective optimization for DG allocation including load models. The case studies were presented to assess the impact of type of loads on DG allocation. Reza Baghipour et al [12] proposed binary particle swarm optimization algorithm to determine the optimum placement and sizing of distributed generation and capacitor banks. They considered an objective function which includes reliability improvement, loss reduction and voltage profile improvement.
customers and average load at various load points are not included in these indices [2]. Conventional reliability analysis is normally concerned only with evaluating the expected or average value of a particular index. Despite the considerable growth in the field of distribution system reliability assessment, service continuity indices continue to be measured almost exclusively by average indices. In order to reflect severity of an outage, customer oriented and energy based indices have to be evaluated. Most frequently used indices by utilities are SAIFI, SAIDI, CAIDI, AENS and ASAI [2].
This paper presents a methodology to find out the optimal solution of failure rate and repair time of each segment of a radial distribution system with DG by using BFA. An eight node radial distribution system is considered as test system for the purpose of illustration. Results were obtained by the proposed algorithm for customer and energy based load point indices with and without DG. An objective function which reflects cost of modification of failure rates, repair time and cost of energy supplied from DG has been constructed and minimized subject to reliability constraints. The proposed algorithm has been compared with other three optimization techniques, namely DE, PSO and CAPSO.
2. PROBLEM FORMULATION
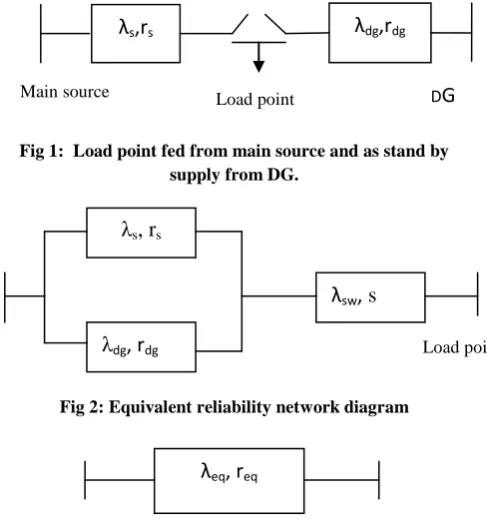
[image:2.595.52.296.426.687.2]Distributed generation may be used as standby units for reliability improvement at specific load points. At any event failure should be occur in distribution system causing loss of supply from the main source substation. At that time customers are supplied from alternate source (i,e) DG connected at that load point. If DG capacity is sufficient to meet the load at a load point in the event of failure of supply from substation then the situation at load point is represent as shown in Fig. 1.
Fig 1: Load point fed from main source and as stand by supply from DG.
Fig 2: Equivalent reliability network diagram
Fig 3: A single component equivalent of reliability network The load may be shifted to DG in the event of failure from source side by controlling manual switching. The average time to carry out the switching operation is assessed as ‘s’ hours. The equivalent reliability diagram for the system is shown in Fig. 2 in which source side, and DG are directly connected in
parallel but placed in series with important switching element with λsw and ‘s’. The system of Fig. 2 is reduced to an
equivalent network (λeq, req) shown in Fig. 3using following
basic relations (1) and (2)along with series parallel reliability network reduction formulae which are used to evaluate the basic indices.
λ λ λ λ (1)
λ λ λ
λ λ λ
To improve the reliability indices the failure rate and repair time of each segment of radial distribution system is modified. Addition of DG may require additional cost per KWh to be paid to the private DG owners. In view of this, the objective function is selected as follows:
T(
The objective function constitutes of three parts i.e. first part reflects cost of modifications of failure rates of each section, second part gives cost of modifications in average repair time of each sections, third part represents additional cost to be paid to the owners of DG. This term in fact is the expected energy supplied (EENSO–EENSD) by DG multiplied by additional charge per KWh (ADCOST). Hence a compromise has to be achieved between failure rate and repair time modifications and additional cost involved by the provision of DG sources. This, in fact, is achieved by minimizing the objective function given by relation (3). This framed objective function includes the cost of ‘modifications’ and additional cost of energy purchased from Distribution system operator (DSO), power cannot be taped immediately from G, but with a time delay of ‘s’ (service restoration time from DG) hours and this has been accommodated in modeling aspects.
Expected energy not supplied (EENS) is calculated for all load
points as follows [2]:
EENS is calculated using equation (4) without DG is termed as EENSO and that calculated with DG is termed as EENSD. USYS,i is average annual outage duration at i
th
load point. Usys,i
without DG to evaluate EENSO is given as follows:
λ
To calculate Usys,i with DG to evaluate EENSD, the equivalent
failure rate and repair time are used as given by relations (1) and (2). Usys,i accounting DG is evaluated as follows:
λ (6) The objective function is minimized subject to the following customer and energy based constraints.
1.Bounds on the modification of failure rate and repair time of each section
.
(7)
(8)
λ
eq, r
eqλ
s, r
sλ
dg, r
dgλ
sw,
s
Load point
λ
s,r
sLoad point
λ
dg,r
dg2.Inequality constraint on System Average Interruption Frequency Index (SAIFI):
SAIFI- SAIFId ≤ 0 (9)
where
3.Inequality constraint on System average interruption duration index (SAIDI):
SAIDI - SAIDId ≤ 0 (11)
where
4.Inequality constraint on customer average interruption duration index (CAIDI):
CAIDI -CAIDId ≤ 0 (13)
where
5. Inequality constraint on average energy not supplied
(AENS):
AENS - AENSd ≤ 0 (15)
where
6.Average Service Availability Index (ASAI):
ASAI = [(8760-SAIDI)/8760]*100 (17) xpressions for evaluation of λsys,i and Usys,i for each load point
are given as follows:
Objective function represents the cost of modifications of failure rate and repair time of each section. Further the inequality constraints implicitly represent the various associated cost which may be mitigated by selecting adequate desired values of the customer and energy based indices. In this paper optimum values of failure rate and repair times of each distribution segment are obtained subject to satisfaction of threshold values of reliability indices and enhancement of distributed generation available in standby mode.
3. BACTERIAL FORAGING
ALGORITHM
BFA is an optimization method developed by Kevin M. Passino (2002) [13], based on the foraging strategy of Escherichia Coli (E. Coli) bacteria that live in the human intestine. Foraging strategy is a method of animals for locating, handling and ingesting their food. The foraging strategy of E.Coli is governed basically by four processes namely Chemotaxis, Swarming, Reproduction, Elimination and Dispersal.
3.1 Chemotaxis
Chemotaxis process is the characteristics of movement of bacteria in search of food and consists of two processes namely swimming and tumbling. A bacterium is said to be 'swimming' if it moves in a predefined direction, and 'tumbling' if moving in an altogether different direction. Let j be the index of chemotactic step, k be the reproduction step and l be the elimination dispersal event. Let θi
(j,k,l) is the position of ith bacteria at jth chemotactic step, kth reproduction step and lth elimination dispersal event. The position of the bacteria in the next chemotactic step after a tumble is given by
If the health of the bacteria improves after the tumble, the bacteria will continue to swim in the same direction for the specified steps or until the health degrades.
3.2 Swarming
Bacteria exhibits swarm behavior i.e. healthy bacteria try to attract other bacteria so that together they reach the desired location (solution point) more rapidly. The effect of Swarming is to make the bacteria congregate into groups and move as concentric patterns with high bacterial density.
3.3 Reproduction
In this step, population members who have had sufficient nutrients will reproduce and the least healthy bacteria will die. The healthier half of the population replaces with the other half of bacteria which gets eliminated, owing to their poorer foraging abilities. This makes the population of bacteria constant in the evolution process.
3.4 Elimination and Dispersal
Gradual or sudden changes in the local environment where a bacterium population lives may occur due to various reasons e.g. a significant local rise of temperature may kill a group of bacteria that are currently in a region with a high concentration of nutrient gradients. Events can take place in such a fashion that all the bacteria in a region are killed or a group is dispersed into a new location. To simulate this phenomenon in BFA some bacteria are liquidated at random with a very small probability while the new replacements are randomly initialized over the search space.
[image:3.595.307.517.344.450.2]Fig 4: Implementation of BFA
4. SIMULATION RESULTS
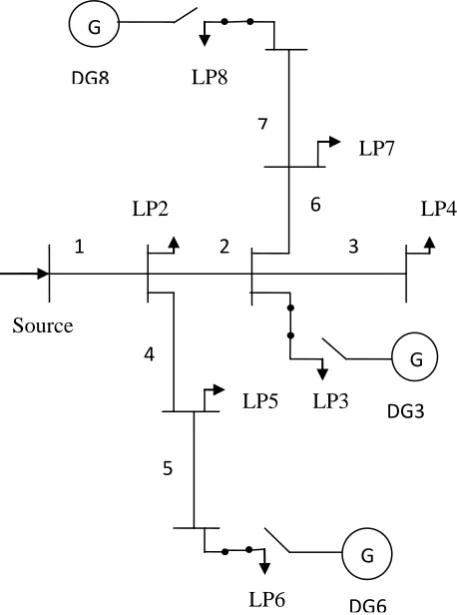
The effectiveness of the proposed bacterial foraging algorithm has been demonstrated by solving reliability optimization problem on a sample 8 node radial distribution system [14], which is shown in fig 5. The system has seven distributor segments. The system has been modified due to presence of DG at load points LP-3, LP-6 and LP-8. In the absence of loss of supply at these nodes, continuity is maintained with the help of these distributed sources. It is assumed that all the DGs have sufficient capacities to meet demand of all the consumers connected at these load points. Each load point (LP) connected to lateral distributor via pole mounted transformers (33/0.4 kV) where a fuse gear is installed.
Fig: 5 Radial distribution systems with DG at selected load points.
In case a short circuit occurs on a lateral distributor, causes fuse to blow. It does not affect or cause the disconnection of any other load point. Hence reliability of 33 kV load point is unaffected. Appendix A.1 gives current and minimum values of failure rate and average repair time for each segment. A.2 shows the average load and number of customers at load points. A.3 gives cost coefficients and for calculating objective function (J). A.4 gives failure rate and average down time for distributed generation. The ADCOST is selected as Rs.1.5 per kWh. λsys and Usys of the load points LP-2, LP-4,
LP-5 and LP-7 which do not have DG are evaluated using following relations.
G
7
DG8
LP8
LP7
LP4
6
Source
LP2
1
2
3
G
LP3
LP5
5
4
DG3
G
LP6
DG6
Start
Read the system data and BFA parameters Start
Read the system data Initialize the bacterium
Update the bacterium
Run BFA and evaluate the objective function
Print optimal values of λ, r, reliability indices and objective function value
Stop
Calculate the reliability indices
Check the inequality constraints No
[image:4.595.52.280.73.458.2]
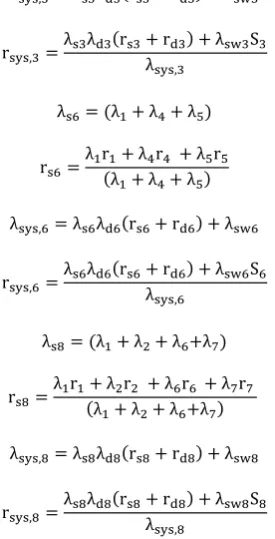
The calculation of basic reliability indices at load points 3, 6 and 8 where DGs are present will be different. The reliability network equations to evaluate basic indices for LP-3, LP-6, and LP-8 are as follows:
Since and with DG are obtained using relations (1)
and (2)as follows:
In the above equations , are failure rate and average down time of DG, failure rate of manual switch, s3 is average
service restoration time. The optimum values of basic reliability indices (i.e.) failure rate and repair time of each feeder segment obtained using BF algorithm and are given in table 1. To validate the proposed method, the obtained results are compared with that of PSO, CAPSO and DE algorithms and the comparison is also given in table 1. CPU times required to solve the problem by these four methods are given in table 2. Though it is observed that the results of all these methods are in close agreement, BF algorithm takes less time than other algorithms.
The load point and customer based reliability indices are calculated using these optimized values of the basic reliability
[image:5.595.303.548.127.605.2]indices and are given in table 3. It is observed that the obtained customer based indices are within the threshold values.
[image:5.595.102.240.337.607.2]Table 1: Optimized values of failure rates and repair times as obtained by BFA.
Table 2: CPU times required for convergence
Variables
Magnitudes as obtained by
PSO [15] CAPSO [15] DE [15] BFA
1
λ
/ year 0.2471 0.2245 0.2331 0.26532
λ
/ year 0.1357 0.1743 0.1789 0.14913
λ
/ year 0.2932 0.3449 0.3104 0.15144
λ
/ year 0.3685 0.3731 0.3430 0.10675
λ
/ year 0.2998 0.2719 0.2845 0.22516
λ
/ year 0.0952 0.0901 0.0920 0.09397
λ
/ year 0.1487 0.1239 0.1483 0.1058r1 (h) 6.0023 6.4414 6.0033 6.0010
r2 (h) 6.0012 6.7191 6.0767 6.0807
r3 (h) 13.2311 8.6474 6.1595 10.0152
r4 (h) 8.0029 8.1497 8.0100 8.0071
r5 (h) 7.0685 7.2750 7.0643 7.0041
r6 (h) 11.3771 6.1672 9.2649 8.0158
r7 (h) 6.0042 6.7933 8.3064 6.0299
Objective function J x104
1.1836 1.1841 1.1701 1.1662
Technique PSO [15] CAPSO [15] DE [15] BFA
Cpu time
Table 3: Current and optimized reliability indices for radial distribution system.
5. CONCLUSION
In this paper an efficient methodology has been presented to improve the reliability of a radial distribution system with DG. An application of Bacterial foraging algorithm has been presented to evaluate optimum failure rate and repair time for each distribution segment subject to various inequality constraints based on energy and customer based reliability indices. The proposed model has been compared with other three optimization techniques based on DE, PSO and CAPSO. It is observed that BFA performs better than other methods. It is also observed that CPU time required for BFA is less than that required for other three techniques. It is clear that the network constraints have a significant impact on the reliability indices in radial distribution systems.
6. APPENDIX
A.1 System data for sample 8 node radial distribution system.
Distributor
segment 1 2 3 4 5 6 7
year
/
λ
0j 0.4 0.2 0.3 0.5 0.2 0.1 0.1
/year
λ
j,min 0.2 0.05 0.1 0.1 0.15 0.05 0.05λ j,max / year 0.6 0.3 0.5 0.8 0.3 0.15 0.15
(h) 10 9 12 20 15 8 12
min j,
r
(h) 6 6 4 8 7 6 6r j,max (h) 15 14 18 30 22 12 18
A.2 Average load and number of customers at load points
A.3 Coefficients and for calculating objective
function (J)
A.4 Failure rate and average down time for distributed generation.
7. REFERENCES
[1] R. Billington and W. Li, 1994, “Reliability ssessment of Electric Power Systems Using Monte arlo Methods”, Plenum, New York.
[2] R. Billinton and R. N Allan, 1996,“Reliability evaluation of power systems”, pringer International dition [3] A.A Sallam, M. Desouky and H. Desouky, 1990,
“ valuation of optimal reliability indices for lectrical Distribution ystems”, I Transactions on Reliability, Vol.39, No.3, pp. 259 – 264.
[4] W.F. Chang and Y.C Wu, 2003, “ ptimal reliability design in an electrical distribution system via polynomial-time algorithm”, lectric Power and nergy ystems, Vol. 25, pp. 659–666.
[5] A. A Chowdhury and D.E. Custer, 2005, “ value based probabilistic approach to designing urban distribution systems”, lectric Power and nergy ystems, Vol.27, pp. 647–655.
Index
SAIFI (interru ptions/cu
stomer) SAID
I (h/cus tomer )
CAIDI (h/cust
omer interr uption )
AENS (kWh /custo mer)
ASA I
Current
values 0.6610
7.267 1
10.993 3
22.233 4 --- DE [15] 0.4997 3.073
1 6.1495 9.0454 --- PSO [15] 0.5000 3.329
7 6.6595 9.9999 --- CAPSO
[15] 0.5000
3.232
4 6.4648 9.8024 --- BFA 0.4451 2.871
3 6.4511 8.6110 99.96 Threshold
values 0.5000
4.000
0 8.0000
10.000 0 ---
Load point
(LP-k) 2 3 4 5 6 7 8
Average load Li(kw)
1000 700 400 500 300 200 150
Number of customers,
Ni
200 150 100 150 100 250 50
Sl.No 1 2 3 4 5 6 7
(Rs) 246 40 81 250 32 4.5 5
(Rs
*102) 100 72.90 72 200 180 38.40 93.60
Sl.No DG
Failure rate λd(1/yr)
Down time rd (h)
Failure rate of manual
switch λsw
(1/yr)
Service restoration
time s (h)
1 DG-3 1.5 15.78 0.5 1.5
2 DG-6 1.75 18.68 0.5 1.5
[6] C.T Su and G.R Lii, 2002, “Reliability design of distribution systems using modified genetic algorithms”, Electric Power System Research, Vol. 60, pp.201–206. [7] S. Chandra Mohan, N. Atturulu, R. P Kumudini Devi
and B. Venketesh, 2010, “ perating cost minimization of a radial distribution system in a deregulated electricity mar et through reconfiguration using G method”, Electrical Power and Energy Systems, Vol. 32, pp.126–132.
[8] J. Mendoza, M. Lopez, C. Coello and E. Lopez, 2009, “Microgenetic multiobjective reconfiguration algorithm considering power losses and reliability indices for medium voltage distribution networ ”, I T Generation, Transmission and Distribution, Vol. 3, No. 9, pp. 825-840.
[9] Bae In-Su and Kim Jin-O, 2007, “Reliability evaluation of distributed generation based on operation mode,” IEEE Transactions on Power Systems, Vol. 22, No. 2, pp. 785 -790.
[10]T. Gozel and M. H. Hocaoglu, 2009, “ n analytical method for the sizing and siting of distributed generators in radial systems,” Electric Power Systems Research, Vol. 79, No. 6, pp. 912–918.
[11]D. Singh and K.S. Verma, 2009, “Multiobjective optimization for G planning with load models”, I Transactions on Power Systems, Vol. 24, No. 1, pp. 427-436.
[12]Reza Baghipour and Seyyed Mehdi Hosseini, 2012, “Placement of G and apacitor for Loss Reduction, Reliability and Voltage Improvement in Distribution etwor s Using BP ”, Intelligent Systems and Applications, Vol. 12, pp. 57-64.
[13]B. Kevin and M.Passino, 2002, “Biomimicry of bacterial foraging for distributed optimization and control”, I Control System Magazine, Vol. 22, No. 3, pp. 52–67. [14]L.D.Arya, S.C.Choube and Rajesh Arya, 2011,
“ ifferential evolution applied for reliability optimization of radial distribution systems”, lectrical Power and Energy Systems, Vol. 33, pp. 271-277.