Symposium-in-Print: Photoreceptors
Scotopic and Photopic Visual Thresholds and Spatial and Temporal
Discrimination Evaluated by Behavior of
Mice in a Water Mazet
Janaki Nathan’, Rebecca Reh’, kina Ankoudinova‘, Genie Ankoudinova’,
Bo Chang2, John Heckenlively3 and James 6. Hurley*’
‘Department of Biochemistry, University of Washington, Seattle, WA ‘The Jackson Laboratory, Bar Harbor, ME
3Kellogg Eye Center, University of Michigan, Ann Arbor, MI
Received 27 February 2006; accepted 27 April 2006; published
online 09 May 2006 DOI: 10.1562/2006-02-27-RA-818
ABSTRACT
Methods that allow specific manipulations of the mouse genome have made it possible to alter specific aspects of photo- receptor function within the mouse retina. Mice with photo- receptors that have altered photosensitivities and altered photoresponse kinetics are now available. Methods are needed that can show how those perturbations in photoreceptor response characteristics translate into perturbations in visual sensitivity and perception. We have adapted a previously described method to evaluate visual threshold, spatial discrimination and temporal discrimination in mice swimming in a water maze. In this report we describe the sensitivities of rod-mediated and cone-mediated vision using GNAT1 4-
and GNATZ-/- mice. Cone-mediated vision is -10000 times less sensitive than rod-mediated vision in mice. We also demonstrate that mice can distinguish striped from solid objects in the water maze and that they can distinguish flickering from continuous illumination.
INTRODUCTION
Methods that analyze human visual sensitivity have provided fundamental information about normal relationships between retinal function and visual perception (see review in 1). Indeed, extensive studies of defects in human color vision have yielded a detailed understanding of the molecular and genetic basis of color blindness ( 2 ) . In general though, the ability to investigate rela- tionships between perception and specific molecular activities in the human retina has been limited. Identification of a human subject with a genetic perturbation that affects a specific molecular process in the retina usually requires a deficiency severe enough that the subject is forced to seek out an ophthalmologist. Mutations that cause retinal degeneration, severe night blindness or achromatopsia have been identified in that way, but mutations that bring about
*Corresponding author email: [email protected] (James B. Hurley) tThis paper is dedicated to Professor Thomas Ebrey on the occasion of his
0 2006 American Society for Phutobiology 003 1-8655106 retirement from the University of Washington.
more subtle deficiencies of vision have been studied only rarely (3). Furthermore, because the human retina is generally not available for biochemical studies it cannot be used to evaluate relationships between specific mutations, biochemical phenotypes and vision.
Genetic manipulation of model organisms is an effective and widely used strategy for investigating how specific biochemical activities influence physiological processes. Mice and zebrafish with mutations that influence specific biochemical and physiolog- ical functions in the retina are available. Optokinetic and optomotor behaviors in zebrafish have been characterized (4-6) and used to screen for mutations that affect vision (7,8). However, methods to analyze effects of mutations on visual perception in mice are limited and only partially characterized. Pinto and Enroth-Cugell (9) have reviewed the use of behavior to study vision in mice. Maze-based tests, cued fear conditioning, conditioned suppression, visual placing, optokinetic nystagmus, pupillary reflex and light- induced shifts in circadian phase have been used, Recent reports also describe the use of optomotor responses (10,ll).
Four methods for evaluating vision in mice are especially notable: (1) Mice can be trained to associate visual stimuli with rewards of flavorful food (12,13). Three circles are projected onto a wall and mice identify the one with unique visual properties; ( 2 ) Mice are trained to escape from water by associating gratings with a platform (14). Video displays precisely control the grating contrast and spatial frequencies; (3) Innate responses, head and body movements, to moving gratings also can be measured precisely (10,15); and (4) Mice can be trained to escape from water in a six-chambered maze by associating a single black wall with a platform to escape from water (16,17). Once mice are trained, the overall illumination can be lowered until mice no longer perceive contrast between black and white walls.
This report extends the characterization of one of these methods, the six-chambered water maze, so that it can be used to analyze mutations that affect specific aspects of photoreceptor and retina function. The water maze is especially well suited for measurement of visual sensitivity. In the study reported here we used it to compare visual thresholds of normal mice with mice in which only rods or only cones are functional. We also used the water maze to demonstrate that mice can learn to recognize spatial patterns and flickering illumination.
1490 Janaki Nathan et a/.
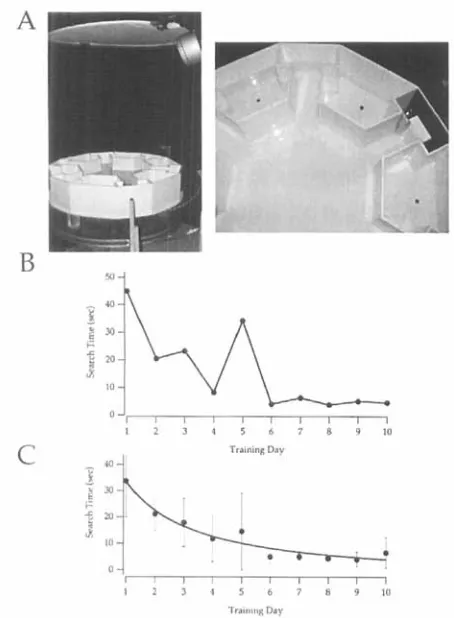
Figure 1. The water maze apparatus and training profiles. A. photograph of the water maze showing the maze, the fiber optic illuminators and reflecting diffusor. B. Training profile for an individual wild-type mouse.
C. Averaged training profile for 10 mice. The error bars represent standard deviations.
MATERIALS AND METHODS
The original version of the water maze evaluated the ability of mice to find a black wall in a white water maze. The maze was described first by Balkema, Mangini and Pinto in 1983 (16) when they used it to investigate visual sensitivity of the pearl mutant mouse. It also has been used to measure visual thresholds in albino mice (17). Our group recently used it to establish visual thresholds in normal and recoverin-deficient mice (18).
Figure 1 shows the water maze. For each trial, a mouse was placed gently in the water in the center of the maze. At the beginning of each trial the mouse was constrained for 10 s in the center of the maze using a transparent plastic cylinder (we used a transparent, 12 cm diameter compact disc case cover with a hole in the top). This allowed the mouse to become accustomed to the water. The cylinder was then raised and a timer was started. The timer was stopped as soon as the mouse began to climb onto the platform. The timer was not stopped if a mouse went part way into the chamber with the platform and turned around. For trained mice, the time to mount the platform once the mouse touched it was always less than 1 s. Each mouse received four training trials per day for 7-10 days under ambient light until its average time to find the platform was constant (-3-5
s). The minimum time to reach the platform is determined by the velocity of the mouse in the water and the distance from the center of the maze to the periphery. The black wall and platform were rinsed and moved randomly to a new position (using a list of random numbers) between trials.
Once mice were trained, testing was performed under controlled illumination, beginning with the brightest illumination and decreasing in intensity by 1 log unit per day until there was a significant increase in the average time required to find the platform. Mice were tested at that level for several days to allow them to establish the most efficient search strategy. When the time to swim to the platform became constant, illumination was lowered further. This process was repeated until the time to find the platform was the same as in complete darkness.
Photographs of the water maze are shown in Fig. 1A. Several sources of
illumination were used in the experiments described in this report. For the lowest levels of illumination we used a 100 W halogen lamp focused onto the end of a trifurcated fiber optic cable. Neutral density filters were used to attenuate the illumination entering the cable. The three ends of the cable were placed evenly around the water maze and aimed at a diffusing reflector mounted above the water maze. Care was taken to be sure there were no shadows within the maze. For intermediate levels of illumination a 100 W halogen source was guided through a 0.5 cm liquid optic cable and aimed at the diffuser through a neutral density filter holder. For the highest level of illumination the diffuser was removed and replaced by a 1000 W halogen lamp. Spectra of reflected light were measured with an Ocean Optics USB 2000 spectrometer. Relative excitation of rhodopsin from the reflected light was estimated by multiplying the flux of photons at each wavelength by the relative absorbance spectrum of rhodopsin.
We estimated photon flux at the cornea by measuring the energy and spectral distribution of light reflected from the white walls of the water maze. The relative numbers of photons at each wavelength were multiplied by the absorbance spectrum of rhodopsin normalized to 1.0 at 500 nm to estimate the efficacy of photons at each wavelength for excitation of rhodopsin. The units in Fig. 2 are presented as the flux of photons that would be equivalent to all the photons being at the peak spectral sensitivity of rhodopsin (-500 nm). This unit is also relevant for the photopic measurements made in this study. The UV output of the sources we used was very low, so we stimulated only M cones in these studies. M opsin, like rhodopsin, absorbs maximally at -500 nm.
Flickering illumination was provided by blue (468 nm) light-emitting diodes (LEDs) held in mounts above each chamber so that the light from the LED (shielded from view on all sides except the front) was projected onto the wall. The six LEDs were controlled by two Vemier Lab Pro (Beaverton, OR) digital-to-analog converters run by a laptop computer. The energy output was integrated using a UDT 350 linear log optometer.
RESULTS
Measurements of visual sensitivity
To evaluate the water maze for testing mouse vision we began by performing simple determinations of visual sensitivity in normal and mutant mice. Mice were trained to find a black wall in a white maze as described (17). Figure 1 A shows a photograph of the water maze with the fiber optic illumination system and reflector used to provide uniform illumination at low light levels. Mice were trained in the water maze four times a day (see Materials and Methods for a detailed description). Figure
1B
shows the training profile for a single mouse and Fig. 1C shows averages from 10 mice. The time for mice to find the black wall decreases during training for about 7days before reaching a minimum.
We tested visual sensitivity by lowering illumination levels by
0.5-1.0 log unit per day until the time for the mouse to find the ramp and platform increased significantly. Typically, 2 additional days of tests were performed to allow mice to optimize their search strategies. Results were averaged from the final 2-3 days of testing at each intensity.
cone-transducin gene that occurred spontaneously in the albino ALS mouse line at Jackson Laboratories. The mutation inactivates cone transducin. Rods show normal electroretinographic (ERG) responses but cones are unresponsive in GNAT2-/- (also referred to as “cpfl3”) mice. The morphology of cpfl3 retinas is normal. A detailed analysis of the cpfl3 mouse will be reported elsewhere. Both the GNAT1-/- and the GNAT2-/- mutations were out-crossed with C57BL/6J mice. Heterozygotes were selected and used to generate families from which homozygous wild-type and homozygous mutant siblings were selected for testing.
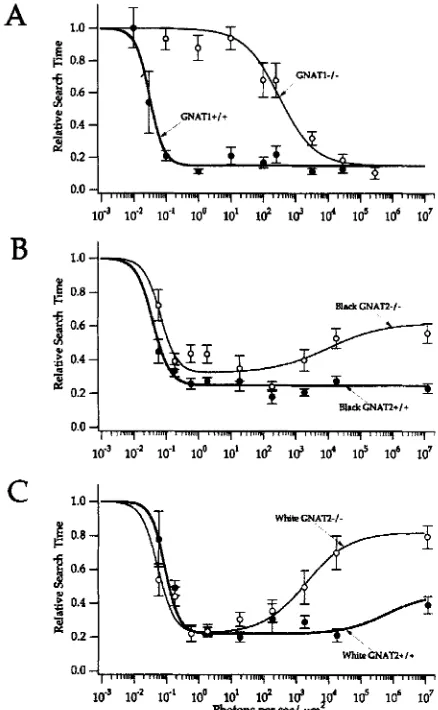
Figure 2 compares visual sensitivities of mice with (GNATl+/+) and without (GNAT1-/-) functional rods. The time it took GNAT+/+ mice to search for the black wall in these experiments increased dramatically below -0.1 photon per s/Fm2 with the half-maximal response at 0.03 photon (500 nm) per s/pm2. The water maze was illuminated with white light but we used the spectrum of the light, the absorbance spectrum of rhodopsin and the wavelength independence of the rhodopsin quantum efficiency to calculate the number of 500 nm photons that would produce the same amount of excitation of visual pigment as the white light in the experiment. Reports of other methods for measuring visual-dependent behavior have focused only on quantification of visual thresholds for spatial resolution and contrast sensitivity, so measurements of thresholds for absolute visual sensitivity using those methods have not yet been reported. However, an earlier study using the six-chambered water maze did report a threshold for absolute visual sensitivity. Hayes and Balkema (17) reported the threshold in their experiments to be
-5
Xcandela/m2. This corresponds to -0.2 photon
(555
nm) per s/pm2. The threshold we measured for a 50% response in normal pigmented mice in our experiments (see Fig. 2A) is 0.03 photon (500 nm) perpm2. Photons at 555 nm are 9% as effective at stimulating rhodopsin and mouse M opsin as 500 nm photons, based on the absorption spectrum of these pigments. So the Hayes and Balkema threshold (17) corresponds to -0.02 photon (500 nm), which is similar to the threshold from our experiments (0.03). The findings in Fig. 2A also are consistent with our previous analysis using a different set of mice (18). Because the absorption spectra of rhodopsin and mouse
M opsin are similar and because only “visible” (i.e. non-UV) wavelengths were used in our experiments these results indicate that cone-mediated vision is
-
lo4 times less sensitive to “visible” light than rod-mediated vision in the mouse.The GNAT2 mutation in cpfl3 occurred spontaneously in an albino strain (ALS) at the Jackson Laboratories. After out-crossing cpfl3 with C57BL/6J, subsequent crosses of the resulting GNAT2+/- heterozygotes with each other produced litters that contained some black pigmented offspring and some albino offspring. We tested the effect of the GNAT2 mutation in both types of genetic backgrounds, albino and pigmented. Rods in GNAT2-/- mice can contribute to vision-dependent behavior reliably when the flux of photons onto the cornea ranges from -0.1 to -5 OOO photons/pm2/s. Cones in GNAT1-/- mice contribute reliably only at fluxes greater than -500 photons/p?/s. These findings suggest that there is a range of about one log unit of intensity where rod and cone function in the mouse visual system overlap. Comparison of Fig. 2B and Fig. 2C shows that pigmentation present in black GNAT2-/- mice may facilitate vision in these experiments, perhaps by absorbing some light so that rods can more readily come out of saturation to signal the presence of the black wall. The albino GNAT2-/- mice also appear to have a slightly higher visual threshold in dim light, consistent with previous observations (17). The behaviors
A
B
[image:3.612.325.544.65.420.2]C
Figure 2. Visual threshold analyses of normal, rod transducin-deficient and cone transduck-deficient mice. A. Rod transducin-deficient mice (GNATl-I-) (n = 4) and normal mice (GNATl+/+) (n = 3) were siblings from crosses of GNATl+/- parents. “Relative Search Time” refers to the average time it took a mouse to find the escape ramp/platform at a specified light intensity relative to the average time it took the mouse to find the platform in complete darkness. Error bars represent standard error. The number of trials (n) for each data point ranged from 12 to 36 in these experiments. B and C. Cone transducin-deficient mice (GNAT2-/-) (n =
5 ) and normal mice (GNAT2+/+) (n = 5 ) were siblings from crosses of GNAT2+/- parents. The heterozygotes were progeny of parents resulting from two out-crosses of the original cpfl3 mutation with C57BL/6J mice. The cpfl3 mutation is a missense mutation in the cone transducin CL subunit gene (GNAT2), a mutation that inactivates phototransduction in cones when homozygous. The original cpfl3 mutation occurred spontaneously in an albino strain, ALS, at the Jackson Laboratories. Progeny from the heterozygote crosses produced both pigmented and albino mice. All mice were tested. Panel B shows the analysis of five black GNAT2+/+ and five black GNAT2-/- mice; panel C shows the analysis of three albino GNAT2+/+ and four white GNAT2-/- mice. Error bars represent standard errors. The number of trials (n) for each data point ranged from 20 to 80 in these experiments.
exhibited by the GNAT1-/- and GNAT2-/- strains in these experiments are generally consistent with the current concept of cone and rod functions.
Ability of mice to recognize patterns
1492 Janaki Nathan et a/.
A
B
C
I I I I I I I I I I
1 2 3 4 5 6 7 8 9 10
250
1 2 3 4 5 6 7 8 9 10
[image:4.612.64.285.62.396.2] [image:4.612.320.542.63.308.2]Training Day
Figure 3. Training profiles for learning to identify striped vs solid visual stimuli. A. Average search times for five wild-type mice for finding the striped wall associated with the ramp and platform. Error bars represent standard deviations. B. Sum total of the variance for five mice for the times to search for the striped wall. C. Fraction of correct first choices in the search for the striped wall. The dashed line represents the probability of
randomly selecting the proper chamber. Error bars represent standard deviations.
walls in the other five chambers were solid white. To determine whether the maze also could be used to test recognition of specific spatial patterns we evaluated the ability of mice to discriminate striped from solid colored walls in the water maze. This experiment was designed as a test of pattern recognition and also to ultimately find evidence for color discrimination. The initial set of stripes used for training was printed in black and white diagonally on a target card. Decoy cards for the other five chambers were solid-colored. The cards were laminated to protect them from water in the maze and to seal in any olfactory cues and clipped to the back walls in each chamber. The overall luminance of the striped cards and of the solid cards were measured and calculated on the basis of probability of photon absorption by rhodopsin, to be the same. For training, illumination was provided by white light from a computer- controlled liquid crystal display projector reflected off the diffuser above the maze.
Figure 3 shows the training records averaged from five wild-type mice. The mice quickly learned to distinguish the striped wall from the solid walls. Figure 3A shows the average overall time to find the platform. Figure 3B,C shows alternative parameters that can also be used to evaluate vision in these experiments. As can be seen from the error bars (standard deviations) in Fig. 3A the time to find
A
B
1
15
10
.t
0 4 , , I ,,,, I , , , ""', , , ,,,,,,I , , , , , , ) , I
0.1 1 10 100
Average photone/pm* per 8ec
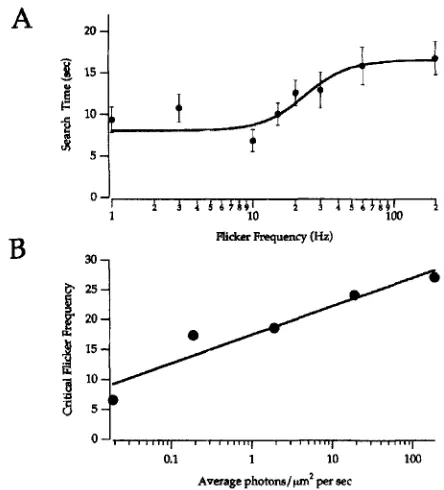
Figure 4. Test for flicker sensitivity and flicker fusion frequency analysis.
A. Average times for five mice to find the one continuously illuminated (200 Hz) panel when the other five panels were flickering at the indicated frequency. Error bars represent standard errors of the mean. Reflected photons reached the position of the cornea at an average rate of 10 photons (568 nm) per pm2 per second. The integrated illumination in each panel was identical and independent of frequency. B. Test of the Ferry-Porter relationship for mice in the scotopic range. The critical flicker frequency appears to be proportional to the log of the average illumination in agreement with the Ferry-Porter relationship that has been described previously for humans.
the platform was highly variable when the mouse was untrained but the variability decreased as training progressed. This is shown more explicitly in Fig. 3B where the variance is plotted v s training. We also evaluated how often a mouse made the correct first choice when entering compartments during each trial. The fraction of correct first choices increased significantly during training as shown in Fig. 3C.
Temporal patterns. We also evaluated the ability of mice to discriminate flickering Erom steady illumination. We adapted the water maze so that in each chamber light from a blue (468 nm) LED was projected onto the back wall of the chamber. We set five of the LEDs to flicker on and off at a specific test frequency. The remaining LED, in the chamber containing the ramp and platform, was set to flicker at a high frequency (200 Hz), well above the maximum critical flicker fusion frequency reported for any animal. An integrating photometer was used to be sure that the overall luminance measured over a period of 1 min was the same in all chambers. Mice were trained to associate the apparently continuous (200 Hz) illumination with the ramp and platform. The training was rather difficult for most mice. They had to be guided to the correct chamber for several days of training before they began to make the association. However, most of the mice did eventually learn to associate the 200 Hz, apparently steady, illumination with the escape platform. In these experiments the ramp, platform and walls all were white.
became less efficient at finding the correct chamber. We considered the critical frequency in these types of experiments to be the frequency at which the time to find the platform increased from the minimum time to a time that was 50% of the average additional time it took the same mice to find the platform when all six chambers were illuminated at 200 Hz. Studies of flicker fusion frequency in other organisms have revealed that the critical fusion frequency is approximately proportional to the logarithm of the luminance, a relationship referred to as the “Ferry-Porter law” (see 22). We determined critical fusion frequencies over a range of light intensities and found that the Ferry-Porter relationship effectively describes the behavior of mice in the water maze (Fig. 4B).
DISCUSSION
Relationships between biochemical activities in neurons and the physiological manifestations of those activities can be investigated by manipulating the genetic makeup of model organisms. Labo- ratory mice have been used in this way to study how photoreceptor function is affected by inactivation or misexpression of specific genes (23). However, relationships between photoreceptor function and vision generally have not been addressed in those types of studies. How does a specific change in the sensitivity or kinetics of a photoreceptor response affect the ability of an animal to perform a vision-dependent behavior? The purpose of the study described in this report is to show how an assay of vision-dependent behavior can be adapted to test several important aspects of visual function. The water maze assay has been used to compare visual sensitivities of pearl mutant mice and of pigmented vs nonpigmented mice
(l6,17). We also used the water maze to compare visual sensi- tivities of normal and recoverin-deficient mice (18). In the studies described here we show how the water maze also can be used to evaluate spatial and temporal aspects of vision.
Other methods have been developed that also provide effective ways to evaluate mouse vision. The optokinetic nystagmus, head movements and vision-dependent choices rewarded by food are notable examples. Recently, a sophisticated method for scoring head movements induced by visual stimuli also has become available (10). The head movement analysis method is particularly attractive because it does not require training and it can be performed using a compact, commercially available apparatus.
There are some notable advantages of the water maze method described in this report. The scoring method is simple and reliable and does not require sophisticated statistical analyses. Control of illumination levels over a broad range of intensity is straightfor- ward. The types of stimuli used can be varied and do not depend on the ability of an animal to detect movement or the ability of the animal to perform specific types of head movements. We showed in this study that mice can learn to distinguish striped vs solid visual targets in the water maze. In preliminary studies (not shown) we also found that mice learn to distinguish symbols, such as X vs.
0 in the water maze. They also can learn to distinguish flickering illurnination from steady illumination. With the proper illumination system (i.e. one that can provide intense UV stimulation), this method could also be effective for measuring chromatic discrim- ination.
There also are disadvantages to the water maze. It requires about
1 week of training and a limited number of trials can be performed each day. The method cannot be used with animals that have memory deficiencies or panic reactions. Occasionally, mice react fearfully and “freeze” in the water; some individuals consistently
show this behavior and do not swim efficiently. We have observed this behavior in about 5-10% of mice in all lines we have used and have not yet found any correlation with any of the genotypes we have tested. Mice with this behavior were easily identified and not used in the studies reported here. There are also slight variations in swimming speed and efficiency from one individual mouse to another. To reduce the effects of this variation the search times for each mouse for a particular condition were normalized to that mouse’s average search time in complete darkness or in the absence of any differences between target and decoy stimuli. We also have been concerned about how to measure the level of illumination that a mouse receives when it is evaluating a stimulus. When the maze is uniformly illuminated from a reflecting diffusion screen above the apparatus all the white walls both in the central area and in the peripheral chambers reflect the same amount of light. However, the level of light (or darkness) that the mouse detects when it passes by, or looks directly into, a chamber might vary. To address this issue we recently modified the apparatus so that the inner walls of the maze are continuous with each other. The entrance to each chamber of the modified maze is between the water and 1.5 cm above the water. In this modified version of the maze mice cannot see the stimulus from afar and instead need to approach and look directly into the chamber to fully evaluate the visual stimulus. With this method we can more accurately evaluate the intensities of illumination at the level of the mouse’s eye.
In this report we described several ways that a water maze can be used to evaluate vision in mice. We have discussed its advantages and disadvantages because the water maze is just one of several methods that are now available to measure vision in mice. Mice with a variety of mutations that affect phototransduction and signal processing in the retina are becoming more widely available. It is important to have several methods available, each with its own strengths and weaknesses, to evaluate the variety of types of stimuli to which the visual system can respond.
Acknowledgement-This research was supported by National Eye Insti- tute grants EY06641 to J.B.H. and EY07758 to B.C.
REFERENCES
1. Field, G . D., A. P. Sampath and F. Rieke (2004) Retinal processing near absolute threshold: From behavior to mechanism. Annu. Rev. Physiol. 67, 491-514.
2. Nathans, J. (1999) The evolution and physiology of human color vision: Insights from molecular genetic studies of visual pigments.
Neuron 24, 299-312.
3 . Nishiguchi, K. M., M. A. Sandberg, A. C. Kooijman, K. A. Martemyanov, J. W. Pott, S. A. Hagstrom, V. Y. Arshavsky, E. L. Berson and T. P. Dryja (2004) Defects in RGS9 or its anchor protein R9AP in patients with slow photoreceptor deactivation. Nature 427, 4. Easter, S. S., Jr. and G. N. Nicola (1996) The development of vision in
the zebrafish (Danio rerio). Dev. 5 i o l . 180, 646-663.
5 . Orger, M. B., E. Gahtan, A. Muto, P. Page-McCaw, M. C. Smear and H. Baier (2004) Behavioral screening assays in zebrafish. Methods Cell Biol. 77, 53-68.
6. Rinner, O., Y. V. Makhankov, 0. Biehlmaier and S. C. Neuhauss (2005) Knockdown of cone-specific kinase GRK7 in larval zebrafish leads to impaired cone response recovery and delayed dark adaptation.
Neuron 47, 231-242.
7. Brockerhoff, S. E., J. B. Hurley, U. Janssen-Bienhold, C. F. Neuhauss,
W. Driever and J. E. Dowling (1995) A behavioral screen for isolating zebrafish mutants with visual system defects. Proc. Narl. Acud. Sci.
8. Muto, A., M. B. Orger, A. M. Wehman, M. C. Smear, J. N. Kay, P. S. Page-McCaw, E. Gahtan, T. Xiao, L. M. Nevin, N. J. Gosse, W. Staub, 75-78.
1494 Janaki
Nathan
et
a/.K. Finger-Baier and H. Baier (2005) Forward genetic analysis of visual behavior in zebrafish. PLoS Genet. 1, e66.
9. Pinto, L. H. and C. Enroth-Cugell (2000) Tests of the mouse visual system. Mamm. Genome 11, 531-536.
10. Prusky, G . T., N. M. Alam, S. Beekman and R. M. Douglas (2004) Rapid quantification of adult and developing mouse spatial vision using a virtual optomotor system. Invest. Ophthalmol. Vis. Sci. 45,461 1 4 6 1 6 . 11. Schmucker, C., M. Seeliger, P. Humphries, M. Biel and F. Schaeffel (2005) Grating acuity at different luminances in wild-type mice and in mice lacking rod or cone function. Invest. Ophthalmol. Vis. Sci. 46,
398407.
12. Jacobs, G. H., J. C. Fenwick, J. B. Calderone and S. S. Deeb (1999) Human cone pigment expressed in transgenic mice yields altered vision. J . Neurosci. 19, 3258-3265.
13. Jacobs, G. H., G. A. Williams and J. A. Fenwick (2004) Influence of cone pigment coexpression on spectral sensitivity and color vision in the mouse. Vision Res. 44, 1615-1622.
14. Prusky, G. T., P. W. West and R. M. Douglas (2000) Behavioral assessment of visual acuity in mice and rats. Vision Res. 40,2201-2209.
15. Douglas, R. M., N. M. Alam, B. D. Silver, T. J. McGill, W. W. Tschetter and G. T. Prusky (2005) Independent visual threshold measurements in the two eyes of freely moving rats and mice using a virtual-reality optokinetic system. Vis. Neurosci. 22, 677-684. 16. Balkema, G . W., N. J. Mangini and L. H. Pinto (1983) Discrete visual
defects in pearl mutant mice. Science 219, 1085-1087.
17. Hayes, J. M. and G . W. Balkema (1993) Elevated dark-adapted thresholds in hypopigmented mice measured with a water maze screening apparatus. Behav. Gener. 23, 395403.
18. Sampath, A. P., K. J. Strissel, R. Elias, V. Y. Arshavsky, J. F.
McGinnis, J. Chen, S. Kawamura, F. Rieke and J. B. Hurley (2005) Recoverin improves rod-mediated vision by enhancing signal trans- mission in the mouse retina. Neuron 46, 413420.
19. Lerea, C. L., D. E. Somers, J. B. Hurley, I. B. Klock and A. H. Bnnt- Milam (1986) Identification of specific transducin alpha subunits in retinal rod and cone photoreceptors. Science 234, 77-80.
20. Lerea, C. L., A. H. Bunt-Milam and J. B. Hurley (1989) Alpha transducin is present in blue-, green-, and red-sensitive cone photo- receptors in the human retina. Neuron 3, 367-376.
21. Calvert, P. D., N. V. Krasnoperova, A. L. Lyubarsky, T. Isayama, M. Nicolo, B. Kosaras, G. Wong, K. S. Gannon, R. F. Margolskee, R. L. Sidman, E. N. Pugh, Jr., C. L. Makino and J . Lem (2000) Photo@ansduction in transgenic mice after targeted deletion of the rod transducin alpha-subunit. Pror. Nutl. Acud. Sri. USA 97, 13 91 3- 13 918.
22. Tyler, C. W. and R. D. Hamer (1990) Analysis of visual modulation sensitivity. IV. Validity of the Ferry-Porter law. J . Opt. Soc. Am. A 23. Bums, M. E. and D. A. Baylor (2001) Activation, deactivation, and adaptation in vertebrate photoreceptor cells. Annu. Rev. Neurosci.
24, 779-805.