International Journal of Emerging Technology and Advanced Engineering
Website: www.ijetae.com (ISSN 2250-2459,ISO 9001:2008 Certified Journal, Volume 4, Issue 7, July 2014)
126
Investigation of Moisture Diffusion Process in Fibre Reinforced
Composites at Elevated Temperatures by Studying The
Diffusivity Factors in Accelerated Hot Wet Resin Matrix for
Water Body Structures.
Sridhar S
1, Prof. Subhasis Maji
1PhD Scholar, Mechanical Engineering Department, Agragami VSM Institute of Aerospace, Engineering, Bangalore,
Karnataka, India.2Professor,Mechanical Engineering Department IGNOU, New Dehli, India.
Abstract— In this study three types of Fibre reinforced composites Glassfibre/epoxy, Glassfibre/vinylester and Glassfibre/polyester resin are fabricated using Hand lay-up process and compacted in a Hotpress. The specimens of these three types of laminates were studied for moisture diffusion at two elevated hotwater temperatures of 900C and 600C to study the kinetics by computing the Diffusion coefficients or Diffusivity factors in Hot wet resin matrix and theoretically evaluated.
Keywords— Elevated temperature, Fibre reinforced composites, Hotpress, kinetics, Moisture Diffusion.
I. INTRODUCTION
Fibre reinforced composites have extensive use in water body structures like boat hull etc. Generally composites of
Glassfibre/epoxy, Glassfibre/vinylester and
Glassfibre/polyester are preferred due to their resistance to water absorption. Water absorption is a draw back in fibre reinforced composites as it leads to degradation and reduction in mechanical properties of the composites. Water absorption may take place due to diffusion process, permeability across the surface and due to capillary action. Microscopic studies have shown that fibre reinforced composites are known to contain voids, micropores, interlaminar microcracks, improper bonding at the fibre/matrix interface, which are the main reactive sites for the chemical kinetics due to water absorption in these regions and stagnating at the fibre/matrix interface. Large number of water molecules initially present on the surface of the laminates, tend to be absorbed due to the difference in the gradient created by the diffusion process and by capillary action into the voids, micropores, interlaminar microcracks, due to the intrinsic defects occuring during the fabrication process of the fibre reinforced composites. These water molecules are known to react with one or more polymer chemical components depending upon the nature of the resin matrix forming alcohols and glycols which try to settle and gets accumulated.
As a result of this stiffening takes place and it becomes more brittle in nature. These reacting molecules come close together in the neighbourhood and depending upon the activation of the energy barrier, the chemical kinetics takes place which may lead to plasticization and swelling at the interface region. This may create some residual stresses in the neighbouring region, initiating interlaminar cracks and debonding affecting the mechanical properties of the composites. In the course of time this leads to degradation or deterioration in mechanical properties and when loaded, these fibres may initiate breaking and is prone to failure. These chemical kinetics may be studied at different environmental conditions. Elevated temperatures gives an accelerated ageing condition and the influence of external temperature to achieve this and predict the behaviour of the resin matrix leading to degradation below Tg..
A. Polyester resins
International Journal of Emerging Technology and Advanced Engineering
Website: www.ijetae.com (ISSN 2250-2459,ISO 9001:2008 Certified Journal, Volume 4, Issue 7, July 2014)
127 Great care is needed in the preparation of the resin mix prior to moulding. The resin and the additives must be carefully stirred to disperse all the components evenly before the catalyst is added. The stirring must be continuous as air bubbles can be formed within the laminates which can weaken the structure. Carefully measured amounts of accelerator and catalyst should be added to control the polymerisation reaction to give the best material properties.
A.1. Vinylester resins
Vinylester resins are similar in their molecular structure to polyesters, but differ primarily in the location of their reactive sites which are positioned only at the ends of the molecular chains. As the whole length of the molecular chain is available to absorb shock loadings which makes vinylester resins tougher and more resilient than polyesters. The vinylester molecule has fewer ester groups. These ester groups are susceptible to water degradation by hydrolysis which means that vinylester exhibit better resistance to water and many other chemicals than their polyester counterparts. The Figure below shows the idealised chemical structure of a typical vinylester. Note the positions of the ester groups and the reactive sites (C*=C*) within the molecular chain [11]
A.2. Epoxy resins.
Epoxy resins are thermosetting polymers in which the primary cross-linking occurs through the reaction of an epoxide group. Epoxies offer high strength, low shrinkage, good adhesive properties, electrical properties, chemical and solvent resistant properties, easily cured, low cost and low toxicity without evolution of by-products. The idealised chemical structure of a typical epoxy is shown in the Figure below. Note the absence of ester groups within the molecular chain [10-11].
Epoxy resins are formed from a long chain molecular structure with reactive sites at either end formed by epoxy groups instead of ester groups as in vinyl ester.
The absence of ester groups means that the epoxy resin has good water resistance characteristics. The simplest epoxy is a three member ring structure known as alpha-epoxy or 1-2-alpha-epoxy. The idealised chemical structure is shown in the Figure below:
The epoxy molecule also contains two ring groups at its centre which are able to absorb both mechanical and thermal stresses better than linear groups and therefore gives epoxy resin very good stiffness, toughness and heat resistant properties.
B. Fabrication of Fibre reinforced composites
International Journal of Emerging Technology and Advanced Engineering
Website: www.ijetae.com (ISSN 2250-2459,ISO 9001:2008 Certified Journal, Volume 4, Issue 7, July 2014)
128 B.1. Hot press
The hot press used was of 5 Ton capacity and hydraulically operated with temperature controller with a
mould size of 1m x 1m and temperature range upto 1500 C.
Hot press is used for uniform distribution of the resin system over the glass fibres and for proper interfacial bonding between the fibre/matrix interface. By applying uniform pressure in the hot press at high temperature, any presence of voids occurred during the hand lay-up process will be eliminated, thereby achieving a perfectly compacted laminate, smooth on both the sides. By applying uniform pressure at high temperature, the resin system will be distributed uniformly and compacted by squeezing out the extra resin under pressure and thereby a uniform thickness of the required size of 3mm is achieved. Also any moisture present during the hand lay-up process will be removed by evaporating at high temperature and air traps will be nullified.
II. EXPERIMENT
The experiment was conducted for the three types of laminates: Glassfibre/polyester(GF/poly), Glassfibre/vinyl ester(GF/VE), Glass fibre/epoxy(GF/EP) resin.The cut edges of the specimens were sealed using a Teflon sealant and dried for 24 hours. The dry weight of the specimens of the three types of laminates were recorded using an electronic balance. These specimens were immersed in hotwater maintained at 900C in a hotwater bath maintained at a controlled temperature of 900C. The specimens were removed from the water bath at regular intervals of time and wiped with a cloth to remove any moisture present on the surface and weighed using an electronic balance and the wet weight of the specimens were recorded. This procedure was followed to record the wet weight of the specimens at different time intervals[1]. TABLE 1 shows the wet weights of the specimens measured at different intervals of
time for hotwater immersion of 900C. Same procedure was
followed and the wet weights of the specimens was recorded at different intervals of time for hotwater immersion of 600C and the results were tabulated as shown in TABLE 2.
The moisture content (%) was determined for the three samples and the average value was taken. Same procedure was followed to determine the moisture content (%) for the
other types of laminates. A Graph was plotted for Moisture
Content (%) vs Time along y-axis and x-axis respectively.
0 0.2 0.4 0.6 0.8 1 1.2 1.4
0 5 10 15
M
oi
st
ur
e
C
on
te
nt
(%
)
Time½ (hrs)
GF/PL-pr60C
GF/PL-th60C
GF/PL-Pr90C
[image:3.612.328.561.202.343.2]GF/PL-Th90C
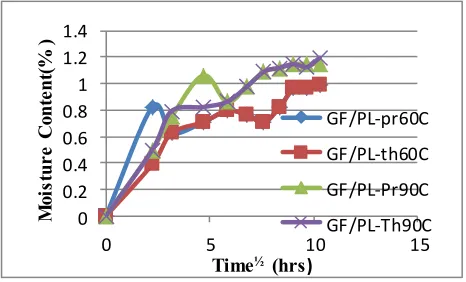
Fig 1. Graph showing Theoretical and Practical Curve ofMoisture Content (%) vs Square Root Time (hours) for Glassfibre/polyester
Laminate.
0 0.2 0.4 0.6 0.8 1 1.2 1.4 1.6
0 5 10 15
M
oi
st
ur
e
C
on
te
nt
(%
)
Time½ (hrs)
GF/VE-pr90C
GF/VE-th90C
GF/VE-pr60C
GF/VE-th60C
Fig 2. Graph showing Theoretical and Practical Curve of Moisture Content(%) vs Square root Time(hours) for Glassfibre/vinylester
resin.
[image:3.612.328.563.388.555.2]
International Journal of Emerging Technology and Advanced Engineering
Website: www.ijetae.com (ISSN 2250-2459,ISO 9001:2008 Certified Journal, Volume 4, Issue 7, July 2014)
129
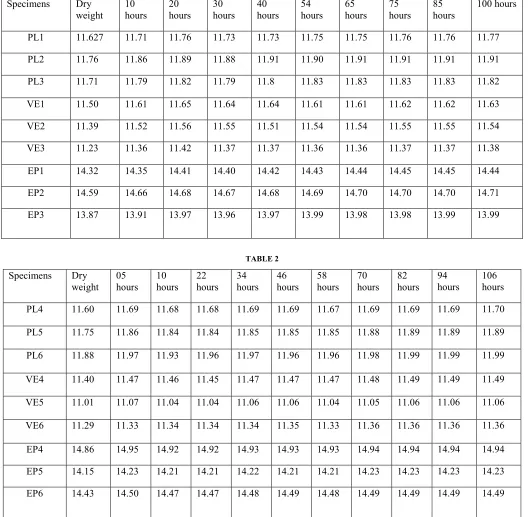
TABLE 1
Specimens Dry
weight 10 hours
20 hours
30 hours
40 hours
54 hours
65 hours
75 hours
85 hours
100 hours
PL1 11.627 11.71 11.76 11.73 11.73 11.75 11.75 11.76 11.76 11.77
PL2 11.76 11.86 11.89 11.88 11.91 11.90 11.91 11.91 11.91 11.91
PL3 11.71 11.79 11.82 11.79 11.8 11.83 11.83 11.83 11.83 11.82
VE1 11.50 11.61 11.65 11.64 11.64 11.61 11.61 11.62 11.62 11.63
VE2 11.39 11.52 11.56 11.55 11.51 11.54 11.54 11.55 11.55 11.54
VE3 11.23 11.36 11.42 11.37 11.37 11.36 11.36 11.37 11.37 11.38
EP1 14.32 14.35 14.41 14.40 14.42 14.43 14.44 14.45 14.45 14.44
EP2 14.59 14.66 14.68 14.67 14.68 14.69 14.70 14.70 14.70 14.71
EP3 13.87 13.91 13.97 13.96 13.97 13.99 13.98 13.98 13.99 13.99
[image:4.612.44.572.153.670.2]
TABLE 2
Specimens Dry
weight 05 hours
10 hours
22 hours
34 hours
46 hours
58 hours
70 hours
82 hours
94
hours 106 hours
PL4 11.60 11.69 11.68 11.68 11.69 11.69 11.67 11.69 11.69 11.69 11.70
PL5 11.75 11.86 11.84 11.84 11.85 11.85 11.85 11.88 11.89 11.89 11.89
PL6 11.88 11.97 11.93 11.96 11.97 11.96 11.96 11.98 11.99 11.99 11.99
VE4 11.40 11.47 11.46 11.45 11.47 11.47 11.47 11.48 11.49 11.49 11.49
VE5 11.01 11.07 11.04 11.04 11.06 11.06 11.04 11.05 11.06 11.06 11.06
VE6 11.29 11.33 11.34 11.34 11.34 11.35 11.33 11.36 11.36 11.36 11.36
EP4 14.86 14.95 14.92 14.92 14.93 14.93 14.93 14.94 14.94 14.94 14.94
EP5 14.15 14.23 14.21 14.21 14.22 14.21 14.21 14.23 14.23 14.23 14.23
International Journal of Emerging Technology and Advanced Engineering
Website: www.ijetae.com (ISSN 2250-2459,ISO 9001:2008 Certified Journal, Volume 4, Issue 7, July 2014)
[image:5.612.54.286.134.318.2]130
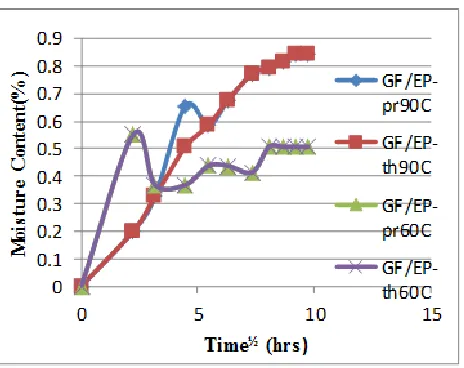
Fig 3. Graph showing Theoretical and Practical Curve of Moisture Diffusion(%) vs Square root Time(hours) for Glassfibre/epoxy
Laminate.
Since same readings were obtained after 95 hours, these readings were taken as saturation values for calculations. The Moisture Content(%) at any given interval of time was determined using the relation:
Mt = [Mw- Md/Md]*100 (1) Where, Mw is the wet weight of the specimen, Md is the
dry weight of the specimen. A sample size of three was taken for the experiment.
For T=900C:
Mm(%) GF/Poly = 1.1483%
Mm(%) GF/VE = 1.2463%
Mm(%0 GF/EP = 0.8419%
Similarly, for T=600C:
Mm(%) GF/Poly = 0.993%
Mm(%) GF/VE = 0.61967%
Mm(%) GF/EP = 0.50633%
The present investigation is the effect of temperature on moisture uptake or diffusivity factor.
Fick‘s second law, in one-dimensional form:
(z,t) = Dz* (z,t) ( 0 ≤ z ≤ h, t ˃ 0) (2)
Where, C is concentration of diffusing moisture, t is time, x is the position in diffusing direction, Dz is moisture diffusion co-efficient in z-direction, along the thickness, h is thickness of specimen.
When a dry laminate of composite of uniform thickness ‗h‘ is exposed to moisture, the sample mass increases due to water uptake, the moisture uptake (or mass gain) Mt is obtained as:
= [1- Σ( * exp[{- }] (3)
The approximate solution to this equation is given by:
= 4 [ ]½ (4)
Now the diffusion co-efficient can be calculated from the initial slope, after re-arranging the terms:
Dz = [ ]2* ( slope)2 (5)
Slope = = (6)
Also, the time required to attain maximum moisture content (99.9%) can be expressed as:
tm=[ ] (7)
The diffusion co-efficient D is calculated using the relation:
Mt = Mi + [(Mm – Mi)*( ) * ] (8)
Where, Mi is initial moisture content in the solid, Mm is saturation moisture content, h is thickness, t is time, D is diffusivity in the direction of thickness, Mt is moisture content at any time ‗t‘.
Here Mi = 0, i.e.,
International Journal of Emerging Technology and Advanced Engineering
Website: www.ijetae.com (ISSN 2250-2459,ISO 9001:2008 Certified Journal, Volume 4, Issue 7, July 2014)
131 0
0.2 0.4 0.6 0.8 1 1.2 1.4
M
oi
st
ur
e
C
on
te
nt
(%
[image:6.612.328.559.152.364.2])
Fig 4 Bar Chart showing the Moisture Content (%) at saturation level of the Three types of Laminates at T=900C and T=600C.
The diffusivity factor or diffusion co-efficient D of the three types of laminates at different time intervals at 900C are shown in TABLE 3.
TABLE 3
Diffusivity Factor of the Three types of Laminates at 900C.
Time to attain maximum moisture content for the three
types of laminates are:
tm (GF/Poly) = = 338 hours.
tm (GF/VE) = = 338 hours.
tm (GF/EP) = = 338 hours.
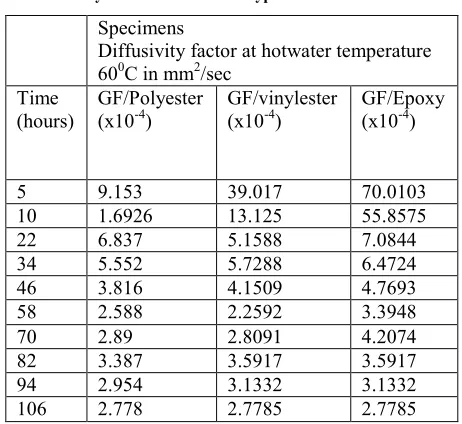
TABLE 4.
Diffusivity Factors of the Three types of Laminates at 600C
Specimens
Diffusivity factor at hotwater temperature 600C in mm2/sec
Time
(hours) GF/Polyester (x10-4) GF/vinylester (x10-4) GF/Epoxy (x10-4)
5 9.153 39.017 70.0103
10 1.6926 13.125 55.8575
22 6.837 5.1588 7.0844
34 5.552 5.7288 6.4724
46 3.816 4.1509 4.7693
58 2.588 2.2592 3.3948
70 2.89 2.8091 4.2074
82 3.387 3.5917 3.5917
94 2.954 3.1332 3.1332
106 2.778 2.7785 2.7785
Time to attain maximum moisture content for the three types of laminates:
tm (GF/Poly) = 0.698*32/0.0166711 = 377 hours. tm (GF/VE) = 0.698*32/0.01667118 =377 hours. tm (GF/EP) = 0.698*32/0.01667 = 377 hours.
III. DISCUSSION
It is observed from the graph shown in Figure.1.,Figure 2 and Figure 3, the diffusion curve is linear in the initial stages obeying Fick‘s second law of diffusion and during this phase, the diffusion co-efficient D increases with the passage of time at a constant controlled temperature[4]. During this phase the absorbed moisture content(%) also increases with the increase in time[2]. This linear variation is according to the earlier studies and can be predicted by Fick‘s second law of diffusion. Also there is a linear increase in the moisture absorption during this phase[5]. The diffusion co-efficient D, increases in the initial stages, and shows greater absorption of moisture, and hence the wet weight of the specimens of the three types of laminate composites also shows higher values. There is a variation in diffusivity factors after the initial stage, indicating lower absorption of moisture and which stabilizes after passage of time.
After the initial moisture absorption, it is observed from the graph, that the moisture absorption varies, and a non-linear type of variation is observed in the second phase, and cannot be predicted using Fick‘s second law.
Specimens
Diffusivity factor at hotwater temperature 900C in mm2/sec
Time (hours)
GF/Polyester (x10-6)
GF/vinylester (x10-6)
GF/Epoxy (x10-6)
5 18.6 30.9 5.54
10 28.8 37.2 7.35
20 21.0 35.3 1.486
30 9.24 17.5 7.902
40 8.87 10.85 7.97
54 8.2 7.65 7.659
65 7.179 6.36 6.73
75 6.54 6.39 6.183
85 4.379 5.639 5.78
International Journal of Emerging Technology and Advanced Engineering
Website: www.ijetae.com (ISSN 2250-2459,ISO 9001:2008 Certified Journal, Volume 4, Issue 7, July 2014)
132 After passage of time, the system stabilises and maintains a constant level of absorption pattern, which can be considered as saturation state[6-7].With further passage of time it can be concluded that the system attains equilibrium with the external surroundings and tries to achieve 99.9% moisture content(%) [3].
From Figure 4, it is seen that the percentage of Moisture Content(%) increases with increase in temperature for the three types of laminates.The Diffusivity factors shown in TABLE 3 and TABLE 4 shows a decrease in values for the elevated temperatures with increasing time of 900C and 600C for the three types of laminates. Also the values of Diffusivities recorded shows, that the diffusion co-efficient D is not a fixed constant for a controlled temperature, but varies slightly with the passage of time. The diffusivity of glassfibre/epoxy laminate is very low when compared to the glassfibre/vinylester and glassfibre/polyester laminates. Also the absorbed moisture content(%) is lower, compared to the glassfibre/vinylester and glassfibre/polyester laminates. Glassfibre/epoxy laminates offers much more resistance to water absorption and hence slows down the deterioration of the laminates and predicts increased life expectancy, in terms of moisture degradation. The other two types of laminates GF/VE and GF/Poly shows higher values of diffusion co-efficient D and lower resistance to water absorption.
The viscoelastic nature of polymer shows non-fickian diffusion after the initial stage and moisture absorption in composites is mainly due to resin matrix and permeable fibres show very little moisture absorption. The factors influencing moisture degradation in composites: Swelling of the matrix phase, presence of residual stresses at and near the interfaces, weakening or breaking of the adhesion bond between the fibre and the matrix, and polymer-water interaction mechanisms governing the moisture diffusion process in composites[12].
Also it is seen that the rate of diffusion increases in the initial stages which can be related to the increase in activation energy as given by the Arrhenius equation:
R(T) = A exp[ ] (10) R is Universal gas constant=8.3144 Jmol-1K-1
Ea = -RT ln[ ] (11) A is frequency factor, K is co-efficient of reaction rate, T is
temperature in kelvin.
Diffusivity depends upon the nature of the resin matrix, fibre size, fibre orientation, fibre volume fraction, porosity and voids [8] & [9] and temperature.
The theoretical and practical values match each other, and their curves obtained are similar for the three types of laminates.
Since the diffusivity factors were stabilized after 95 hours for the three types of laminate composites, it is seen that the time to attain maximum moisture content for the three types of laminates is same for a constant controlled temperature but varies for different elevated temperatures.
IV. CONCLUSION
Diffusivity factor or diffusion co-efficient is very important and determines the flow across the concentration gradient for a fixed temperature. Diffusion occurs at the same constant temperature due to the movement across the intersticial spaces and also due to capillary action. The amount of moisture content or uptake depends upon the diffusivity or the diffusion co-efficient and varies accordingly to temperature. The process of diffusion takes place due to hydrolysis and plastization of the immediate neighbouring molecules in the resin matrix, and the swelling due to the absorption of moisture, which initiates a concentration gradient in the immediate neighbouring molecule, which finally initiates a diffusion process across the laminate. The presence of fibres slows down the movement of the molecules and hence lowers the diffusivity factors after the initial stage. The practical results obtained for the two elevated temperatures were analysed and discussed theoretically and the values obtained were agreeable.
REFERENCES
[1 ] M Nakada Y Miyano, Material System Research Laboratory, Kanazawa Institute Of Technology, 16 th Int.Conf.of Composite Materials.
[2 ] A Naceri. Laboratory of materials, Faculty of Sciences and Engineering, University of M‘sila, Algeria.
[3 ] Mei Lei, Temperature and moisture effects on Composite Materials for wind turbine blades, Montana State University, Bozemon, Montana, March 2000.
[4 ] G.Czel and T Czigany,‖A study of water absorption and mechanical properties of glassfibre/polyester composite pipes- Effects of specimen geometry and preparation,‖ journal of composite materials, Vol.42,(2008) pp.2815-2827.
[5 ] Pritchard G, Speakes D,‖The use of water absorption kinetic data to predict laminate property changes,‖ Composites, Vol.18,(1987) pp.227-232.
International Journal of Emerging Technology and Advanced Engineering
Website: www.ijetae.com (ISSN 2250-2459,ISO 9001:2008 Certified Journal, Volume 4, Issue 7, July 2014)
133 [7 ] Hyeong Yeol Kim, Young Hawn Park, Young Jun You, Chang
Kwon Moon,‖Short term durability test for GFRP rods under various
environmental conditions,‖ Composite structures,
Vol.83(2008),pp.37-47.
[8 ] Pilli SP, Simmons KL, Holbery JD, Shuttinandan V, Stickler PB and Smith LV,‖ A novel accelerated moisture absorption test and characterization,‖ Composites Part-A; Applied science and manufacturing, Vol.40, Issue 9(2009), pp.1501-1505.
[9 ] Caeter HG, Kibler KG, Langmuir,‖Type model for anamolous moisture diffusion in composite resins,‖ journal of composite materials, Vol.12,(1978),pp.118-131.
[10 ] http://www.spsystems.com/ [11 ] http://www.gurit.com/
[12 ] Dewimille B,Bunsell AR,‖Accelerated ageing of glass fibre reinforced epoxy resin in water,‖ Composites, Vol.14, Issue 1(1983), pp.35-40.