Monochrome Image Compression using Log-Gabor
Filter
Sanjay J. Bagul
North Maharashtra University(N.M.U),Jalgaon, Maharashtra (India)
Navinchandra G.Shimpi
North Maharashtra University(N.M.U),Jalgaon, Maharashtra (India)
Pradeep M.Patil
RMD Sinhgad Technical Institutes Campus,PuneMaharashtra (India)
ABSTRACT
Data is basic component of information and available in various formats like textual, graphical, etc. An image is a type of graphical data. Various programs using complex graphics are growing in the fields of computing applications such as games, education, desktop publishing, graphical design and many more. High compression ratio severely affects the quality of the image. This paper attempts to improve compression ratio while at the same time minimizing the degradation in quality of images. In this paper compression of the images is based on Log-Gabor filtering that removes the redundant information from a given image. This filter tries to maintain the image quality while reducing storage requirements. Log-Gabor filter is implemented in MATLAB and applied to images of various resolutions, sizes and types. The image filtered by Log-Gabor filter occupies less storage space and has better quality. The resultant image has increased compression ratio compared to the original image indicating high degree of image compression.
Keywords
Monochrome image, Image compression, Gabor filter, Log-Gabor filter, JPEG compression.
1.
INTRODUCTION
Data compression, bit rate reduction or source coding, in information theory, involves encoding information using fewer bits than the original representation. Compression can be either lossless or lossy. Lossless compression involves reduction of bits by identifying and eliminating statistical redundancy. Lossless compression involves no loss of information. Bits are reduced in lossy compression by identifying marginally important information and eliminating it. Data compression is a process of reducing the size of a data file; named formally as source coding (coding done at the source of the data, before storing or transmission). The utility of compression is in reduction of resource usage like storage space or transmission capacity for data. The compressed data must be decompressed before usage; this extra processing imposes computational or other costs through decompression.
Lossless compression is preferred for archival purposes and many times used for technical drawings, medical imaging, clip art, or comics. This is due to the fact that compression artifacts are introduced by lossy compression methods, especially when used at low bit rates. The suitability of lossy methods is observed for natural images like photographs in which minor or imperceptible loss of fidelity may be compromised to achieve sustainable bit rate reduction. The term visually lossless compression may be used for lossy compression that produces imperceptible differences.
the distance for weighted log-spectral tends to outperform the metrics for filter bank-based. Albert Wang et al [13] demonstrate an image sensor implemented in 180nm logic CMOS process that uses diffractive optical structures integrated in the CMOS back-end layer stack to compute a low-order 2D spatial Gabor transform on visual scenes and directly acquires images in a compressed format. LI Ji-liang et al [14] propose a sparse over complete image approximation method based on the ideas of over complete Log-Gabor wavelet, mean shift and energy concentration by selecting the necessary wavelet coefficients with a mean shift based algorithm and concentrating energy on the selected coefficients. The method sparsely approximates the original image and converges faster than the existing local competition based method. Daniel Gonzalez-Jimenez et al [15] provide an empirical comparison of two statistical models used to characterize non-normal behavior namely Generalized Gaussian and the Bessel K Form densities in the specific scenario of modeling Gabor coefficients extracted from face images. An application for biometric template reduction is presented based on the underlying statistics. Compression is achieved via Lloyd-Max algorithm and then, only the best nodes of the grid are preserved using a simple feature selection strategy. Zehira Haddad et al [16] propose a fingerprint image compression approach where the quality of the decoded image is perceptually controlled using wave atom transform that is more appropriate than wavelets for fingerprint image compression. Michael P. Eckert et al [17] present a review of perceptual image quality metrics and their application to still image compression and describe how image quality metrics can be used to guide image compression. A broad range of metrics ranging from simple mathematical measures to those which incorporate full perceptual models are examined; highlighting some variation in the models for luminance adaptation and the contrast sensitivity function. This paper focuses on the application of Log-Gabor transform for compression of monochrome images. The paper is organized as follows: Section II describes Log-Gabor filter, Section III describes the implemented algorithm for compression of monochrome images, Section IV elaborates on results and discussions followed by Conclusions and References.
2.
LOG-GABOR FILTER
Filtering in general means removal of unwanted things from a given quantity. For example, the water filter removes the bacteria from the water to give pure water and air filter filters the dust particles from air to give pure air. The same concept is applied in digital image processing field to remove the unwanted signals from the image. In image enhancement, filter plays a vital role. It creates a new pixel with co-ordinates equal to that of the center of the neighborhood and whose value is the result of filtering operation. A filtered image is generated as the center of the filter visits each pixel in the input image. The filtered pixel value is typically assigned to a corresponding location in a new image created to hold the results of filtering. It is seldom the case that filtered pixel replaces the values of the corresponding location in the original image that would change the content of image while filtering is still being performed. In convolution or correlation to generate the resultant image, the filter mask is convolved with the original image. Hence, the new image has filtered matrix coefficients. For blurring and noise reduction, smoothing filters are used. The pre-processing steps like removal of small details from an image prior to large object extraction and bridging of small gaps in lines or curves, involve blurring operation. Linear filter and non-linear
[image:2.595.321.534.163.328.2]filtering can contribute to noise reduction is a blurring process. These filters can be used for image smoothing where information in image edges is lost. The edges represent the high frequency contents but the filter tries to remove the high frequency contents. Hence, sometimes this filter is called as low pass filter. Fig 1 shows the results of application of smoothing filters on an image consisting of characters. The characters and lines have completely lost their edges.
Fig 1: Smoothing of Image by Low Pass Filters
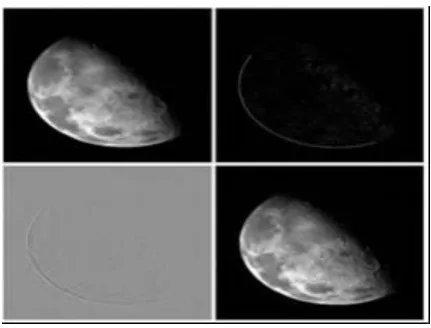
The main objective of sharpening is to highlight fine details in an image or to enhance blurring effects like an error or as a natural effect of a particular method of image acquisition. The applications of image sharpening vary and include a range from electronic printing and medical imaging to industrial inspection and autonomous guidance in military systems. Fig 2 shows the application of image sharpening.
Fig 2: Sharpening of Image by High Pass Filters
The moon image is better viewed as shown in fourth quadrant of Fig 2 because of sharpening effect. The details of moon surface are seen due to edge representation.
[image:2.595.321.537.422.586.2]𝐺 𝑠,𝑡 𝜌, 𝜃 = exp −12 𝜌−𝜌𝜌 𝑠 2
. exp −12 𝜃−𝜃 𝑠,𝑡 𝜃 2 (1)
with,
𝜌𝑠= 𝑙𝑜𝑔2 𝑛 − 𝑠
𝜃 𝑠,𝑡 =
𝜋
𝑛𝑡𝑡; 𝑖𝑓 𝑠 𝑖𝑠 𝑜𝑑𝑑
𝜋 𝑛𝑡 𝑡 +
1
2 ; 𝑖𝑓 𝑠 𝑖𝑠 𝑒𝑣𝑒𝑛
(𝜍𝜌, 𝜍𝜃) = 0.996
2 3,
1 2
𝜋 𝑛𝑡
where,
(ρ, θ) are the log-polar coordinates (in log2 scale, indicating the filters are organized in octave scales),
𝑠 ∈ {1, . . . , 𝑛𝑠} is the scale index,
𝑡 ∈ {1, . . . , 𝑛𝑡} the orientation of the filter,
𝑛𝑠 is the number of scales of the multi resolution scheme,
𝑛𝑡 is the number of orientations,
(𝜌𝑠, 𝜃 𝑠,𝑡 ) are coordinates of the centre of the filter,
(𝜍𝜌, 𝜍𝜃) are the bandwidths in and , common for all filters.
The experimentation performed in this paper uses ns= 5 and the range of nt from 3 to 20, typically selected as eight orientations. It is highly justified here to consider the Fourier domain through the log-polar coordinates. In such coordinate system, the octave distribution of the filters constitutes a regular grid, the centre of the filters defined by (1) laying on uniform hexagonal lattice. Moreover, in such coordinates the filters are purely Gaussian having constant bandwidths across orientations and scales. The filters defined by (1) cover only one side of the Fourier domain. It is worth considering them in Fourier as the sum of a symmetric component and an anti-symmetric component. These components sum up their amplitudes on one side of the Fourier domain and cancel themselves on the other side. Thus, in the spatial domain the filters have both a real part (with cosine shape due to the symmetric component) and an imaginary part (with sine shape due to the anti-symmetric component). A single Log-Gabor filter defined in Fourier domain by (1) yields both a real and an imaginary part in the spatial domain [18].
3.
IMPLEMENTED ALGORITHM
Bitmap image file is generally referred to as BMP file format or device independent bitmap file format or simply a bitmap. The compressed image is the result of Log-Gabor filtering. Figure 3 shows block diagram of the implemented system.
Log-Gabor filter removes colors which are not recognized by the human visual system. Filtered image so obtained preserves the pixel energy and the compression level is increased. The Log-Gabor filter helps to maintain the image quality intact by reducing the redundancy in the image. Hence, the filtered image has increased compression ratio. This filtered image occupies less memory space than that of the original BMP image. This indicates that a high degree of image compression is achieved.
Various steps in the implemented algorithm for compression of monochrome image are as follows:
Step 1 Read the image and provide input parameters required for processing
Step 2 Accept the input parameters such as scale, orientation, frequency and theta.
Step 3 Calculate 𝜍𝜌, 𝜍𝜃, and 𝜌𝑠 using (1).
Step 4 Calculate Log-Gabor filter matrix for given frequency and theta values using (1).
Step 5 Slide the Log-Gabor filter matrix over the given image. Step 6 Apply JPEG compression on filtered image.
Step 7 Calculate compression ratio of original and compressed image.
Step 8 Slide the conjugate of Log-Gabor filter matrix on given image which gives reconstructed image.
Step 9 Calculate PSNR and BPP of reconstructed image. Step 10 Display both original and output compressed image.
4.
RESULTS AND DISCUSSIONS
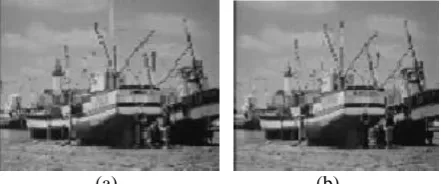
The simulation tool used for monochrome image compression is MATLAB to examine the validity of the monochrome image compression using Log-Gabor filter followed by JPEG compression. The implemented GUI code is applied to various uncompressed monochrome images collected from website. Three important factors in the image compression using Log-Gabor are𝜍𝜌, 𝜍𝜃, and 𝜌𝑠. The number of scales of the multi-resolution scheme is selected to be 5 and the number of orientations as 8. Figure 4 shows results of the implemented algorithm for the sample image boats.bmp. The memory required for storing the original image is 406 kB. The dimensions of this image are 720×576. The compression ratio is 0.9974. The image is compressed using Log-Gabor filter and JPEG compression technique. The performance of compression algorithm is analyzed based on compression ratio, size of the compressed image, PSNR and bits per pixel. The compression ratio comes out to be 66.7181, with the size of the compressed image reduces to 4.22 kB and required 0.014942 bits per pixel with PSNR of 24.3948.
[image:3.595.319.540.507.599.2]
(a) (b)
Fig 4 Compression using Log-Gabor Filter and JPEG compression (a) Original Image (b) Compressed Image
(a) (b)
Fig 5 Compression using Log-Gabor Filter and JPEG compression (a) Original Image (b) Compressed Image
Fig 6 shows results of the implemented algorithm for the sample image Len128.bmp. The memory required for storing the original image is 17.462 kB. The dimensions of this image are 128×128. The compression ratio is 0.92827. The image is compressed using Log-Gabor filter and JPEG compression technique. The performance of compression algorithm is analyzed based on compression ratio, size of the compressed image, PSNR and bits per pixel. The compression ratio comes out to be 30.2874, with the size of the compressed image reduces to 0.541 kB and required 0.03302 bits per pixel with PSNR of 18.1416.
[image:4.595.331.526.107.211.2]
(a) (b)
Fig 6 Compression using Log-Gabor Filter and JPEG compression (a) Original Image (b) Compressed Image
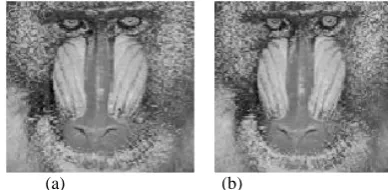
Fig 7 shows results of the implemented algorithm for the sample image 00OpaV-42360984.bmp. The memory required for storing the original image is 516.278 kB. The dimensions of this image are 800×644. The compression ratio is 0.99791. The image is compressed using Log-Gabor filter and JPEG compression technique. The performance of compression algorithm is analyzed based on compression ratio, size of the compressed image, PSNR and bits per pixel. The compression ratio comes out to be 65.0259, with the size of the compressed image reduces to 7.923 kB and required 0.015378 bits per pixel with PSNR of 18.7965.
(a) (b)
Fig 7 Compression using Log-Gabor Filter and JPEG compression (a) Original Image (b) Compressed Image
Fig 8 shows results of the implemented algorithm for the sample image Cameraman128.bmp. The memory required for storing the original image is 17.462 kB. The dimensions of this image are 128×128. The compression ratio is 0.93827. The image is compressed using Log-Gabor filter and JPEG compression technique. The performance of compression algorithm is analyzed based on compression ratio, size of the
ratio comes out to be 70.2897, with the size of the compressed image reduces to 3.729 kB and required 0.014225 bits per pixel with PSNR of 17.1111.
(a) (b)
Fig 8 Compression using Log-Gabor Filter and JPEG compression (a) Original Image (b) Compressed Image
Fig 9 shows results of the implemented algorithm for the sample image flowers.bmp. The memory required for storing the original image is 308.278 kB. The dimensions of this image are 640×480. The compression ratio is 0.9965. The image is compressed using Log-Gabor filter and JPEG compression technique. The performance of compression algorithm is analyzed based on compression ratio, size of the compressed image, PSNR and bits per pixel. The compression ratio comes out to be 20.7023, with the size of the compressed image reduces to 4.058 kB and required 0.01321 bits per pixel with PSNR of 20.3034.
(a) (b)
Fig 9 Compression using Log-Gabor Filter and JPEG compression (a) Original Image (b) Compressed Image
5.
CONCLUSION
From the results it is concluded that the use of Log-Gabor filter prior to compression technique helps to improve the compression ratio. Good compression ratio is achieved in addition to retaining the quality of original image. Filter input parameters decide the filter performance that is directly related to image compression ratio and resultant filtered image quality.
6.
REFERENCES
[1] J.G. Daugman, "Complete discrete 2-D Gabor transforms by neural networks for image analysis and compression," IEEE Transactions on Acoustics, Speech and Signal Processing, vol. 36, no. 7, pp. 1169 - 1179 , Jul 1988.
[2] H. Wang and H. Yan, "Efficient implementation of Gabor transforms for image compression," Electronics Letters, vol. 28, no. 9, pp. 870-871, Apr 1992.
[3] H. Wang and H. Yan, "Adaptive Gabor discrete cosine transforms for image compression," Electronics Letters, vol. 28, no. 18, pp. 1755 - 1756, Aug 1992.
[image:4.595.75.261.322.418.2] [image:4.595.326.531.366.445.2] [image:4.595.63.274.569.660.2][5] Shidong Li, "A generalized non-separable 2-D discrete Gabor expansion for image representation and compression," in Proceedings of IEEE International Conference Image Processing(ICIP), vol. 1, Austin, TX , 1994, pp. 810 - 814.
[6] K.S. Prashant, V.John Mathews, and P.J. Hahn, "A new model of perceptual threshold functions for application in image compression systems," in Proceedings of Data Compression Conference (DCC), Snowbird, UT, 1995, pp. 371 - 380.
[7] A.S. Ragab, A.S.A. Mohamed, and M.S. Hamid, "Efficiency of analytical transforms for image compression," in Proceedings of the Fifteenth National Radio Science Conference(NRSC), Cairo, 1998, pp. B16/1 - B16/10.
[8] D.L. Donoho, M. Vetterli, R.A. DeVore, and I. Daubechies, "Data compression and harmonic analysis," IEEE Transactions on Information Theory, vol. 44, no. 6, pp. 2435 - 2476, Oct 1998.
[9] P. Turcza and T.P. Zielinski, "Fast cosine Gabor transform and its application to image compression," in Proceedings of the IEEE-SP International Symposium on Time-Frequency and Time-Scale Analysis, Pittsburgh, PA, 1998, pp. 461-464.
[10]R.A. Baxter, "SAR image compression with the Gabor transform," IEEE Transactions on Geoscience and Remote Sensing, vol. 37, no. 1, pp. 574 - 588, Jan 1999.
[11]S. Fischer and G. Cristobal, "Minimum entropy transform using Gabor wavelets for image compression," in Proceedings of 11th International Conference on Image Analysis and Processing, Palermo, 2001, pp. 428 - 433.
[12]J. Balle, "Subjective evaluation of texture similarity metrics for compression applications," in Picture Coding Symposium (PCS), Krakow, 2012, pp. 241 - 244.
[13]A. Wang, S. Sivaramakrishnan, and A. Molnar, "A 180nm CMOS image sensor with on-chip optoelectronic image compression," in IEEE Custom Integrated Circuits Conference (CICC), San Jose, CA, 2012, pp. 1 - 4.
[14]Ji-liang Li, Xiang-zhong Fang, and Jun Hou, "Mean shift based log-Gabor wavelet image coding," Journal of Zhejiang University Science Applied Physics and Engineering, vol. 8, no. 4, pp. 620-624, Apr 2007.
[15]Daniel Gonzalez-Jimenez and Jose Luis Alba-Castro, Modeling Marginal Distributions of Gabor Coefficients: Application to Biometric Template Reduction, 2008.
[16]Zehira Haddad, Azeddine Beghdadi, Amina Serir, and Anissa Mokraoui, "Wave atoms based compression method for finger print images," Pattern Recognition, vol. 46, pp. 2450-2464, 2013.
[17]Michael P. Eckert and Andrew P. Bradley, "Perceptual quality metrics applied to still image compression," Signal Processing, vol. 70, pp. 177-200, 1998.
[18]Sylvain Fischer, Filip Sroubek, Laurent Perrinet, Rafael Redondo, and Gabriel Cristobal, "Self-Invertible 2D Log-Gabor Wavelets," International Journal of Computer Vision, vol. 75, no. 2, pp. 231-246, 2007.
7.
AUTHOR’S PROFILE
Mr. Sanjay J. Bagul received his B. E. (Electronics) degree in 1994 from University of Pune, Pune, (India) and M. E. (Instrumentation) degree in 1999 from Shri Ramanand Terth Marathwada University (SRTMU), Nanded, (India). He worked as Lecturer and Assistant Professor in department of Electronics Engineering at various engineering colleges in North Maharashtra University, Jalgaon and Pune University, (India). Presently he is working as Principal, NIT’s Late Annasaheb patil Polytechnic, Panchavati, Nashik, (India). He is member of ISTE. He has been recognized as a P.G. Teacher by University of Pune in the state of Maharashtra (India). He has been published paper in various international and national journals and conferences.
Dr. Navinchandra G. Shimpi completed his Ph. D in Polymer from North Maharashtra University, Jalgaon MS India. Presently, he is working as a Head & Assistant Professor in the Department of Nanoscience and Technology, University Institute of Chemical Technology, North Maharashtra University, Jalgaon. He has published more than forty research papers in International and National journal of good impact factor. Besides this, he has presented more than forty papers in international and thirty research papers in national conferences. He has filled three Indian patents and one is granted. Dr. Navinchandra Shimpi has organized nine conferences and staff development program in the capacity of Convener and Coordinator. His area of research is synthesis and characterization of nanomaterials, conducting polymers, biodegradable polymers, rubber nanocomposites, carbon nanotubes etc. In his supervision thirteen students.