5
IV
April 2017
Technology (IJRASET)
An Approach to Reduce Non-Value Added Time
and Improve Process Cycle Efficiency by
Implementing Project Information System
Sagar S. Mehta1, Prasad S. Puranik2, Ankit V. Vaishnav3
1PG Student –Department of Mechanical Engineering, Atmiya Institute of Technology and Science 2Head of Department, Department of Mechanical Engineering, Atmiya Institute of Technology and Science 3Assistant Professor, Department of Mechanical Engineering, Atmiya Institute of Technology and Science,
Abstract: This paper depicts how Project Information System was used to eliminate Non Value Added Time in a manufacturing plant. A current Process Cycle Efficiency was measured and data for constructing the present Process Cycle Efficiency was collected through production line visits, interviews of employees and observation of machine’s function at different production stages. Different causes of Non Value Added Time was determined. Regression analysis with the help of Minitab software were applied to evaluate most affected causes of Non Value Added Time. At present, Process Cycle Efficiency was found 63.47%. In order to improve Process Cycle Efficiency and to Reduce Non Value Added Time it was proposed to implement Project Information System, it was evaluated that future state Process Cycle Efficiency would be improved to 70.88% at initial stage. Keywords: Process Cycle Efficiency, Non Value Added Time, Project Information System
I. INTRODUCTION
Development of project consists of many complications. All the parts of project is very sensitive and accurate. So for the development of project highly accurate instruments are used. The accuracy required for all the parts should be greater than 3 (Sigma). Project is developed by passing through different processes known as Process Cycle. Process Cycle allows the specification of task dependencies and their inter-relationship and then controls the execution of that process specification.
Current Process Cycle takes more time than estimated time, in which Non Value Added Time (NVAT) takes more time than estimated time. So, to reduce Non Value Added Time (NVAT) and to Improve Process Cycle Project Information System (PIS) was Implemented.
Project Information Systems (PIS) is software applications that help managers track projects from their conception to their execution. Project Information System (PIS) manage the process cycle and information right from designing to testing of mechanical parts of project. By means of computer software and network all the integration activities will be displayed on each computer with its progress, location, responsible person for each activity etc.
By implementing Project Information System (PIS), existing process will be simplified, decrease in Non-Value Added Time (NVAT) and reduction in loss of data. This results into increase in overall efficiency and output.
II. LITERATURESURVEY
To identify the causes of non-value added times and manufacturing waste, to reduce the lead time and to improve the process cycle efficiency. Throughout this study the existing manufacturing line was assayed by using Value Stream Mapping, where current cycle time, lead time, and non-value added time were found; thereby the present process cycle efficiency to reduce total manufacturing cycle time [1].
non-Technology (IJRASET)
value adding (NVAT) activities were find out and try to improve process cycle efficiency [3].The production flow was optimized thus minimizing several non-value added activities/times such as bottlenecking time, waiting time, material handling time, etc. In general, the various components associated with the lead time of any production process are (i) Waiting time before process (ii) Setup time (iii) Process time (iv) Waiting time after process (v) Transfer time. It focuses the revamp of operations by eliminating non value-added time and improving cycle efficiency [4].
Project management is characterized as an effort that result from the use of knowledge, skills, tools and techniques applied to set project activities in order to meet project objectives. With the growing number of different business projects, the need to support people involved in task related to project management is becoming increasingly important. Timely and accurate data about projects plan, their progress and relative cost, are extremely important for project managers and consequently for assuring the success of the project. However this kind of information system is relatively expensive and therefore out of reach for many small and medium enterprises that often choose not to use them. As a way to overcome this situation many consulting companies decide to invest in the development of their own PIS [5].
Personal projects are any kind of projects whose management is left to an individual untrained in project management and is greatly influenced by this individual’s personal touch. This includes the majority of knowledge workers who daily manage information relating to several personal projects. The aim is to reveal and understand project information management practices in details and provide guidelines for personal project management tools [6].
An important function offered by a Project Management Information System is the possibility of sharing data concerning the running projects across the project team and their surroundings. Application of project management methods is made easier by software applications which lead to a decrease in the time demands of project management, simplification of the process of implementation of the respective method, and also an increase in the success rate of project implementation. Project management software application lead to decrease in time demands of project management, simplification of the process of implementation also increase in success rate of project implementation [7].
The software applications that allow individuals or teams to track projects from their conception to their execution, providing project managers and other team members with pertinent information such as the scheduling of resources, budget management, supplier management, time management, task assignments, quality control, documentation and collaborative tools. The goal of PMIS is therefore to boost efficiency by making the development cycle more visible as long as all users are able to track specific tasks and can have a better understanding of how the project is going on [8].
The current business environment is complex. Managers need to make fast decisions, allocate scarce resources efficiently, and have a clear focus. In organizations that are engaged in many projects simultaneously, management is faced with multiple challenges. The aim of this study was to gain a better understanding of the elements of PMIS that contribute to adequate decision making in a multi project environment. Project Management Information Systems (PMIS) should provide project managers with decision making support for planning, organizing and controlling projects. PMIS information quality is positively related to quality of the decisions, satisfaction of project managers with PMIS [9].
Technology (IJRASET)
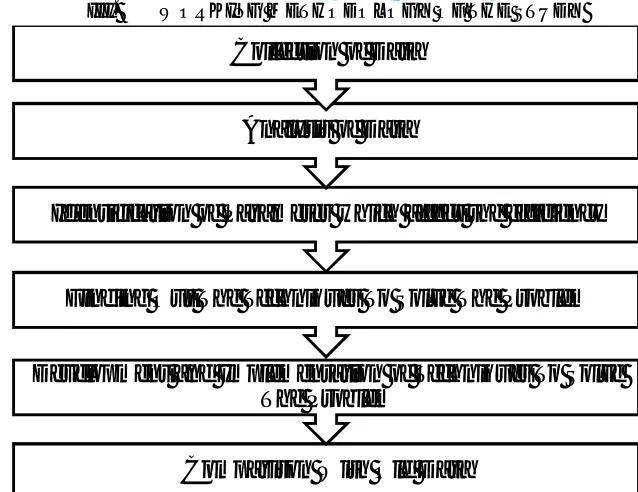
[image:4.612.148.467.77.323.2]III. WORKINGMETHODOLOGYOFTHESTUDY
Fig. 1: Complete Methodology of the study
A. Basic Project Development Cycle
Fig. 2: Sample Basic Project Development Cycle
B. Evaluation of Time Study for Project Processes
As project consists of large numbers of parts and theses large number of parts are developed by different processes. So, to find out and improve the efficiency of Project Development Cycle one method is followed known as Process Cycle Efficiency.
1) Cycle Time (CT): Cycle time is the total time from the beginning to the end of process. Cycle time includes process time, setup time, part loading time, part unloading time, move time of part and delay time.
= + + + + +
Also,
= +
Where,
CT = Cycle Time PT = Process Time ST = Setup Time
Comparison With Old Data
Development and Implementation of Techniques To Solve
The Problem
Finding Out The Techniques To Solve The Problem
Identification of Parameter which affect the efficiency
Analysis of Data
Collection of Data
Testing
Integration
Post Processes
Manufacturing
[image:4.612.153.466.367.521.2]Technology (IJRASET)
LT = Loading TimeUT = Unloading Time MT = Move Time DT = Delay Time
VAT = Value Added Time NVAT = Non-Value Added Time
2) Value Added Time (VAT): This is the amount of time it takes to actually produce the product. Obviously, production time is a value added time because it creates a product from raw materials.
=
3) Non-Value Added Time (NVAT): Non-value added time is amount of the production cycle time that does not directly produce
product or part. The non-value added time is the sum of setup time, loading time, Unloading time, Move time and Delay time.
= + + + +
4) Process Cycle Efficiency (PCE): Process Cycle Efficiency is a metric useful for prioritizing improvement opportunities. Calculating process cycle efficiency begins with identifying those areas that do not contribute to the value of the product. This typically can be done using a value stream map. Process Cycle Efficiency helps to formulate an action plan to eliminate the Non-Value added time. It also helps to identify the causes of unexpected Non-Value added time that results in the long lead time and lower Process Cycle Efficiency.
The Process Cycle Efficiency can be defined as the percentage ratio of Value added time and cycle time (Zhen, 2011; Rajenthirakumar et al., 2011). Mathematically it is denoted as following –
PCE (η) = 100 %
Where,
VAT = Value Added Time CT = Cycle Time
However, to improve the PCE, the Non-value added time should be reduced, which is the objective of this study. Project which is consider or choose for study consists of total 184 parts or components.
From that 18 components are carried out for detail study due to limitation of time.
Table 1: Selected component’s time duration table Sample Part No. Process Time (Min.) Setup Time (Min.) Move Time (Min.) Loading Time (Min.) Unloading Time (Min.) Delay Time (Min.) Total Cycle Time (Min.)
SBP117 9173 132 39 11.5 9.5 1919 11284
SBP120 8956 105 48 9 8.5 4164 13290.5
SBP136 504 40 29 7.5 7.5 2461 3049
SBP141 7976 91 52 14 13 7315 15461
SBP146 8235 122 55 10.5 9.5 2158 10590
SBP149 8838 113 33 11 9 4623 13627
SBP151 8989 94 31 7.5 7 4302 13430.5
SBP153 8934 78 47 12 11 1675 10757
SBP155 8907 75 34 10 9 4956 13991
SBP158 8368 69 42 9.5 8 4632 13128.5
SBP160 2295 95 31 9 8 6569 9007
SBP164 8371 117 50 11 10 3907 12466
SBP167 8871 99 54 12 10.5 5796 14842.5
SBP178 8355 86 44 11.5 9.5 4200 12706
Technology (IJRASET)
SBP181 9248 127 43 11.5 9.5 3814 13253
SBP183 8259 126 57 10.5 9.5 4359 12821
SBP184 9104 76 50 12 11 3286 12539
Total Time (Min)
142358 1753 777 191.5 170 74756 220005.5
IV. REGRESSION
Regression analysis is a way of mathematically sorting out which of the variables does indeed have an impact. Regression attempts to determine the strength of the relationship between one responder (usually denoted by Y) and a series of other changing variables. Regression analysis is a form of predictive modelling technique which investigates the relationship between responder and continues predictor. This technique is used for forecasting, time series modelling and finding the causal effect relationship between the variables.
There are multiple benefits of using regression analysis. They are as follows:
It indicates the significant relationships between dependent variable and independent variable. It indicates the strength of impact of multiple independent variables on a dependent variable.
[image:6.612.96.525.76.177.2]Regression is carried out on Minitab 17. Fit Regression is carried out because fit regression model relationship between one responder and nos. of continuous predictors:
Figure 3: Regression analysis result
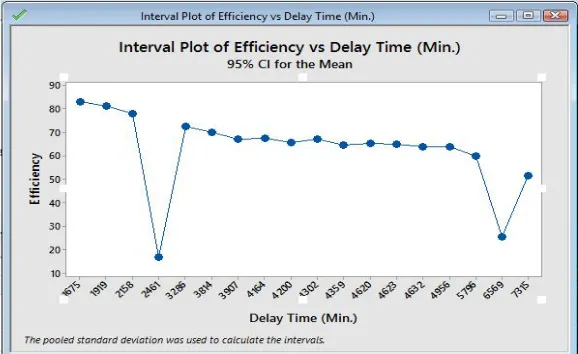
From result it can be found out that the most affected time in payload development cycle is process time and delay time also found out that by modification in delay time, efficiency will be increased.
Analysis of Variance (ANNOVA):
[image:6.612.161.450.524.701.2]Technology (IJRASET)
One way analysis of variance (ANNOVA), is carried out to get response of continuous responder on particular predictor. Here responder is Efficiency and factor (continuous predictor) is Delay Time.
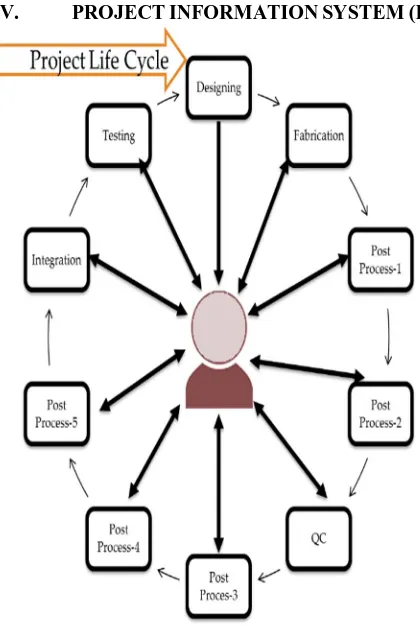
[image:7.612.202.412.112.425.2]V. PROJECTINFORMATIONSYSTEM(PIS)
Figure 5: Existing situation
The current business environment is complex. Managers need to make fast decisions, allocate scarce resources efficiently, and have a clear focus. With the growing number of different business projects, the need to support people involved in task related to project management is becoming increasingly important. Timely and accurate data about projects plan, their progress and relative cost, are extremely important for project managers and consequently for assuring the success of the project.
Application of project management methods is made easier by software applications which lead to a decrease in the time demands of project management, simplification of the process of implementation of the respective method, and also an increase in the success rate of project implementation.
Project Information Systems (PIS) are software applications that help managers track projects from their conception to their execution. The goal of PIS is therefore to boost efficiency by making the development cycle more visible as long as all users are able to track specific tasks and can have a better understanding of how the project is going on.
Project Information System is an Online Web Based Computer application used for Monitoring the Progress of different activities of Project from Planning to Execution stage. Timely and accurate data about projects plan, their progress and relative cost, are extremely important for project managers and consequently for assuring the success of the project.
PIS manage the workflow and information related to design and fabrication of Mechanical parts for project.
By means of computer software (Eclipse) and network all the integration activities will be displayed on each computer with its progress, location, responsible person for each activity etc.
A. How Project Information System works:
Technology (IJRASET)
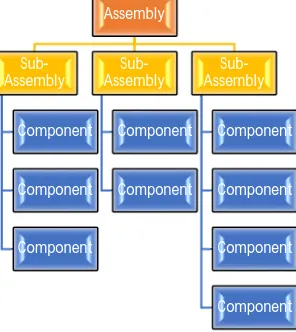
Figure 6: Hierarchy of Project
A. Project Information System Consists of four steps
1) Design
2) Fabrication
3) Integration
4) Testing
a) Design: In Design step, user can select the component and upload the drawing file.
b) Fabrication: In Fabrication step, by selecting the component from the tree of projects, the design of component will be shown. To raise card, select the manufacturing processes and post processes from template and fill the necessary details. As job-card is raised, it shows on saved job-job-card tab with its status. Also during the process, user is able to search the component and view its status. After completion of process, there is functionality to attach report file of QC and QA.
c) Integration: After completion of fabrication, user can select the components required for integration and select the tools, fasteners and materials required for integration accordingly. Also during the process, user is able to search the component and view its status. After completion of integration, there is functionality to write or attach remarks for testing, if any.
d) Testing: Last step is testing, for this, user have to raise job-card, select the assembly from the tree of project, followed by the selection of the test to be performed on assembly and filling the necessary details. As job-card is raised, it shows the details of test with its current status. Also during the process, user is able to search the component and view its status. After completion of test, there is functionality to attach report file of testing.
Fig. 7: Project Design Database Model Assembly
Sub-Assembly
Component
Component
Component Sub-Assembly
Component
Component Sub-Assembly
Component
Component
Component
Component
Design
Testing
Integration
[image:8.612.133.492.507.705.2]Technology (IJRASET)
A Project Information System is typically a computer- driven system to aid a project manager in the development of the project. A Project Information System can calculate schedules, expectations, and results. The goal of a PIS is to automate, organize, and provide control of the project processes.
Project Information System (PIS) are system tools and techniques used in project management to deliver information. Project Management Information System (PIS) is used by upper and lower management to communicate with each other.
It is an automated system to quickly create, manage, and streamline the project management processes. In the develop portion of the project, the PIS can be used to help the project team create the schedule, estimates, and to gather feedback.
The PMIS also control, track, and manage any changes to the project. Project Information System (PIS) help plan, execute and close project management goals. The Project Information System is also used to create a specific schedule and define the scope baseline. Project Information System is a tool used to document and store the project management plan, subsidiary plans and other documents / work products relevant for the project.
The use of a PIS for all information about a project and regularly updating this information based on the actual status: helps in successful monitoring and control. A comprehensive PMIS would cover the complete life- cycle of a project and would provide the necessary support for decision making.
Systems vary greatly in the style of system documentation, thoroughness and clarity of tutorials, ease of information input, clarity of on-screen presentation and report format, helpfulness of error messages, and the training and operating support offered by the developer.
B. Key Features
1) Secure system
2) Information about any project can be seen from Organization anywhere anytime
3) Helps in monitoring of the project
4) Helps in timely execution of work
5) Reduced paper work
6) Scheduling activities
7) Target dates based on the project schedule
8) Reporting functionality
VI. TESTINGANDIMPLEMENTATIONOFPROJECTINFORMATIONSYSTEM A. Software Requirements
1) Windows 7 or higher version
2) Intranet Facility
3) Platform: java
4) Database: My SQL
B. Hardware Requirement
1) Workstation with Platinum 4 or higher version C. Pre-test the database
The project team should practice in the test database to confirm that all information is accurate and working correctly. Use a full week of real transaction data to push through the system to validate output. Make sure all necessary interfaces are designed and integration issues are resolved to ensure the software works appropriately.
D. Final Testing
Make sure the actual Standard Operating Procedures works properly or not and determine whether modifications need to make. The project team needs to perform a final test on the data and make any needed adjustments.
E. Implementation
Technology (IJRASET)
Information System (PIS) software solutions to improve operations and provide faster response. Choosing a PIS that meets specific business requirements will enable to have a smoother implementation. A well designed implementation plan is the key to success. For Implementation training was given to employees regarding awareness about Project Information System.
VII. RESULTANDCONCLUSION
After Implementation of Project Information System at an initial stage it was found that mostly affected parameter i.e. Delay Time of selected components were 55843 min. compared to old collected data were 74756 min. So, Process Cycle Efficiency was increased from 63.47% to 70.88%.
REFRENCES
[1] Hossain Monir Md, et al. “Lead Time Reduction and Process Cycle Improvement of an Ice-cream Manufacturing Factory in Bangladesh by Using Value Stream Map and Kanban Board.” Australian Journal Of Basic and Applied Sciences (2016)
[2] Hossain, Md Monir, and M. Kamal Uddin. "An Approach to Improve the Process Cycle Efficiency and Reduce the Lead Time of a Mango Juice Processing Line by Using Lean Tools: A Case Study."
[3] Hossain, Md Monir, and M. Kamal Uddin. "A Case Study to Reduce the Manufacturing Waste Prior to Improve the Productivity Factors of a Litchi Juice Production Plant by Using Value Stream Map and Six Sigma Scale." International Journal of Scientific & Engineering Research 6.9 (2015): 1895-1905. [4] Rajenthirakumar, D., P. V. Mohanram, and S. G. Harikarthik. "Process cycle efficiency improvement through lean: a case study." International Journal of Lean
Thinking 2.1 (2011): 46-58.
[5] Teixeira, Leonor, et al. "Analysis and Design of a Project Management Information System: practical case in a consulting company." Procedia Computer Science 100 (2016): 171-178.
[6] Copic Pucihar, Klen, et al. "An empirical study of long-term personal project information management." Aslib Journal of Information Management 68.4 (2016): 495-522.
[7] Kostalova, Jana, Libena Tetrevova, and Jan Svedik. "Support of Project Management Methods by Project Management Information System." Procedia-Social and Behavioral Sciences 210 (2015): 96-104.
[8] Braglia, M., and M. Frosolini. "An integrated approach to implement project management information systems within the extended enterprise." International Journal of Project Management 32.1 (2014): 18-29.
[9] Caniëls, Marjolein CJ, and Ralph JJM Bakens. "The effects of Project Management Information Systems on decision making in a multi project environment." International Journal of Project Management 30.2 (2012): 162-175.
[10] Lee, Seul-Ki, and Jung-Ho Yu. "Success model of project management information system in construction." Automation in construction 25 (2012): 82-93. [11] Raymond, Louis, and François Bergeron. "Project management information systems: An empirical study of their impact on project managers and project