R E S E A R C H
Open Access
A comparative evaluation of hybrid error
correction methods for error-prone long
reads
Shuhua Fu
1, Anqi Wang
1and Kin Fai Au
1,2,3*Abstract
Background:Third-generation sequencing technologies have advanced the progress of the biological research by generating reads that are substantially longer than second-generation sequencing technologies. However, their notorious high error rate impedes straightforward data analysis and limits their application. A handful of error correction methods for these error-prone long reads have been developed to date. The output data quality is very important for downstream analysis, whereas computing resources could limit the utility of some computing-intense tools. There is a lack of standardized assessments for these long-read error-correction methods.
Results: Here, we present a comparative performance assessment of ten state-of-the-art error-correction methods for long reads. We established a common set of benchmarks for performance assessment, including sensitivity, accuracy, output rate, alignment rate, output read length, run time, and memory usage, as well as the effects of error correction on two downstream applications of long reads: de novo assembly and resolving haplotype sequences.
Conclusions:Taking into account all of these metrics, we provide a suggestive guideline for method choice based on available data size, computing resources, and individual research goals.
Background
Biomedical research has been revolutionized by the ad-vent of single-molecule long-read sequencing technolo-gies, also termed Third Generation Sequencing (TGS) [1]. The leading platforms are Pacific Biosciences (Pac-Bio) and Oxford Nanopore Technologies (ONT).
Com-pared to Second Generation Sequencing (SGS)
technologies that produce 100-700 bp reads, PacBio reads are on average > 10 kb, with maximum read lengths over 60 kb [1–3]. The ONT platform produces even longer reads at average of > 20 kb, with maximum read length > 800 kb [4–8]. The long read (LR) length of TGS data is particularly useful to address some of the problems that SGS short reads (SRs) fail to address due to genome complexity or combinatorial genomic events
[9, 10]. For example, LRs can substantially reduce the
ambiguity of read alignment at highly repetitive genomic
regions and uncertainty in genome or transcriptome as-sembly [11]. In addition, PacBio data have been reported to exhibit fewer GC biases compared to Illumina plat-forms because it does not rely on PCR [12]. Moreover, the single-molecule sequencing feature of TGS allows the study of genetic variations and epigenetic modifica-tions with single molecule resolution [1,13,14]. A great number of laboratories have applied TGS technologies to different research areas, including biomedical re-search, plant and animal sciences, and microbial ge-nomes [15–19]. With the increasing accessibility, declining cost as well as more demonstrated utilities, the number of TGS applications is expanding exponentially (Additional file1: Figure S1).
A caveat of the single-molecule sequencing with TGS platforms is the low signal-to-noise ratio and thereby a high error rate in base calling. The error rates of PacBio and ONT data can be up to 15% and 40% [20, 21], re-spectively, which are nearly two orders of magnitude greater than that of SGS technologies [22]. These high error rates pose considerable barriers for downstream data analyses, in particular for single nucleotide analyses * Correspondence:[email protected]
1Department of Internal Medicine, University of Iowa, Iowa City, IA 52242,
USA
2Department of Biostatistics, University of Iowa, Iowa City, IA 52242, USA
Full list of author information is available at the end of the article
(e.g., single nucleotide variant (SNV) calling and splice site determination) [22]. Therefore, error correction serves as a crucial step to improve data analysis and ap-plication. It is worth noting that most current TGS gen-ome assembly tools include a built-in error-correction stage prior to assembly, which further demonstrates the importance of error correction [23,24].
Since 2012, a number of error correction methods have been developed and generally fall into two categories: self correction and hybrid correction. The self-correction strategy corrects error-prone LRs by generating a consen-sus from a constructed layout of LRs. The built-in self-correction modules by PacBio and ONT output con-sensus of LRs from the same DNA molecule, which are termed Circular Consensus Sequencing (CCS) reads (Pac-Bio) or 2D reads (ONT) [1,25]. In the open-source soft-ware PBcR, the self-correction mode corrects erroneous regions using the consensus of overlapping LRs [23]. LoRMA polishes reads using long-distance dependencies from multiple alignments after employing an iterative de-Bruijn-graph-based approach with increasing k-mer lengths [26]. However, the self-correction strategy is not feasible for LRs with low coverage. By contrast, the hybrid-correction strategy, which utilizes high-accuracy and cost-effective SR data, can rescue more LRs, especially the low-coverage LRs. Based on algorithm design, hybrid-correction methods can be classified into three classes: alignment-based, graph-based, and dual align-ment/graph-based (dual-based).
The alignment-based methods map SRs or sequences assembled from SRs to error-prone LRs and compute a consensus. pacBioToCA was the first hybrid-correction method and implemented as a part of Celera Assembler [27]. LSC increases the sensitivity of SR-LR alignment by applying homopolymer compression transformation to SRs and LRs prior to alignment [28]. Proovread per-forms an iterative procedure for alignment and correc-tion with successively increasing sensitivity [29]. Nanocorr and ECTools correct LRs with SRs or SR-assembled unitigs, respectively, both of which are op-timized using the longest increasing subsequence algo-rithm [30,31].
The graph-based methods construct a de Bruijn graph by SRs, followed by searching for matched paths to LRs for correction. LoRDEC maps LRs to the de Bruijn graph based on sharedk-mers [32]. Jabba seeks maximal exact matches (MEMs) between largerk-mers in LRs and a de Bruijn graph [33]. FMLRC builds an FM index from Burrows-Wheeler transform (BWT) of SR data and cor-rects erroneous regions in LRs by seeking paths in a de Bruijn graph via two passes with short and long k-mers respectively [34].
In addition, a few error correction tools exploit both strategies. CoLoRMap corrects LRs by finding a sequence
in an overlapping graph that is constructed by mapping SRs to LRs; CoLoRMap also corrects regions without SR alignment by local assembly of unmapped SRs if they have mapped mates [35]. HALC aligns SR-assembled contigs to LRs, splits aligned contigs and the corresponding LR re-gions to construct a contig graph, corrects LRs by seeking paths representing alignments with minimal total edge weight, and refines repeat regions in LRs with SRs using LoRDEC [36].
Among the abovementioned methods, Jabba, ECTools, and pacBioToCA are known to discard uncorrected bases, trim, and output parts of LR data, resulting in low throughput (i.e., termed “selective methods,” underlined in the figures below).
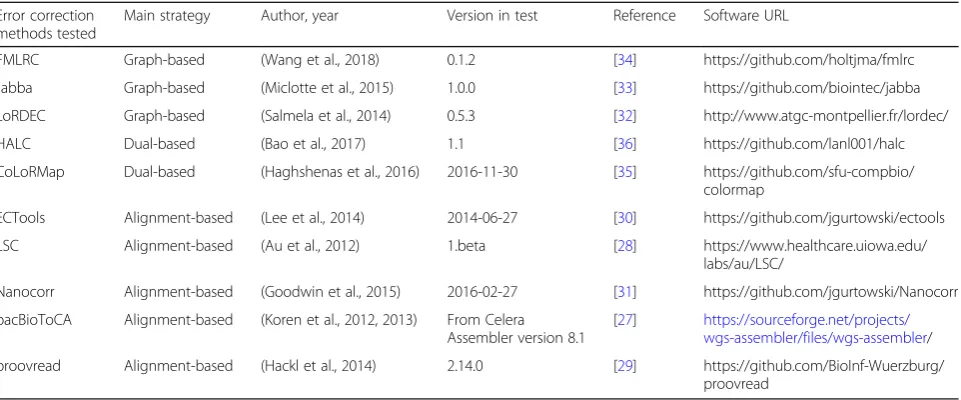
Here, we present a comparative performance assess-ment of the ten available state-of-the-art error correc-tion methods (Table 1, Additional file 2: Note 1). The objective was to establish a common set of benchmarks and to provide suggestive guideline on software choice based on data size, research interest, and computing re-source requirement. The methods were evaluated in multiple dimensions, including sensitivity, accuracy, out-put rate, alignment rate, outout-put read lengths, run time, and memory usage, as well as the effects of error correc-tion on two downstream applicacorrec-tions of LRs: de novo assembly and resolving haplotype sequences.
Data and computing settings
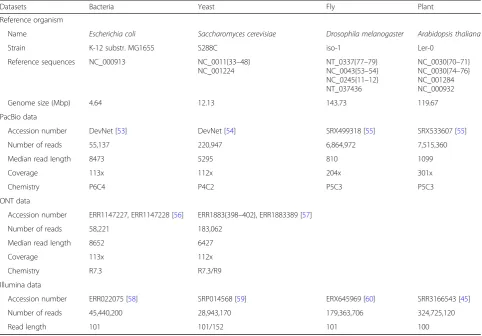
We compared the performance of ten error correction methods on datasets from four model organisms with different genome sizes. Herein, we refer to the Escheri-chia coli and Saccharomyces cerevisiae datasets as “small” datasets that were produced by the PacBio or ONT platform, andDrosophila melanogaster and Arabi-dopsis thaliana datasets as “large” datasets that were produced by the PacBio platform (Table 2). To investi-gate the effect of SR coverage on error correction per-formance, we generated random subsets of each SR dataset with coverages of 5×, 20×, 50×, 75×, and 100×.
All experiments were run on servers with 20 machines of 16 cores and 256 G memory.
Evaluation strategies
substitutions in the alignment divided by the length of aligned regions for each read [32].
The following evaluation statistics were computed:
Sensitivity: TP/(TP + FN) Accuracy: 1−error rate
Output rate: the percentage of reads output from the original data
Alignment rate: the percentage of reads aligned to the reference genome relative to the output data Output read length: the lengths of output reads Run time: elapsed time consumed by the error
correction tool
Memory usage: peak memory taken by the error correction tool
In addition, we also examined the effects of error cor-rection by different methods on improving de novo as-sembly and resolving haplotype sequences.
For error correction methods that output split reads such as Jabba, ECTools, pacBioToCA, and Nanocorr, we applied the previously published sensitivity calculation strategy [36], i.e., TH × TP/(TP + FN), where TH is the ratio of the number of output bases relative to the total number of bases from initial reads.
Error correction methods with run times greater than 20 days with twenty 16-core machines (i.e., maximal total elapsed time is ~ 3.46 × 10⁷s) were not included in the as-sessment below. The alignment-based methods ECTools and LSC required run times above this limit for the large datasets, and thus their performances were not included.
Results
Certain methods were not included in some cases for the following reasons. pacBioToCA crashed when it
was applied to the S. cerevisae PacBio data with SR
coverage of 75× or 100× and the S. cerevisae ONT
data with SR coverage of 50× or 75×. proovread crashed when it was applied to the S. cerevisae Pac-Bio data with SR coverage of 50×, 75×, or 100×. A tiny fraction (0.005%) of S. cerevisae ONT LRs were with length > 500 kb and were not included in evalu-ation by LoRDEC and HALC, owing to that both have a limit of input read length. LSC crashed on parts of S. cerevisae ONT data that had insufficient SR alignment, because LSC applies compression of homopolymer on SRs and LRs, while errors at homo-polymer were not as frequent among ONT LRs as PacBio LRs [39]. For the large datasets, ECTools and LSC were not included due to excessive run times, Nanocorr and proovread were not included due to memory usage issues, and pacBioToCA crashed with unidentified reasons. In each result section below, we first examined the performance on PacBio datasets, followed by ONT datasets.
Sensitivity
[image:3.595.59.540.98.298.2]Sensitivity is calculated as TP/(TP + FN), with TP being the number of erroneous positions that are corrected by error correction tool, and FN being the number of erroneous positions without correction (see details in “Evaluation strategies”). In general, most methods dem-onstrated increased sensitivity on correcting PacBio LRs with increasing SR coverage (Fig. 1, Additional file 3: Table S1a). Specifically, FMLRC, Jabba, LoRDEC, HALC, CoLoRMap, ECTools, and proovread improved dramat-ically with increasing SR coverage until they reached saturation (defined as a sensitivity gain of ≤0.03 im-provement). By contrast, LSC, Nanocorr, and pacBio-ToCA only demonstrated a mild increase in sensitivity Table 1References and software URLs of hybrid-correction methods for LRs
Error correction methods tested
Main strategy Author, year Version in test Reference Software URL
FMLRC Graph-based (Wang et al., 2018) 0.1.2 [34] https://github.com/holtjma/fmlrc
Jabba Graph-based (Miclotte et al., 2015) 1.0.0 [33] https://github.com/biointec/jabba
LoRDEC Graph-based (Salmela et al., 2014) 0.5.3 [32] http://www.atgc-montpellier.fr/lordec/
HALC Dual-based (Bao et al., 2017) 1.1 [36] https://github.com/lanl001/halc
CoLoRMap Dual-based (Haghshenas et al., 2016) 2016-11-30 [35] https://github.com/sfu-compbio/
colormap
ECTools Alignment-based (Lee et al., 2014) 2014-06-27 [30] https://github.com/jgurtowski/ectools
LSC Alignment-based (Au et al., 2012) 1.beta [28] https://www.healthcare.uiowa.edu/
labs/au/LSC/
Nanocorr Alignment-based (Goodwin et al., 2015) 2016-02-27 [31] https://github.com/jgurtowski/Nanocorr
pacBioToCA Alignment-based (Koren et al., 2012, 2013) From Celera Assembler version 8.1
[27] https://sourceforge.net/projects/ wgs-assembler/files/wgs-assembler/
proovread Alignment-based (Hackl et al., 2014) 2.14.0 [29] https://github.com/BioInf-Wuerzburg/
with SR coverage from 5× to 20×. This is likely because LSC, Nanocorr, and pacBioToCA can correct LR regions with low SR coverage after SR-LR alignment, while the methods utilizing a graph-based strategy (FMLRC, Jabba, LoRDEC, HALC, and CoLoRMap) require sufficient SR coverage to build the graph.
LoRDEC, HALC, and proovread reached sensitivity saturation at 20× SR coverage, while FMLRC and ECTools were at 50×. Depending on the LR dataset, CoLoRMap and Jabba saturated at high SR coverages of 20–50× and 75–100×, respectively (and beyond 100× for Jabba on the S. cerevisae and A. thaliana datasets). In terms of the saturation sensitivities, FMLRC dominated the other tools on all LR datasets (e.g., for E. coli 0.9808 vs. 0.3719–0.8897 and except A. thalianadataset). However, when only 5× SR cover-age was available, LoRDEC, HALC, CoLoRMap, LSC, Nanocorr, pacBioToCA, and proovread provided a higher sensitivity than FMLRC on the small datasets (0.1651–0.5458 vs. 0.0242–0.0749). pacBioToCA generally
had very low or the lowest sensitivity in most cases (0.2507–0.3719).
Overall, the sensitivities achieved with the E. coli Pac-Bio dataset (i.e., the smallest LR dataset) by most tested methods were generally greater than those on other datasets, with the exception of ECTools, which exhibited a slight higher saturation sensitivity with theS. cerevisae dataset (0.5458 vs. 0.4936). Jabba, ECTools, and pacBio-ToCA processed and output incomplete data, which may contribute to their lower sensitivities (0.0024– 0.8326 on the small datasets).
[image:4.595.57.540.99.435.2]With respect to SR coverage, the peak sensitivities of correcting ONT data generally were lower compared to PacBio data with the same size of LRs, with the excep-tion of FMLRC, LoRDEC, HALC, and proovread (Add-itional file 1: Figure S2, Additional file 3: Table S1b). Similar with the results of the PacBio data, the sensitiv-ities for E. coli ONT dataset were mostly higher than those forS. cerevisaeONT dataset, with the exception of ECTools (e.g., 0.3502 vs. 0.3896 with 100× SRs).
Table 2Datasets used in performance assessment
Datasets Bacteria Yeast Fly Plant
Reference organism
Name Escherichia coli Saccharomyces cerevisiae Drosophila melanogaster Arabidopsis thaliana
Strain K-12 substr. MG1655 S288C iso-1 Ler-0
Reference sequences NC_000913 NC_0011{33–48}
NC_001224
NT_0337{77–79} NC_0043{53–54} NC_0245{11–12} NT_037436
NC_0030{70–71} NC_0030{74–76} NC_001284 NC_000932
Genome size (Mbp) 4.64 12.13 143.73 119.67
PacBio data
Accession number DevNet [53] DevNet [54] SRX499318 [55] SRX533607 [55]
Number of reads 55,137 220,947 6,864,972 7,515,360
Median read length 8473 5295 810 1099
Coverage 113x 112x 204x 301x
Chemistry P6C4 P4C2 P5C3 P5C3
ONT data
Accession number ERR1147227, ERR1147228 [56] ERR1883{398–402}, ERR1883389 [57]
Number of reads 58,221 183,062
Median read length 8652 6427
Coverage 113x 112x
Chemistry R7.3 R7.3/R9
Illumina data
Accession number ERR022075 [58] SRP014568 [59] ERX645969 [60] SRR3166543 [45]
Number of reads 45,440,200 28,943,170 179,363,706 324,725,120
Read length 101 101/152 101 100
Accuracy
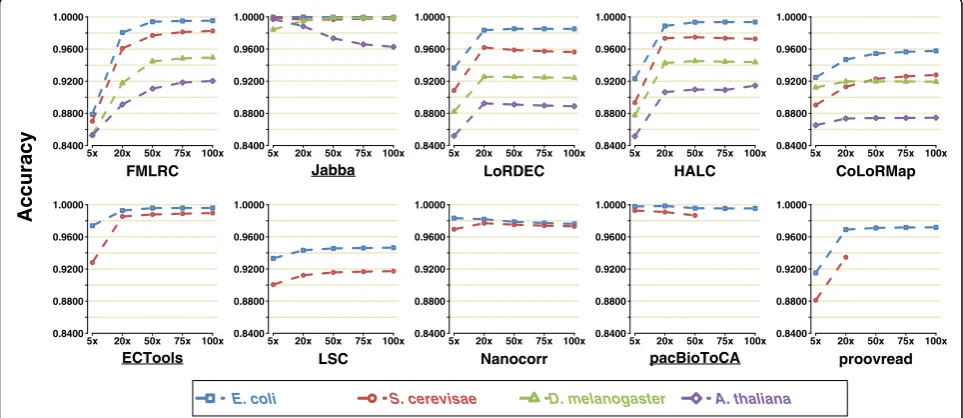
We next assessed the accuracy of the corrected PacBio LRs, where accuracy was computed as 1−error rate (i.e., 1−sum of base numbers of insertions, deletions, and substitutions in the alignment divided by the length of aligned region for each read; see details in “Evaluation strategies”). For all methods except Jabba, Nanocorr, and pacBioToCA, accuracy increased with increasing SR coverage, and the accuracy patterns with respect to SR coverages were similar to the sensitivity results for each
method (Fig. 1 and Fig. 2, Additional file 4: Table S2a). Since Jabba outputs a selected proportion of LRs, the ac-curacy was the highest for all datasets and at all SR cov-erages including shallow 5× (e.g., ≥0.9996 and ≥0.9967 for E. coli and S. cerevisae datasets, respectively); this level of accuracy approaches the quality of Illumina data. Therefore, there is little additional benefit by increasing SR coverage for the accuracy of Jabba, though it is im-portant to note that sensitivity of Jabba was improved with more SRs. For the same reason, pacBioToCA was
0.0000 0.2000 0.4000 0.6000 0.8000 1.0000
5x 20x 50x 75x 100x
FMLRC 0.0000 0.2000 0.4000 0.6000 0.8000 1.0000
5x 20x 50x 75x 100x
Jabba 0.0000 0.2000 0.4000 0.6000 0.8000 1.0000
5x 20x 50x 75x 100x
LoRDEC 0.0000 0.2000 0.4000 0.6000 0.8000 1.0000
5x 20x 50x 75x 100x
HALC 0.0000 0.2000 0.4000 0.6000 0.8000 1.0000
5x 20x 50x 75x 100x
CoLoRMap 0.0000 0.2000 0.4000 0.6000 0.8000 1.0000
5x 20x 50x 75x 100x
ECTools 0.0000 0.2000 0.4000 0.6000 0.8000 1.0000
5x 20x 50x 75x 100x
LSC 0.0000 0.2000 0.4000 0.6000 0.8000 1.0000
5x 20x 50x 75x 100x
Nanocorr 0.0000 0.2000 0.4000 0.6000 0.8000 1.0000
5x 20x 50x 75x 100x
pacBioToCA 0.0000 0.2000 0.4000 0.6000 0.8000 1.0000
5x 20x 50x 75x 100x
proovread
E. coli S. cerevisae D. melanogaster A. thaliana
yti vi ti s n e S
Fig. 1Sensitivity of ten methods on four PacBio datasets using five SR coverages. For the methods that output untrimmed LRs, sensitivity was calculated as TP/(TP + FN), where TP is true positive and FN is false negative. For the methods that output split reads, sensitivity was calculated as TH × TP/(TP + FN), where TH is the ratio of the number of output bases over the total number of bases of original reads
0.8400 0.8800 0.9200 0.9600 1.0000
5x 20x 50x 75x 100x
FMLRC 0.8400 0.8800 0.9200 0.9600 1.0000
5x 20x 50x 75x 100x
Jabba 0.8400 0.8800 0.9200 0.9600 1.0000
5x 20x 50x 75x 100x
LoRDEC 0.8400 0.8800 0.9200 0.9600 1.0000
5x 20x 50x 75x 100x
HALC 0.8400 0.8800 0.9200 0.9600 1.0000
5x 20x 50x 75x 100x
CoLoRMap 0.8400 0.8800 0.9200 0.9600 1.0000
5x 20x 50x 75x 100x
ECTools 0.8400 0.8800 0.9200 0.9600 1.0000
5x 20x 50x 75x 100x
LSC 0.8400 0.8800 0.9200 0.9600 1.0000
5x 20x 50x 75x 100x
Nanocorr 0.8400 0.8800 0.9200 0.9600 1.0000
5x 20x 50x 75x 100x
pacBioToCA 0.8400 0.8800 0.9200 0.9600 1.0000
5x 20x 50x 75x 100x
proovread
E. coli S. cerevisae D. melanogaster A. thaliana
y c ar u c c A
[image:5.595.58.538.88.300.2] [image:5.595.57.539.485.694.2]also of high accuracy (≥0.9953 and ≥0.9866 for E. coli and S. cerevisaedatasets, respectively). However, it is in-teresting that the other selective method ECTools had relatively low accuracy at 5× SR coverage accuracy (0.9738 and 0.9281 for E. coli and S. cerevisae datasets, respectively), though the accuracy at ≥20× SR coverage was similar to Jabba. Altogether, these selective methods output high-accuracy LR fragments under sufficient SR coverage, although they fail to output whole datasets of full-length LRs. The trend and accuracy at saturating coverage levels with FMLRC were very similar to ECTools, though the relative accuracy of FMLRC at 5× SR coverage was far lower (< 0.88). LoRDEC, HALC, and Nanocorr comprised the intermediate group, with accuracy saturation ranging from 0.9619 to 0.9887 on the small datasets. CoLoRMap, LSC and proovread underperformed comparatively with accuracy saturations ranging from 0.9122 to 0.9718 on the small datasets.
It is worth noting that both sensitivity and accuracy reach to the saturated values at the same SR coverage for all methods except Jabba, ECTools, and Nanocorr. That is, it is possible to achieve the best sensitivity and accuracy simultaneously as long as sufficient SRs are provided.
For the non-alignment-based methods that can be ap-plied to all four PacBio datasets, they generally achieved greater or equivalent accuracies on the small datasets as compared to the large datasets. For unknown reasons, increasing SR coverage reduced the accuracy of Jabba with theA. thalianadataset.
Prior to correction, raw ONT LRs had lower accuracy compared to PacBio raw LRs (0.8221 vs. 0.8677 on E. colidata and 0.7959 vs. 0.8501 onS. cerevisae data), and such disadvantage of ONT data remained after error correction (except correction by the selective methods) (Additional file 1: Figure S3, Additional file 4: Table S2b). The output PacBio and ONT LRs by the selective methods had no substantial difference of accuracy on the small datasets, as they only trim and output high-quality fragments of LRs (0.9281–0.9999 vs. 0.9082–0.9999). Considering the other methods, the ac-curacy difference between corrected ONT and PacBio LRs decreased, with exception of LSC.
Output rate
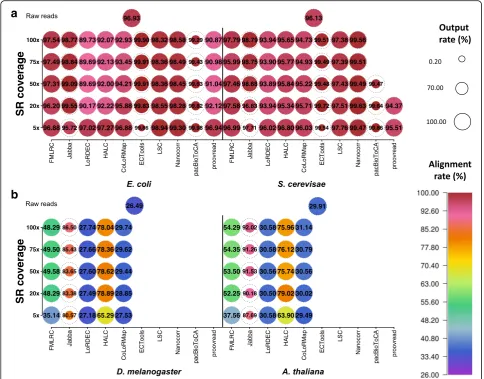
Errors are distributed randomly among LRs, and some LRs are so error-prone that they are hard to correct and thus may not be output by the error correction software [1]. Therefore, it is important to evaluate the amount of data remaining after error correction. When PacBio datasets were corrected, all methods, except for Jabba, ECTools, and pacBioToCA, output all or > 90% of input data (Fig.3, Additional file1: Figure S4a, Additional file5: Table S3a). Specifically, FMLRC, HALC, and CoLoRMap
output the whole dataset. LoRDEC and proovread only excluded a trivial number of reads (output rate: > 99.99% and ≥99.16%, respectively). LSC and Nanocorr lost a small amount of data (output rate: 94.17–97.16% and 92.84–95.70%, respectively) since these alignment-based methods may not be able to correct and thereby would not output LRs with no aligned SRs. In particular, the output rate with these methods did not depend on SR coverage and LR data size. Note that the output rate could be increased to 100% by changing the software de-sign and implementation to include both corrected and uncorrected LRs. A high output rate can allow users to maintain data for different research interests and exe-cute different data analysis strategies.
In contrast, the selective methods Jabba, ECTools, and pacBioToCA output only the trimmed reads with cor-rected regions, so their output rates were far lower than 100%. With an output rate of ~ 21% regardless of SR coverage, pacBioToCA generally had the lowest output rate among all tests and methods. Exceptions to this trend include Jabba at 5× SR coverage for all LR datasets (15.50–18.91%) except E. coli, and ECTools at 5× SR coverage for the small datasets (0.40–1.28%). With Jabba and ECTools, the output rate increased considerably be-tween 5× and 20× SR coverage and continued to in-crease until saturation at 50–75× and 20–50× SR coverage, respectively. However, these two methods still lost a significant amount of data even at saturation (e.g., output rate ~ 32% for Jabba on the large datasets).
When ONT datasets were corrected, FMLRC and CoLoRMap also output whole datasets, and the output rate of LoRDEC, HALC, and proovread was very high as well (≥97.77%) (Additional file1: Figure S4b and Figure S5, Additional file5: Table S3b). It should be noted that LoRDEC and HALC that uses LoRDEC as a module failed to correct LRs with lengths > 500 kb and therefore excluded a small portion of LRs onS. cerevisaedata. Ex-cept these high-output-rate methods, the other methods had lower output rates for ONT datasets than the corre-sponding PacBio datasets from the same species (0.22– 77.54% vs. 0.40–97.16%), as higher error rate of raw data resulted in fewer correctable LRs.
Alignment rate
high resolution at the single nucleotide level [41]. For the small datasets from the PacBio platform, the alignment rates were almost contrastive to the output rates: ECTools and pacBioToCA had the highest alignment rates (≥ 99.48% and ≥99.29%, respectively) though they had the poorest output rates; LSC and Nanocorr had intermediate alignment rates (≥97.38% and ≥98.28%, respectively), similar to their rank for output rate; FMLRC, LoRDEC, HALC, CoLoRMap, and proovread, which output all or almost all LRs, had the lowest alignment rates (95.51– 97.27% with 5× SR coverage) (Fig.3, Additional file1: Fig-ure S4a and FigFig-ure S6a, Additional file6: Table S4a). It is likely that Jabba, ECTools, and pacBioToCA selectively output high-quality LR fragments that were easy to align, while the high output-rate methods included uncorrected LRs that thus caused lower alignment rate. Overall, the
alignment-based methods (except proovread) tended to achieve higher alignment rates because their output LRs had been corrected by aligned SRs, which in turn could serve as the seeds to align the output LRs.
As SR coverage increased from 5× to 100×, the align-ment rates of LoRDEC, HALC, CoLoRMap, and proov-read all decreased by 1–7% with the small datasets. A similar yet smaller decrease (< 1%) in alignment rate with respect to SR coverage existed in LSC, Nanocorr, and pacBioToCA with the small datasets. As exceptions, the alignment rates of FMLRC, Jabba, and ECTools did not have a clear dependence on SR coverage.
The alignment rates for the graph-based methods were much lower for the large datasets as compared to the small datasets (Additional file 1: Figure S6b). Jabba achieved the highest alignment rates with the large datasets. As SR
a
b
[image:7.595.56.541.88.467.2]coverage increased, the alignment rates of LoRDEC and CoLoRMap increased mildly but were still at low values of ~ 30%. In contrast, the alignment rates for FMLRC, Jabba, and HALC improved strikingly with increasing SR cover-age, where Jabba was still highest at 86.50% and 92.02% withD. melanogasterandA. thalianadatasets, respectively. Because of the lower accuracy (Additional file4: Table S2b), raw ONT LRs had lower alignment rates than Pac-Bio raw LRs (74.02% vs. 96.93% on E. coli data and 57.64% vs. 96.13% on S. cerevisae data; see Additional file 6: Table S4b). After error correction, the output of most methods had much lower alignment rates of ONT data than the corresponding PacBio data from the same species (e.g., 74.30–82.64% vs. 96.20–97.54% on E. coli data by FMLRC), with the exception of the selective methods and Nanocorr that merely output parts of data-sets (Additional file1: Figure S5 and Figure S6c).
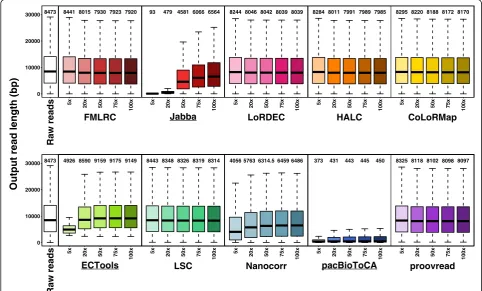
Output read length
LR length is the main advantage of TGS data for many ap-plications (e.g., genome assembly) [31]. Thus, we investi-gated how well the methods maintain the read lengths on PacBio datasets (Fig. 4, Additional file 1: Figure S7). All methods, except for the three selective methods and Nanocorr, output read lengths that were similar to the length of the input data (median length: 7920–8443 bp
output vs. 8473 bp input for E. coli dataset and
5006-5453.5 bp vs. 5295 bp for S. cerevisae dataset). The output read lengths generally mildly decreased as SR coverage increased since insertions are the main errors in PacBio data, i.e., the increasing SR coverage improved the accuracy, and the corrected reads with fewer insertion er-rors were slightly shorter [12]. In contrast, the selective methods output very distinct length profiles that were much longer or much shorter than input LRs, which oc-curred due to two reasons: (1) the selective methods merely output a small proportion of LRs and (2) they out-put trimmed reads with corrected regions. For the small datasets, Jabba output very short reads (median length: 93 bp forE. colidataset and 360 bp forS. cerevisaedataset) at 5× SR coverage and generally exhibited significant in-creases in output read lengths with increasing SR cover-age, which was consistent with the improved output rates (up to > 80%). Although the median output read length of ECTools was far shorter than the median input length (4926 bp vs. 8473 bp for E. coli dataset and 3627 bp vs. 5295 bp forS. cerevisaedataset) at 5× SR coverage, it sig-nificantly increased as SR coverage was increased from 5× to 50× and then saturated. The corresponding median read length at 50× SR coverage was much longer than the input read length (9159 bp forE. colidataset and 6403 bp forS. cerevisaedataset). In case of sufficient SR coverage,
8473
s
d
a
er
w
a
R
0 10000 20000
30000 8441 8015 7930 7923 7920
5x
20x 50x 75x 100x
FMLRC
93 479 4581 6066 6564
5x
20x 50x 75x 100x
Jabba
8244 8046 8042 8039 8039
5x
20x 50x 75x 100x
LoRDEC
8284 8011 7991 7989 7985
5x
20x 50x 75x 100x
HALC
8295 8220 8188 8172 8170
5x
20x 50x 75x 100x
CoLoRMap
)
p
b(
ht
g
n
el
d
a
er
t
u
pt
u
O
8473
s
d
a
er
w
a
R
0 10000 20000
30000 4926 8590 9159 9175 9149
5x
20x 50x 75x 100x
ECTools
8443 8348 8326 8319 8314
5x
20x 50x 75x 100x
LSC
4056 5763 6314.5 6459 6486
5x
20x 50x 75x 100x
Nanocorr
373 431 443 445 450
5x
20x 50x 75x 100x
pacBioToCA
8325 8118 8102 8098 8097
5x
20x 50x 75x 100x
proovread
[image:8.595.56.539.409.700.2]ECTools appeared to selectively remove some short LRs for an unknown reason. The median lengths of output reads by pacBioToCA were only 211–450 bp, and no sub-stantial improvement was observed with increasing SR coverage. pacBioToCA appeared to trim LRs into many small corrected pieces. Interestingly, Nanocorr also output shorter reads (longest median length: 6486 bp vs. 8473 bp forE. colidatasets and 3278 bp vs. 5295 bp forS. cerevisae dataset), and read length increased as SR coverage in-creased, similar to Jabba. However, Nanocorr output read length was generally longer than Jabba, especially for shal-low SR coverage (i.e., 5×). The output rate of Nanocorr was still around 95% as compared to the selective methods of 0.40–88.35% (Fig. 3). A possible explanation is that Nanocorr trimmed small fragments from each LR, such as the 5′and 3′termini where SR coverage is missing, the selective methods trimmed single reads into multiple cor-rected fragments. The remaining methods output intact reads including corrected and uncorrected regions.
As SR coverage increased, there was a mild trend of decreasing output ONT read length as E. coli PacBio dataset, by the methods except the selective ones, LSC and Nanocorr (Additional file 1: Figure S8). The overall output read lengths by LSC were much longer than the raw ONT LRs (median length: 9237–9263 bp vs. 8652 bp onE. coliONT data and 9367.5–9626 bp vs. 6427 bp on S. cerevisae ONT data), as longer ONT LRs had higher probability to have SR alignment for correction by LSC.
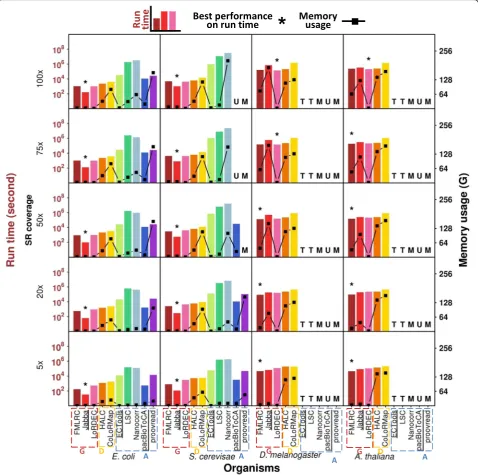
Run time
Run time is an important practical factor users need to consider before they apply an error correction method. For PacBio LRs, the graph-based methods generally proc-essed the small datasets with much shorter run time rela-tive to the alignment-based methods (magnitude of 10– 103s vs. magnitude of 102–107s) (Fig.5, Additional file1: Figure S9a, Additional file7: Table S5a). The differences were magnified with increasing SR coverage, i.e., the run times for the alignment-based methods were more dependent on SR coverage than the graph-based methods. The graph-based methods use SR-constructed graphs ra-ther than direct usage of SRs in correction. Graph size may not considerably enhance when SR data are sufficient, and also the graph construction stage is very time-efficient [42, 43]. SR coverage effect thereby is not as striking as the alignment-based methods on run time. Jabba outper-formed all other methods on the small datasets with dif-ferent SR coverage in terms of run time (only 32–1041 s), while FMLRC or LoRDEC had the shortest run times on the large datasets (44,312–202,940 s). Jabba has been pre-viously reported to use long run time on the large datasets [36]. As expected, the run times for the dual-based methods, HALC and CoLoRMap, were generally inter-mediate (e.g., magnitude of 103–104s for the small
datasets) between the graph-based and the alignment-based methods. Among the alignment-alignment-based methods, pacBioToCA required the shortest run time (e.g., 534– 29,956 s for the small datasets), though it crashed due to unidentified reasons when the input was higher coverage SR data (i.e., 75× and 100× for S. cerevisae data) or the large datasets. The alignment-based methods ECTools, LSC, Nanocorr, and proovread had much longer run times (magnitude of 104–107s) with the small datasets as com-pared to other methods. Among the slowest methods, in-put LRs were divided into small portions to run ECTools, LSC, and Nanocorr as the software manuals suggested. This protocol of splitting LRs for SR alignment separately has been reported to take longer total run time [44], so the run times of these methods may be overestimated. In particular, ECTools and LSC did not complete the large datasets by the 20-day run time limit; Nanocorr and proovread exceeded the memory usage limit of 256 G and crashed with higher SR coverage or the large datasets.
ONT LRs with the same data size as PacBio data gen-erally took less run time, e.g., the run time of E. coli
ONT and PacBio data by FMLRC was 119–944 s and
169–1072 s, respectively (Additional file 1: Figure S9b and Figure S10, Additional file7: Table S5b). Compared to PacBio data, ONT raw reads are of higher error rate and thus have more extremely erroneous regions [1] that are not correctable. Few SR-LR alignments or paths be-tween solidk-merscan be found at extremely erroneous regions and thus correction by the alignment-based methods or the graph-based methods was difficult. With the exception of the selective methods, the graph-based
methods still outperformed the alignment-based
methods on the ONT data (magnitude of 102–104s vs. magnitude of 104–107s), and the dual-based methods were between them (magnitude of 103–104s). This trend was the same as the PacBio data.
Memory usage
exceeded 180 G, majorly given to the storage of the en-hanced sparse suffix array [33].
The dual-based methods HALC and CoLoRMap generally were less memory-efficient than the graph-based methods (e.g., 19–118 G vs. 1–8 G on the small datasets) and some alignment-based methods (i.e., ECTools, LSC, and pacBioToCA for the small datasets (0.32–31 G)). Memory usage of HALC was
relatively stable for LR datasets regardless of SR coverage (19–36 G on the small datasets and 114– 142 G on the large datasets). The memory usage for CoLoRMap for the small datasets rose as SR cover-age increased and reached a plateau at 20× or 50× SR coverage (in the neighborhood of 82 G and 113 G for E. coli and S. cerevisae datasets, respectively), while it was of little dependence on SR coverage and
[image:10.595.59.538.89.564.2]maintained at high memory usage (122–165 G) for the large datasets.
Among the alignment-based methods, ECTools, LSC, and pacBioToCA were very memory-efficient. In particular, ECTools used the similar memory (≤4 G) as LoRDEC for the small datasets. However, two other alignment-based methods, Nanocorr and proovread, required a lot more memory (up to > 200 G for the small datasets) and their memory usage highly depended on LR data size or SR coverage. They crashed due to > 256 G memory usage with the large datasets; proovread also crashed with the S. cerevisae LR datasets at≥50× SR coverage.
Considering practical application, regular desktops with 32 G memory could be sufficient to run FMLRC, Jabba, LoRDEC, ECTools, and LSC for the small data-sets. By contrast, CoLoRMap, Nanocorr, and proovread required far more memory as SR coverage increased and High-Performance Computing (HPC) machines should be used. To run the large datasets, except that LoRDEC required only 2 G memory, HPC machines were re-quired for FMLRC, Jabba, HALC, and CoLoRMap (e.g., some cases even reached > 128 G memory usages).
Overall, ONT LRs had less memory usage than PacBio LRs (e.g., 5–33 G vs. 21–161 G on the small datasets by proovread) (Additional file 1: Figure S10 and S11b, Additional file 8: Table S6b). The memory
consuming method proovread did not crash on ONT data as PacBio data, perhaps because fewer SR-LR alignments could be obtained due to the lower accuracy of raw ONT LRs [1]. The graph-based methods were also memory efficient on ONT LRs (0.15–2 G for the small datasets).
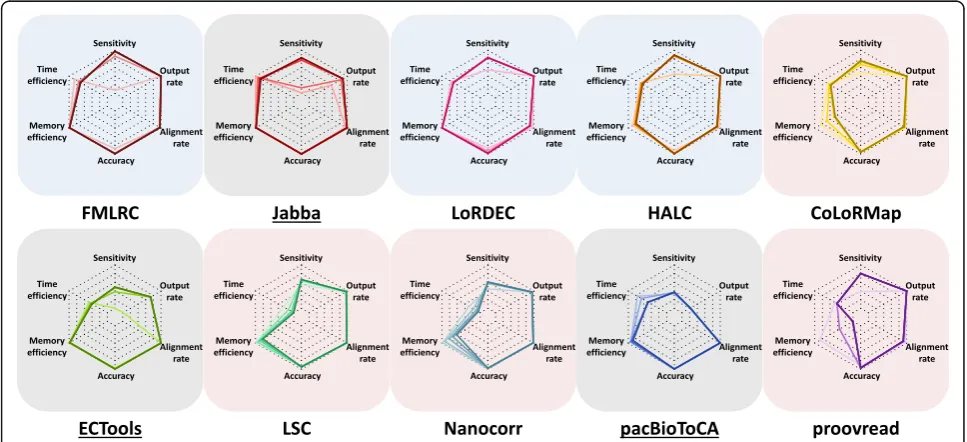
Overall performance
We here assessed the overall performance of the ten error correction methods by taking into consideration the metrics evaluated above. Using the E. coli PacBio dataset as an example, the methods were segregated into three groups: graph-/dual-based, alignment-/dual-based, and selective methods (Fig. 6). Generally, the graph-/ dual-based methods had better overall performance, and FMLRC had the best overall performance.
The graph-based methods FMLRC and LoRDEC together with the dual-based method HALC had very similar perfor-mances: superior sensitivity and accuracy, high output rate and alignment rate, and efficient memory usage (shaded in blue in Fig. 6). Their time efficiency was better than the others yet lower than Jabba, though Jabba only output part of the data. The only caveat was that sensitivity relied on SR coverage: their sensitivities were poor on 5× SR cover-age data, whereas 20× SR covercover-age was sufficient to achieve reasonable performance. In particular, FMLRC provided the highest sensitivity at 50× SR coverage. HALC required
[image:11.595.56.540.424.645.2]more memory usage as it is dual-based, and the alignment part may not be memory-efficient.
The second group consisted of the alignment-based methods LSC, Nanocorr, and proovread and the dual-based method CoLoRMap (shaded in pink in Fig.6). As compared to the first group, these tools had compar-able yet slightly lower sensitivities, accuracies, and out-put rates. However, their alignment rates were generally slightly higher, especially compared to LoRDEC and HALC (90.87–99.30% vs. 89.69–97.27%). The second group shared the drawback of poor computing effi-ciency. Except for LSC, the methods in this group re-quired high memory usage that increased dramatically with SR coverage. Because of the memory issue, Nano-corr and proovread failed in the large datasets. In addition, they all had exceptionally long run times. The run times for LSC (from 149,736 s to 3,266,168 s) and Nanocorr (from 120,518 s to 1,816,642 s) increased by one order of magnitude as SR coverage increased from 5× to 100×. Within this group, a specific weakness of Nanocorr was the relatively short output read length (Fig. 4) (range of median lengths: 4056–6486 bp for Nanocorr vs. 8097–8443 bp for the other members).
Output read length and output rate were notable is-sues for the selective methods (shaded in gray in Fig.6). Because these methods output a small subset of the data (i.e., very low output rate and sensitivity), they were memory efficient (0.35–20 G) and their output data were of high accuracy (0.9738–0.9999) and alignment rate (95.72–99.98%). However, run times were still long ex-cept Jabba (534–33,257 s vs. 32–161 s). It is worth noting that Jabba rescued the output rate and sensitivity with 75× SR coverage to approach the output rate and sensi-tivity of the other two groups of methods. While the in-creasing SR coverage improved the output rate of ECTools (from 1.28 to 72.95%), it could not improve the output rate of pacBioToCA (from 21.53 to 21.63%) but extended the run time (from 534 to 11,142 s).
As compared to the E. colidataset, the sensitivity and alignment rate decreased when larger PacBio LR datasets were applied (Additional file 1: Figure S12). The overall performance of the methods was very similar between the two small datasets. For the large datasets, the graph-based and the dual-based methods ran success-fully while the alignment-based methods failed. In par-ticular, the first group mentioned above maintained high accuracy and output rate. Although the overall perform-ance of all methods decreased for the large datasets, sev-eral graph-/dual-based methods still stood out on specific metrics, such as a high computing efficiency by LoRDEC and a relatively high alignment rate by Jabba and HALC.
Overall, high computing efficiency was a remark-able advantage for the graph-based methods over the
alignment-based methods, which is very likely due to the algorithm design [34]. On the other hand, the alignment-based methods could achieve reasonable performance with shallow SR coverage. The dual-based method HALC uses LoRDEC as a plugin and thus had similar performance to the graph-based methods, while the other dual-based method CoLoR-Map is similar to the alignment-based methods.
Most methods had similar performance on correcting ONT data with PacBio data, yet with lower alignment rate and accuracy (Additional file 1: Figure S13). Raw ONT LRs had lower accuracy, resulting in bigger chal-lenges of correction. We next analyzed the effects of error correction on two downstream applications: de novo assembly and resolving haplotype sequences.
Performance on improving de novo assembly
An important goal of error correction is to provide better-quality LRs for de novo assembly, so we also evaluated the error correction performance by ten error correction methods on improving de novo as-sembly (Additional file 2: Note 2, Additional file 9: Table S7). All assemblies were performed by Miniasm [45], a software that performed assembly without built-in error correction or consensus calling. There were some failures of assembly due to insufficient genome coverage of corrected LRs, including those by the selective methods, and LSC that crashed and only output parts of S. cerevisaeONT dataset (labeled with “NA” in Additional file 9: Table S7).
First, we assessed the number of assembled contigs that should be ideally close or equal to the number of chromosomes. When assemblingE. coligenome by Pac-Bio data, both raw and corrected LRs (except by the se-lective methods) generated similar numbers of contigs (1–3) with the number of chromosome (1). However, the assemblies of more complicated genomes (i.e., D. melanogaster and A. thaliana) by corrected LRs pro-duced a lot more contigs than the raw data, with an ex-ception of the selective method Jabba. The contig numbers assembled from ONT LRs were closed to those from the corresponding PacBio datasets.
bp using 100× SRs vs. 586,605 bp by raw reads). Interest-ingly, the corrected LRs mostly provided shorter N50 for the large datasets than raw LRs (e.g., 13,830–1,331,739 bp vs. 1,501,783 bp onA. thaliana data), given that hy-brid correction is harder for complex genomes and this process may introduce errors, resulting in misassemblies. Compared to PacBio LRs, the maximal N50 of assem-blies by the corresponding ONT LRs (with/without cor-rection) was shorter (e.g., 817,703 bp vs. 782,610 bp on S. cerevisaedata).
We next examined genome fraction that reflects completeness of assemblies. The assemblies on the Pac-Bio small datasets by the methods (including FMLRC, HALC, and CoLoRMap) with 100% output rate (Add-itional file5: Table S3a) had genome fractions closed or equal to 1. Although ECTools and pacBioToCA only output LR fragments selectively, they still achieved gen-ome fractions closed or equal to 1 with sufficient SR coverage (e.g., ≥50×). However, genome fraction by Jabba was low even using 100× SRs (0.82 onE. colidata and 0.51 onS. cerevisae data), albeit it had higher out-put rates than the other two selective methods (15.50– 88.35% vs. 0.40–73.00% on small PacBio datasets, Add-itional file5: Table S3a). Both raw and corrected LRs of the large datasets (except being corrected by Jabba) had higher genome fractions than the small datasets (1.07– 1.82 vs. 0.97–1.05), while those by Jabba remained very low (≤0.39). Assemblies on ONT LRs with correction generally had genome fractions lower than those by PacBio LRs (e.g., 0.93–0.98 vs. 1.01 onS. cerevisaedata by FMLRC).
The effect of ten hybrid-correction methods on contig sequence accuracy (i.e., 1−error rate of contig se-quences) was also evaluated. With hybrid correction prior to assembly, contig sequence accuracy was im-proved dramatically for all methods (e.g., forE. coli Pac-Bio data, assembly by raw data 0.8686 vs. corrected data 0.8828–0.9995, more details in Additional file 9: Table S7a). The improvement generally increased with SR coverage and tiny variance existed after saturation. Al-though the assembly by Jabba-corrected data provided the highest contig sequence accuracy in most cases, it should be noted that the corresponding genome fraction was very low.
Altogether, except the selective methods, assemblies by the other hybrid-corrected LRs improved contig numbers, N50, and genome fraction in most cases. Error correction methods except selective ones generally im-proved contig sequence accuracy that increased with SR coverage. The selective methods, especially Jabba, helped to achieved assemblies with highest contig sequence ac-curacy, while they sacrificed the assembly completeness and continuousness. However, with sufficient SRs, assemblies on the output of ECTools and pacBioToCA
could achieve genomic fractions close to 1. To date, a handful of algorithms have been developed to as-semble genomes with built-in error correction mod-ules [24, 46, 47].
Performance on correcting bases at heterozygous positions
Given that heterozygosity study is a crucial for diploid or polyploid organisms, we assessed the performance of TGS error correction methods on correcting bases at heterozygous positions of simulated human genomic data: paternal and maternal genomic LRs were corrected by randomly mixed SRs from these two haplotypes. We presented the results of FMLRC and LoRDEC here, as they were time- and memory-efficient to handle the hu-man data of large volume (Additional file 2: Note 3, Additional file10: Table S8).
Many errors at heterozygous positions of the simu-lated PacBio LRs remained uncorrected (6.19–12.36% false negative rate (FNR) in our tests), but also a number of correct bases at heterozygous positions were altered to errors by FMLRC or LoRDEC (5.66–13.32% false positive rate (FPR) in our tests). Both FPR and FNR of FMLRC increased substantially with SR coverage from 5× to 20×: FPR rose from 5.66 to 9.50% and FNR from 6.19 to 9.49%. On the contrary, FPR and FNR of LoR-DEC decreased from 13.32 to 5.96% and from 12.36 to 9.13%, respectively. That is, shallow SR coverage (e.g., 5×) is relatively beneficial for FMLRC to maintaining in-formation of haplotypes during correction whereas higher SR coverage (e.g., 20×) is favorable by LoRDEC.
FPR and FNR were higher for the simulated ONT LRs than those for the corresponding PacBio LRs (e.g., FPR: 9.51% vs. 5.66% by FMLRC with 5× SRs). It indicates that it is more challenging to maintain information of haplotypes when correcting ONT data. As SR coverage increased from 5× to 20×, FPR and FNR for the simu-lated ONT data corrected by FMLRC rose dramatically (from 9.51 to 14.26% and from 9.75 to 14.44%, respect-ively) as for the simulated PacBio data, while there was only mild difference for correcting the simulated ONT data by LoRDEC (from 15.91 to 14.77% and from 16.01 to 15.35%, respectively).
Although FMLRC and LoRDEC showed superior per-formance in the other evaluations, neither of them could recover/maintain true heterozygous bases in PacBio or ONT LRs with low FPR or FNR. Therefore, error cor-rection on heterozygous genomic LRs remains a tough problem, as shown in SGS genomic data previously [48].
Comparison between self correction and hybrid correction
Additional file 2: Note 4). Pass number is the number of raw reads (e.g., subreads) to generate corrected consensus (e.g., CCS reads). The accuracy of CCS reads with at least two passes was generally higher than subreads (median 0.9069–0.9961 vs. 0.8728), which increased as pass number increased and satu-rated at pass number of 5. Similarly, ONT 2D reads also generally had higher accuracy than the raw reads (named template reads) (median 0.8572 vs. 0.6807). It should be noted that the accuracy of 2D LRs was not high, because the accuracy of the raw ONT data is low and the maximal pass number for ONT data is only 2.
Using hybrid correction, PacBio reads reached a saturated accuracy with ≥50× SRs (median 1.0000), which was comparable to the saturated accuracy of PacBio CCS reads with ≥5 passes (median 0.9961). The accuracy of ONT 2D reads (median 0.8572) was generally between hybrid correction with 5× SR coverage (median 0.6867) and 20× SR coverage (me-dian 0.9526), while it was far lower than the
satu-rated accuracy with ≥50× SRs (median 1.0000).
Considering the trade-off between read length and pass number of PacBio CCS reads [1], and the rela-tively low accuracy of ONT 2D reads (median < 0.9), hybrid correction could be very helpful to obtain highly accurate LRs.
Discussions and future directions
Given the strengths of LR length and no requirement on PCR, use of TGS technologies will inevitably con-tinue to expand [1]. Since the corresponding high error rate is inherent to the low signal-to-noise ratio in single-molecule sequencing technologies, it will be hard to achieve the accuracy of SGS in the near fu-ture [39]. Thus, error correction prior to downstream data analyses is essential. Self correction and hybrid correction both can increase accuracy of raw LRs,
while self correction has remarkable limits: the
greater number of passes can increase accuracy of PacBio CCS reads yet at the cost of read length, and the highest pass number of ONT data is only 2. Hy-brid correction could be helpful to obtain highly ac-curate LRs. Furthermore, hybrid error correction using SRs can rescue LRs so that they can be align-able and usalign-able for assembly, which can reduce the relatively high cost of TGS data [32].
In this study, we assessed ten existing error correc-tion methods in terms of sensitivity, accuracy, output rate, alignment rate, output read length, run time, and memory usage. The test data included four Pac-Bio datasets as well as two ONT datasets from four model organisms with five different SR coverages. Overall, the graph-based methods compared favorably
with the alignment-based methods. FMLRC in par-ticular had slightly better overall performance than the other graph-based methods. However, if only low SR coverage data are available, the graph-based methods are not as robust as the alignment-based methods. The alignment-based methods except the se-lective methods generally have comparable yet slightly lower sensitivity, accuracy, output rate, and alignment rate, while the primary drawbacks of the alignment-based methods are long run time and high memory usage. ECTools and pacBioToCA require similar memory usage as the graph-based methods. Although it is not clear how and what criteria Jabba, ECTools, and pacBioToCA use to select and trim reads, these methods may still satisfy some specific research inter-ests, such as scenarios that require very high accuracy but are not concerned with read length or data loss.
Unlike SR coverage, LR coverage is not a key factor af-fecting performance of hybrid-correction methods, be-cause each LR is treated independently in hybrid correction regardless of the types of algorithms. Some procedures that rely on LR coverage, such as LR layout generation or consensus inference, are rarely carried out in hybrid correction, yet the LR coverage needs to be taken into account in self-correction methods [26].
Generally, the tested methods had better overall per-formance on the small datasets than the large datasets. Theoretically, both the alignment-based and the graph-based algorithms corrected LRs separately, so the rela-tively poorer performance on the large datasets is likely due to the complexity of the genomes of D. melanoga-sterandA. thaliana. de Bruijn graphs from complex ge-nomes could contain more branches, bubbles, or other complicated structures [49]. On the other hand, in a complex genome, the alignment of SRs against LRs could also include a number of false positive results [28]. In particular, high repeat content across a genome poses substantial challenges to error correction, such as the stage of assigning SRs to LRs in alignment-based methods, as well as the process of searching LR-matched paths in de Bruijn graphs constructed with SRs in graph-based methods [38,50,51].
result in more complex graphs and higher values cause gaps of de Bruijn graph. Besides, the number of threads affects the run time: shorter run times with more threads. The parameter setting details in our work is in-cluded in Additional file2: Note 1.
In addition to the abovementioned quantitative met-rics, the difficulty of installation and software imple-mentation cannot be quantified but is also a critical issue for the practical application of these methods (see the corresponding details of ten methods in Add-itional file 2: Note 5 “Installation and implementation details,” Additional file 11: Table S9). The most com-mon issues include the need to (1) install two to three other software such as aligners and graph con-structors, and often with specific versions and (2) pre-process data, such as building an index of SRs and assembly of SRs. Any failure of these steps halts the error correction. For example, FMLRC had the best output when sufficient SR coverage is applied, while users must build a BWT index from SRs using the software ropebwt2 and msbwt. When the index builder runs incorrectly or fails, an incorrect index file with a similar file size to the correct index can still be output. FMLRC can run successfully with this incorrect index without a clear warning or error mes-sage, yet the output would have even worse quality than the input. Albeit only a single command line is needed to run LoRDEC, its installation may pose con-siderable challenges: each version of LoRDEC may re-quire the installation of GATB core with a specific version, and GATB core installation is particularly problematic. The installation for Nanocorr is very complicated, requiring BLAST and its implementation is recommended with Sun Grid Engine or a similar scheduler. CoLoRMap and LSC are comparably more user-friendly, which only need a single command line to run. The ideal and new methods should include simple modules that automatically confirm the ver-sions and installation of the required software as well as integrate the pre-processing of data with error cor-rection in a single command line.
According to different research interests, users may place different weight on each of the performance metrics. For example, high accuracy (e.g., > 0.99) is important for studies requiring single nucleotide reso-lution (e.g., detection of alternative splice sites in transcriptome research and breakpoints in cancer re-search) as well as sequence analysis (e.g., open read-ing frame analysis) [52]. In the other areas, such as detection of gene isoforms, fusion genes and abun-dance estimation, a high alignment rate would be very useful even with relatively low accuracy (e.g., 0.90– 0.95) [41]. Therefore, users should always have a comprehensive consideration of data size, computing
resources, and research interests when selecting a method for error correction. On the other hand, our performance evaluation identifies specific factors that can be improved in future optimization of existing error correction methods or the develop-ment of new methods.
Additional files
Additional file 1:Figure S1.Improvements in TGS will lead to further
adoption.Figure S2.Performance plots on sensitivity of ten methods on ONT datasets using five SR coverages.Figure S3.Performance plots on accuracy of ten methods on ONT datasets using five SR coverages. Figure S4.Performance plots on output rate of ten methods on PacBio (a) and ONT (b) datasets using five SR coverages.Figure S5.Output rates and alignment rates of ten methods on ONT datasets using five SR coverages.Figure S6.Performance plots on alignment rate of error correction methods using five SR coverages on PacBio small (a) and large datasets (b), as well as ONT datasets (c).Figure S7.Output lengths of correction methods onS. cerevisae(a),D. melanogaster(b) andA. thaliana(c) PacBio datasets using five SR coverages.Figure S8. Output lengths of correction methods onE. coli(a) andS. cerevisae(b) ONT datasets using five SR coverages.Figure S9.Performance plots on run time of ten methods on PacBio (a) and ONT (b) datasets using five SR coverages. Figure S10.Run time and memory usage of ten methods on ONT datasets using five SR coverages.Figure S11.Performance plots on memory usage of ten methods on PacBio (a) and ONT (b) datasets using five SR coverages. Figure S12.Radar charts of correction methods onS. cerevisae(a),D. melanogaster(b) andA. thaliana(c) PacBio datasets using five SR coverages. Figure S13.Radar charts of correction methods onE. coli(a) andS. cerevisae
(b) ONT datasets using five SR coverages.Figure S14.Comparison between self correction and hybrid correction onE. colidata in terms of accuracy. (PDF 940 kb)
Additional file 2:Note 1.Parameter settings of error correction methods.Note 2.Parameter settings of error correction methods. Note 3.Performance evaluation details on correcting heterozygous genomic data.Note 4.Comparison details between self correction and hybrid correction on PacBio and ONT data.Note 5.Installation and implementation details. (PDF 358 kb)
Additional file 3:Table S1.Performance statistics on sensitivity. a. Sensitivity performance statistics on PacBio data of ten methods using five SR coverages. b. Sensitivity performance statistics on ONT data of ten methods using five SR coverages. (XLSX 20 kb)
Additional file 4:Table S2.Performance statistics on accuracy. a. Accuracy performance statistics on PacBio data of ten methods using five SR coverages. b. Accuracy performance statistics on ONT data of ten methods using five SR coverages. (XLSX 22 kb)
Additional file 5:Table S3.Performance statistics on output rate. a. Output rate (%) performance statistics on PacBio data of ten methods using five SR coverages. b. Output rate (%) performance statistics on ONT data of ten methods using five SR coverages. (XLSX 19 kb)
Additional file 6:Table S4.Performance statistics on alignment rate. a. Alignment rate (%) performance statistics on PacBio data of ten methods using five SR coverages. b. Alignment rate (%) performance statistics on ONT data of ten methods using five SR coverages. (XLSX 22 kb)
Additional file 7:Table S5.Performance statistics on run time. a. Run time performance statistics on PacBio data of ten methods using five SR coverages (Unit: second). b. Run time performance statistics on ONT data of ten methods using five SR coverages (Unit: second). (XLSX 19 kb)
Additional file 8:Table S6.Performance statistics on memory usage. a. Memory usage performance statistics on PacBio data of ten methods using five SR coverages (unit: G). b. Memory usage performance statistics on ONT data of ten methods using five SR coverages (unit: G). (XLSX 17 kb)
Additional file 9:Table S7.Performance statistics on improving de
methods onE. coliPacBio dataset using five SR coverages. b. Genome assembly performance statistics of ten methods onS. cerevisaePacBio datasets using five SR coverages. c. Genome assembly performance statistics of five methods onD. melanogasterPacBio dataset using five SR coverages. d. Genome assembly performance statistics of five methods onA. thalianaPacBio dataset using five SR coverages. e. Genome assembly performance statistics of ten methods onE. coliONT dataset using five SR coverages. f. Genome assembly performance statistics of ten methods onS. cerevisaeONT dataset using five SR coverages. (XLSX 48 kb)
Additional file 10:Table S8.Performance of error correction methods
on correcting bases at heterozygous positions. (XLSX 15 kb)
Additional file 11:Table S9.Memory usage performance statistics by
the preprocessing modules of five error correction methods (unit: G). (XLSX 14 kb)
Acknowledgements
We are thankful for the authors of LoRDEC, Leena Salmela and Eric Rivals, for providing us with the Error Correction Evaluation Toolkit for LRs. We would like to thank Kristina Thiel for critical reading of the manuscript. We thank the anonymous reviewers for their careful reading of our manuscript and their many insightful comments and suggestions.
Funding
This work was supported by an institutional fund of the Department of Internal Medicine, University of Iowa and an institutional fund of the Department of Biomedical Informatics, The Ohio State University (to K.F.A., A.W. and S.F.), the National Institutes of Health (R01HG008759 to K.F.A., A.W., and S.F.) and the Pharmaceutical Research and Manufacturers of America (PhRMA) Foundation Research Starter grant (to K.F.A. and S.F.). The funders had no role in study design, data collection and analysis, decision to publish, or preparation of the manuscript.
Availability of data and materials
The PacBio datasets ofE. coliandS. cerevisaeare downloaded from Pacific Biosciences DevNet [53,54]. The accession numbers ofD. melanogasterand
A. thalianaPacBio datasets are SRX499318 and SRX533607, respectively [55]. The ONT datasets ofE. coliare under the accession number ERR1147227 and ERR1147228 [56]. The ONT datasets ofS. cerevisaeare under the accession number ERR1883389, ERR1883398, ERR1883399, ERR1883400, ERR1883401, and ERR1883402 [57]. The accession numbers of Illumina datasets are ERR022075 (E. coli) [58], SRP014568 (S. cerevisae) [59], ERX645969 (D. melanogaster) [60], and SRR3166543 (A. thaliana) [45], respectively. The data generated in this paper can be found under the Bioproject accession number PRJNA504496. The method and code for generating the simulated maternal and paternal human genomes can be found athttps://github.com/Au-Lab/ Error-correction-benchmark.
Authors’contributions
KFA and SF designed the benchmarks. SF and AW performed the comparative analysis for error correction methods. KFA, SF, and AW wrote the manuscript. All authors read and approved the final manuscript.
Ethics approval and consent to participate Not applicable.
Consent for publication Not applicable.
Competing interests
The authors declare that they have no competing interests.
Publisher’s Note
Springer Nature remains neutral with regard to jurisdictional claims in published maps and institutional affiliations.
Author details 1
Department of Internal Medicine, University of Iowa, Iowa City, IA 52242, USA.2Department of Biostatistics, University of Iowa, Iowa City, IA 52242, USA.3Department of Biomedical Informatics, The Ohio State University, Columbus, OH 43210, USA.
Received: 20 March 2018 Accepted: 5 December 2018
References
1. Rhoads A, Au KF. PacBio sequencing and its applications. Genomics Proteomics Bioinformatics. 2015;13:278–89.
2. Hoang NV, Furtado A, Mason PJ, Marquardt A, Kasirajan L,
Thirugnanasambandam PP, Botha FC, Henry RJ. A survey of the complex transcriptome from the highly polyploid sugarcane genome using full-length isoform sequencing and de novo assembly from short read sequencing. BMC Genomics. 2017;18(1):395.
3. Vembar SS, Seetin M, Lambert C, Nattestad M, Schatz MC, Baybayan P, Scherf A, Smith ML. Complete telomere-to-telomere de novo assembly of the plasmodium falciparum genome through long-read (> 11 kb), single molecule, real-time sequencing. DNA Res. 2016;23:339–51.
4. Magi A, Giusti B, Tattini L. Characterization of MinION nanopore data for resequencing analyses. Brief Bioinform. 2017;18:940–53.
5. Jain M, Olsen HE, Paten B, Akeson M. The Oxford Nanopore MinION: delivery of nanopore sequencing to the genomics community. Genome Biol. 2016;17:239.
6. McGinty RJ, Rubinstein RG, Neil AJ, Dominska M, Kiktev D, Petes TD, Mirkin SM. Nanopore sequencing of complex genomic rearrangements in yeast reveals mechanisms of repeat-mediated double-strand break repair. Genome Res. 2017;27:2072–82.
7. Jain M, Koren S, Miga KH, Quick J, Rand AC, Sasani TA, Tyson JR, Beggs AD, Dilthey AT, Fiddes IT. Nanopore sequencing and assembly of a human genome with ultra-long reads. Nat Biotechnol. 2018;36(4):338–45. 8. Kranz A, Vogel A, Degner U, Kiefler I, Bott M, Usadel B, Polen T. High
precision genome sequencing of engineered Gluconobacter oxydans 621H by combining long nanopore and short accurate Illumina reads. J Biotechnol. 2017;258:197–205.
9. Lan TY, Renner T, Ibarra-Laclette E, Farr KM, Chang TH, Cervantes-Perez SA, Zheng CF, Sankoff D, Tang HB, Purbojati RW, et al. Long-read sequencing uncovers the adaptive topography of a carnivorous plant genome (vol 114, pg E4435, 2017). Proc Natl Acad Sci U S A. 2017;114:E5483.
10. Shi LL, Guo YF, Dong CL, Huddleston J, Yang H, Han XL, Fu AS, Li Q, Li N, Gong SY, et al. Long-read sequencing and de novo assembly of a Chinese genome. Nat Commun. 2016;7:12065.
11. Quail MA, Smith M, Coupland P, Otto TD, Harris SR, Connor TR, Bertoni A, Swerdlow HP, Gu Y. A tale of three next generation sequencing platforms: comparison of ion torrent, Pacific biosciences and Illumina MiSeq sequencers. BMC Genomics. 2012;13:341.
12. Ross MG, Russ C, Costello M, Hollinger A, Lennon NJ, Hegarty R, Nusbaum C, Jaffe DB. Characterizing and measuring bias in sequence data. Genome Biol. 2013;14(5):R51.
13. Simpson JT, Workman RE, Zuzarte PC, David M, Dursi LJ, Timp W. Detecting DNA cytosine methylation using nanopore sequencing. Nat Methods. 2017;14:407. 14. Rand AC, Jain M, Eizenga JM, Musselman-Brown A, Olsen HE, Akeson M,
Paten B. Mapping DNA methylation with high-throughput nanopore sequencing. Nat Methods. 2017;14:411.
15. Cartwright JF, Anderson K, Longworth J, Lobb P, James DC. Highly sensitive detection of mutations in CHO cell recombinant DNA using multi-parallel single molecule real-time DNA sequencing. Biotechnol Bioeng. 2018;115(6):1485–98.
16. Michael TP, Jupe F, Bemm F, Motley ST, Sandoval JP, Lanz C, Loudet O, Weigel D, Ecker JR. High contiguity Arabidopsis thaliana genome assembly with a single nanopore flow cell. Nat Commun. 2018;9:541.
17. Turner TR, Hayhurst JD, Hayward DR, Bultitude WP, Barker DJ, Robinson J, Madrigal JA, Mayor NP, Marsh SGE. Single molecule real-time DNA sequencing of HLA genes at ultra-high resolution from 126 international HLA and Immunogenetics workshop cell lines. Hla. 2018;91:88–101. 18. Moldovan N, Tombacz D, Szucs A, Csabai Z, Snyder M, Boldogkoi Z.
Multi-platform sequencing approach reveals a novel transcriptome profile in pseudorabies virus. Front Microbiol. 2018;8:2708.
19. Tyson JR, O'Neil NJ, Jain M, Olsen HE, Hieter P, Snutch TP. MinION-based long-read sequencing and assembly extends the Caenorhabditis elegans reference genome. Genome Res. 2018;28:266–74.
20. Korlach J: Understanding accuracy in SMRT sequencing.