www.impactjournals.com/oncotarget/ Oncotarget, Vol. 5, No. 14
Functional genomics identifies novel genes essential for clear
cell renal cell carcinoma tumor cell proliferation and migration
Christina A. von Roemeling1, Laura A. Marlow1, Derek C. Radisky1, Austin Rohl1, Hege E. Larsen1, Johnny Wei1, Heather Sasinowska3, Heng Zhu5, Richard Drake4, Maciek Sasinowski3, Han W. Tun2 and John A. Copland1
1 Department of Cancer Biology, Mayo Clinic Comprehensive Cancer Center, Jacksonville, Florida 2 Division of Hematology & Oncology, Mayo Clinic Comprehensive Cancer Center, Jacksonville, Florida 3 Incogen, Inc., Jacksonville, Florida
4 MUSC Proteomics Center, Jacksonville, Florida
5 Department of Pharmacology & Molecular Sciences, Johns Hopkins School of Medicine, Jacksonville, Florida
Correspondence to: John A. Copland, email: [email protected]
Keywords: Renal cell carcinoma, gene array, metastasis, therapeutic targets
Received: April 23, 2014 Accepted: June 11, 2014 Published: June 12, 2014
This is an open-access article distributed under the terms of the Creative Commons Attribution License, which permits unrestricted use, distribution, and reproduction in any medium, provided the original author and source are credited.
ABSTRACT
Currently there is a lack of targeted therapies that lead to long-term attenuation or regression of disease in patients with advanced clear cell renal cell carcinoma (ccRCC). Our group has implemented a high-throughput genetic analysis coupled with a high-throughput proliferative screen in order to investigate the genetic contributions of a large cohort of overexpressed genes at the functional level in an effort to better understand factors involved in tumor initiation and progression.
Patient gene array analysis identified transcripts that are consistently elevated in patient ccRCC as compared to matched normal renal tissues. This was followed by a high-throughput lentivirus screen, independently targeting 195 overexpressed transcripts identified in the gene array in four ccRCC cell lines. This revealed 31 ‘hits’ that contribute to ccRCC cell proliferation.
Many of the hits identified are not only presented in the context of ccRCC for the first time, but several have not been previously linked to cancer. We further characterize the function of a group of hits in tumor cell invasion. Taken together these findings reveal pathways that may be critical in ccRCC tumorigenicity, and identifies novel candidate factors that could serve as targets for therapeutic intervention or diagnostic/prognostic biomarkers for patients with advanced ccRCC.
INTRODUCTION
Renal Cell Carcinoma (RCC) is among the top ten most common solid tumors in the United States. In 2013 it was projected that over 60,000 new cases would be diagnosed, and that 13,000 deaths would result from this disease [1]. The clear cell subtype of RCC (ccRCC) manifests in the majority of all cases, accounting for approximately 80% [2]. The prognosis for patients who present with localized disease is relatively good, and treatment typically involves surgical resection of the tumor. Patients who present with advanced and metastatic disease have markedly worse prognoses, with overall
survival rates dropping to 50% for stage III and <10% for stage IV [3]. This is attributed to disease recurrence as well as the drug and radiation resistant nature of ccRCC.
resistant to radiation, chemotherapy, and targeted therapy [6, 7]. To date, there are several treatment courses that have been approved by the FDA; still, none are curative with the exception of patients who respond well to immunotherapy, which has demonstrated success in 5-6% of patients [7]. Drug resistance to targeted therapy also occurs rapidly. Treatment therefore is administered long-term, often in combination with other agents or applied sequentially, and requires management of toxicity [3, 7].
Currently, there remains a need for the development
of new courses of targeted therapy. New tumor-specific
properties that contribute to disease progression and can be exploited through pharmacologic intervention must
be identified. Explorations into the genetic signatures
of heritable and sporadic ccRCC have elucidated several genes thought to play a role in the initiation and
progression of this disease, yet many of these remain to be functionally validated. Of those currently known, mutation or loss of the tumor suppressor Von Hippel Lindau (VHL) and resulting stabilization of the hypoxia inducible factor proteins (HIF) remains the best characterized, and manifests in 60-80% of all cases of ccRCC [8]. HIF stabilization is most commonly known to promote tumor angiogenesis via transcriptional upregulation of vascular
endothelial growth factor (VEGF), platelet derived growth factor (PDGF), as well as several other genes [8]. Several
of the approved therapies for ccRCC are agents that target these pro-angiogenic factors; however, tumor responses to these courses of therapy are short-lived. Other commonly investigated factors such as oncogenic KRAS or mutations in TP53 rarely contribute to ccRCC [8, 9].
[image:2.612.60.556.88.519.2]Our group has employed a high-throughput gene Table 1: Average B score summary of gene hits. Summary of the 31 gene hits identified to significantly decrease tumor cell proliferation. Clone references for the specific lentiviral constructs used to generate growth effects are shown. Average
microarray screen to identify genetic transcripts that are over-expressed at all stages of ccRCC as compared to matched normal kidney tissue. A high-throughput lentiviral array was designed to individually target 195
of the most consistently over-expressed genes identified
in the gene array in four established ccRCC cell lines. Measuring decreased proliferative capacity as a
read-out for the lentiviral screen, we have identified 31 genes
that are required for ccRCC cell propagation, many of which are unique. While little is currently known about the protein function of several of these gene products, many are implicated in metabolism, angiogenesis, differentiation, and cell motility in other cancer systems. Of these, we further establish a role for CDH13 in tumor angiogenesis, as well as a pro-migratory role for four novel factors including KISS1R, KSR1, CAMK1, and SSPNin ccRCC.
RESULTS
Comparative marker selection of gene array data reveals cohort of genes consistently over-expressed and down-regulated in ccRCC
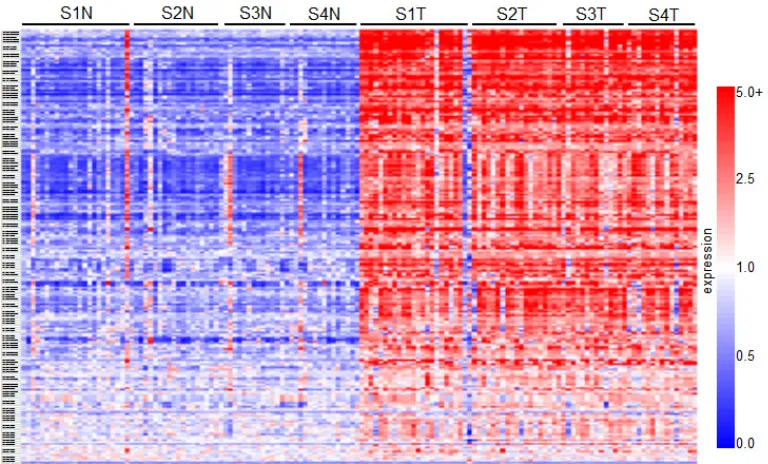
Comparative marker selection of the results of a high-throughput DNA microarray screen evaluating expression between matched normal renal tissue and ccRCC samples derived from stage I through IV patients
was used to identify gene transcripts that are upregulated
in diseased tissues (GSE-53757). This analysis revealed a total of 2,875 genes that are over-expressed (n≥2 fold change induction where p≤0.05), and 3,062 genes that are downregulated (n≤0.5 fold change decrease, where p≤0.05) in tumor samples when compared to matched normal (GSE-53757). Of these, 195 genes of interest
that consistently demonstrated elevated expression as compared to normal levels were selected for further functional analysis. These selected genes are summarized in the heatmap in Figure 1. A list sorting the top 195 genes alphabetically is also provided (SF1).
High-throughput targeted lentiviral screen of genes over-expressed in ccRCC reveals a subset that considerably affect tumor cell proliferation
We next sought to characterize which of the top
195 genes identified in the gene array screen contributed
to tumor cell proliferation. A high-throughput lentiviral screen designed to target each individually was completed using MISSION® shRNA lentiviral particles from Sigma, arranged in 96-well format. CCND1 (cyclin D1) and MYC oncogenes, both identified as overexpressed in the
comparative analysis, were considered as positive controls due to their well characterized roles in cell proliferation [10]. Four established ccRCC cell lines including ACHN and Caki1 (VHL wt) and Caki2 and KIJ265T (VHL mut)
[image:3.612.98.482.435.667.2]were used in the lentiviral screen. Cyquant® fluorescence
based assays were used to measure cell proliferation based
upon DNA fluorescence. Additional details of the lentiviral
screen and Cyquant® assays are further described in the methodology section. Hit selection was performed using a B-score (analog of Z score) statistical approach to minimize column and row bias using HTS corrector [11]
(SF2). From these analyses, 31 gene ‘hits’ were identified whose targeted mRNA silencing yielded significant
growth inhibition with 90-95% probability under normal distribution in at least three of the four cell lines examined.
Hits are shown in alphabetical order along with Sigma clone references, with average B-score summaries (n=3) for each cell line provided (Table 1). The numeric values denoted under each cell line represent the polished
standard deviation on a normal distribution scale. Each
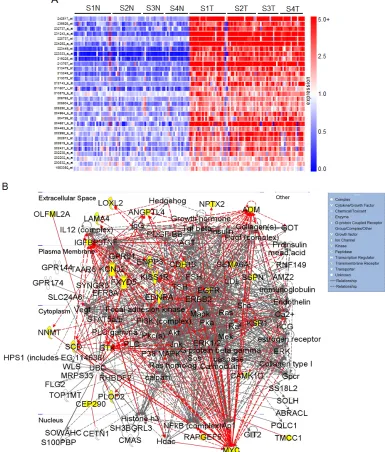
[image:4.612.97.482.187.639.2]integer represents one standard deviation, with negative values corresponding to a decrease in proliferation. Values less than -1 represent a loss of more than 85% in total population when compared to control values. A heatmap depicting gene expression in normal samples as compared
to tumor corresponding to all stages of disease for the 31 hits is shown (Figure 2A). Differential gene expression of the 31 hits was further validated in two other publically available, independent gene array datasets comparing ccRCC tissue and normal samples. Overexpression was
observed in 28/31[12] of the gene hits in the first dataset,
and 29/31[13] in the second (SF3-4).
Ingenuity® Systems was used to perform gene network clustering of the 31 hits in order to identify pathways that may be consistently altered in ccRCC. 26 of the 31 hits were clustered into one primary network that includes factors known to be involved in angiogenesis
and inflammation, cell motility and EMT, and cancer and hereditary diseases (Figure 2B). Gene hits are highlighted in yellow. Of the 31 hits identified, we correlate overexpression of 14 for the first time with RCC: BHLHB3
(basic helix-loop-helix family, member e41), CAMK1 (calcium/calmodulin-dependent protein kinase I), CDH13
(cadherin 13), CEP290 (centrosomal protein 290kDa), EFCAB3 (EF-hand calcium binding domain 3), ENPP3
(ectonucleotide pyrophosphatase/phosphodiesterase 3), KCNJ2 (potassium inwardly-rectifying channel, subfamily
J, member 2), KSR1 (kinase suppressor of ras 1), PGBD5
(piggyBac transposable element derived 5), PLOD2 (procollagen-lysine, 2-oxoglutarate 5-dioxygenase 2),
SSPN (sarcospan), RAPGEF5 (rap guanine nucleotide exchange factor 5), TCF8 (zinc finger E-box binding
homeobox 1, ZEB1) and TOX2 (TOX high mobility group box family member 2, C20ORF100).
RCC tumors exhibit dense networks of tumor vasculature [14], and are also frequently characterized by
high levels of pro-inflammatory cytokines and eicosanoids
[15]. Several genes comprising the network in Figure 2B have been previously implicated in the pathophysiology of RCC vasculogenesis and include ADM (adrenomedullin)
[16], ANGPTL4 (angiopoietin-like 4) [17, 18], EGFR (epidermal growth factor receptor) [19, 20], EDNRA
(endothelin receptor type A) [21], and LAMA4 (laminin, alpha 4) [22, 23]. Other members of this signaling network
have been characterized to play a pro-inflammatory role
in ccRCC. These include SCD1 (stearoyl-CoA desaturase 1) [24], BTK (bruton agammaglobulinemia tyrosine kinase) [25, 26], and FXYD5 (FXYD domain containing ion transport regulator 5, dysadherin) [27-29]. CDH13 appears to be frequently methylated in cancer, however its expression has been reported to be upregulated in tumor-associated vasculature, where it promotes endothelial cell proliferation and migration [30]. Its role in RCC
remains to be defined. Other genes in this network have
demonstrated pro-tumorigenic activity by mediating
inflammation, cell transformation, proliferation, and
metastasis in other cancers; however, their correlation with RCC pathophysiology has not been established. These include KSR1 [31-33] and PLOD2 [34, 35].
Expression of molecular factors involved in cell
migration and invasion in RCC are of particular interest as
they suggest significant dysregulation of cellular motility and epithelial to mesenchymal transition (EMT) in the
pathophysiology of this cancer. The network in Figure 2B provides evidence of potential signaling pathways that may contribute to the invasive and metastatic nature of ccRCC.
Genes that are transcriptionally upregulated and have
been previously linked to cell migration in RCC include LOXL2 (lysyl oxidase-like 2) [36], NNMT (nicotinamide N-methyltransferase) [37], NPTX2 (neuronal pentraxin 2) (data unpublished), and OLFML2A (olfactomedin-like
2A) [38]. SEMA6A (semaphorin 6A) belongs to a large
family of genes involved in the cytoskeletal remodeling and morphogenesis of nervous systems tissues [39]. While
SEMA6A appears to be overexpressed in RCC, current
literature suggests an anti-angiogenic role for this factor [40]. TMCC1 (transmembrane and coiled-coil domain family 1) was recently shown to be overexpressed at the transcript level in ccRCC [41], yet its functional role
remains to be defined. While ENPP3 is involved in tumor
cell migration [42, 43] and KCNJ2 is overexpressed in papillary thyroid carcinoma [44], the role of either of these factors is unknown in RCC.
Of the remaining hits shown in Figure 2B, MYC expression is frequently described as an oncogenic driver of proliferation, and has been previously characterized
in RCC [10, 45]. IGFBP3 (insulin-like growth factor
binding protein 3) overexpression has been proposed as a prognostic factor for RCC [46], and it is thought to potentiate oncogenic signaling through
PI3K-AKT-mTOR through IGF1R activation [47]. KISS1R (KISS1
receptor) presents an interesting quandary. Activation of
this G-coupled protein receptor by its canonical ligand,
kisspeptin (metastin), has been shown to inhibit tumor cell migration and invasion in several cancers including RCC [48, 49]. Recently, a pro-invasive role has been proposed for KISS1R in breast cancer [50]. Data generated in this study additionally supports an invasive role for KISS1R in ccRCC. Calmodulin kinases have been implicated in oncogenesis [51, 52], though CAMK1 activity remains
to be defined in RCC. SSPN expression has been studied
in the context of muscle cell adhesion, strength, and regeneration [53]; nonetheless, a role for SSPN in cancer
has yet to be defined. Finally, both RAPGEF5 and CEP290
have not previously been linked to malignancy.
Of the genes that were not included in the pathway illustrated in Figure 2B, BHLHB3 is implicated as a tumor suppressor in lung cancer [54], and TCF8 expression has
Validation of tumor specific expression of a subset of hits identified in ccRCC
Of the 31 validated hits from the high-throughput lentiviral screen, we narrowed our focus to several genes whose roles in ccRCC malignancy is largely unknown.
Real time quantitative PCR analysis (QPCR) confirmed
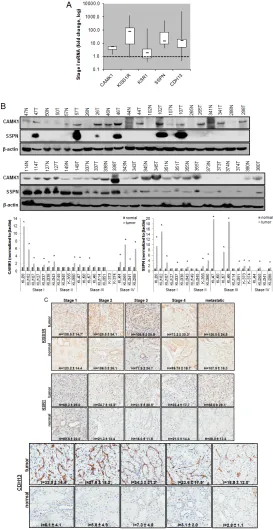
over-expression of CAMK1, KISS1R, KSR1, SSPN, and CDH13 at the transcript level in patient derived stage I tumor tissue as compared to matched normal samples (Figure 3A), as expression of these hits appear to be transcriptionally upregulated in the gene array dataset in early stages of disease (Figure 1A). Immunohistochemistry (IHC) of ccRCC tumor tissue microarrays (TMA) for
CAMK1 and SSPN demonstrated non-specific staining
and could not be quantitatively analyzed. Therefore, protein tissue lysates were prepared from 23 normal and matched ccRCC samples derived from stage I-IV patients, and western blotting was performed. CAMK1 was overexpressed in 56% (13/23) and SSPN was overexpressed in 65% of the samples examined (15/23) (Figure 3B). IHC for KISS1R demonstrated a trend of protein overexpression in tumor samples corresponding to stages I, II, III, and metastasis, however only stage I and stage III results were considered to be statistically
significant based upon H scores (p≤0.05) (Figure 3C).
Interestingly, KISS1R appears to be predominantly localized to the plasma membrane in the tumor samples at all stages of disease, where staining in the corresponding normal samples was primarily cytoplasmic (Figure 3C, SF5A). KISS1R also demonstrates membranous and cytoplasmic staining in ccRCC tumor cell lines (SF5B).
Since KISS1R is a G-coupled protein receptor, these
results suggest that KISS1R may be functionally active in tumor samples as compared to normal. KSR1 protein is overexpressed in RCC in stage II-IV and metastatic samples, and demonstrates a cytoplasmic pattern of staining in both tumor and normal samples (Figure 3C).
CDH13 expression appears to be significantly upregulated
in RCC tumor vasculature at all stages of disease as compared to normal samples (Figure 3C). In order to further evaluate CDH13 localization, serial sections of both tumor and matched normal tissue were stained for CD31, a marker of endothelial as well as other blood cells, and CDH13. CDH13 staining was analogous to CD31
staining, suggestive that CDH13 expression is specific
to the vasculature constituents (SF5C). This pattern of expression corroborates current literature, suggesting a possible role for CDH13 expression in tumor-associated
vasculogenesis. These results confirm tumor-specific
overexpression of CAMK1, SSPN, KISS1R, KSR1, and CDH13 at the transcript and protein level.
Functional validation of novel pro-invasive hits in RCC cells
We further explored the contribution of KISS1R, KSR1, CAMK1 and SSPN expression at the functional
level. Normal renal epithelial (NRE) and RCC cell lines
were analyzed via western blot in order to validate
tumor-specific expression of target hits as well as establish
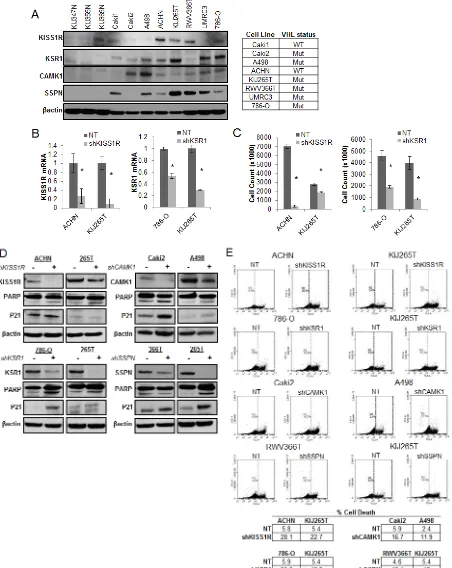
appropriate working models (Figure 4A). The VHL status for each RCC cell line is provided (Figure 4A). Two representative cell lines that demonstrate high levels of protein expression for each hit were chosen to further investigate functionality in the context of RCC. Cells were infected with shRNA constructs targeting each gene, and the resulting decrease in mRNA expression was evaluated by QPCR (Figure 4B), and decreased protein expression was evaluated by western blot (Figure 4D). Cell proliferation in response to decreased hit expression
was assessed (Figure 4C), and significant decreases were
observed in all cell lines for each target. We performed western blot analysis to evaluate induction of apoptosis via PARP cleavage as well as inhibition of cell cycle
progression via p21 upregulation. Significant increases
in PARP cleavage were observed in all cell lines as compared to nontarget (NT) controls for each hit, except for RWV366T shSSPN cells (Figure 4D). An increase in p21 expression was observed in RWV366T cells, as well as in Caki2 and A498 shCAMK1 cells, 786-O shKSR1 cells, and KIJ265T shSSPN cells as compared to NT control cells (Figure 4D). Induction of cell death was also
evaluated via flow cytometry of propidium iodide stained
NT versus target knockdown cells. Results demonstrate a
significant increase in cell death in all target knockdown cells evaluated (Figure 4E), further supporting the
requirement for each target gene expression in tumor cell viability.
As KISS1R, KSR1, CAMK1, and SSPN have been either previously implicated in tumor cell migration or are known to participate in extracellular matrix adhesion, we wanted to explore whether any of these factors mediate RCC cell invasiveness. Three-dimensional cell culture was performed in order to evaluate the ability of NT and target knockdown cells to form multicellular spheroids, as well as their ability to invade into the surrounding substrate. After 10 days, a marked reduction in the size of colonies was observed in all targeted mRNA silenced cells (Figure 5A, B). Additionally, ACHN shKISS1R and KIJ265T
SSPN cells demonstrated a significant decrease in the
Figure 4: Decreased expression of KISS1R, KSR1, CAMK1, and SSPN leads to tumor cell death and/or senescence.
stellate outgrowth (Figure 5B). A significant decrease in
tumor cell invasion in all target hit knockdown cells using standard matrigel chemoinvasion assays further illustrated a loss of invasive capacity as compared to NT control cells (Figure 5C). In order to evaluate morphological changes at the cellular level, NT and target cells were
stained using Phalloidin- a marker of filamentous actin, allowing for the visualization of fluorescent intensity and arrangement of actin filaments. Additionally, cells
were co-stained for VASP- an adapter protein thought to regulate actin polymerization and cell motility [56]. 20x images as well as a manual zoom of boxed-in regions within the 20x images are provided to better visualize morphological changes. Very little VASP staining was
present in ACHN cells, however a significant increase in actin stress fiber formation was observed in shKISS1R
cells as compared to NT control cells (Figure 5D). 786-O shKSR1 cells displayed an enlarged cell morphology, indicative of senescence (Figure 5D). A498 shCAMK1 and KIJ265T shSSPN cells not only displayed increased
actin stress fiber formation, but a significant decrease in
VASP staining was observed as compared to respective NT control cells, where they demonstrated a punctate expression at the cellular periphery-a staining pattern that is supportive of cell migration in control cells.
DISCUSSION
In this study we utilized a high-throughput gene array of patient ccRCC tissues and matched normal samples followed by a high-throughput shRNA screen in an effort to not only identify genes transcripts that are overexpressed in tumor samples, but also to ascertain
those that promote ccRCC cell proliferation. Our findings reveal tumor-specific upregulation of factors that not only influence tumor cell growth, but also angiogenesis, inflammation, and cell migration. Moreover, we implicate several of these gene hits not only in ccRCC for the first time (BHLHB3, CAMK1, CDH13, ENPP3, KCNJ2,
KSR1, PLOD2, and TCF8), but also in a cancer model
for the first time (CEP290, EFCAB3, PGBD5, RAPGEF5,
SSPN, and TOX2). Additionally, we functionally validate
the contribution of a specific subset of hits not only to
tumor cell viability, but to tumor cell migration in vitro. These include KISS1R, KSR1, CAMK1, and SSPN.
Our results also confirm that overexpression
of CDH13 protein appears to be exclusive to tumor vasculature. Currently, ccRCC is well characterized as being a highly vascularized tumor and therefore inhibitors of angiogenesis present as an attractive target for therapy in patients [57]. Several treatment regimens that
specifically target pro-angiogenic factors (such as VEGF, VEGFR and PDGFR) have been approved by the FDA for
the treatment of advanced ccRCC. These currently provide
some clinical benefit for patients and include pazopanib,
sorafenib, sunitinib, bevacizumab, and axitinib. CDH13
presents as a potential novel anti-angiogenic target in
ccRCC, and further investigation of its specific role in
tumor vasculogenesis is warranted.
Previous studies evaluating KISS1R expression and its role in tumorigenesis in ccRCC has emphasized a tumor-suppressive role for this receptor in conjunction with its ligand, kisspeptin, where it inhibits tumor cell
invasion [48, 49]. Our findings contradict this data and
provide evidence that KISS1R overexpression may support a pro-invasive phenotype in ccRCC, as mRNA silencing of this receptor inhibits ccRCC cell invasion in vitro. This finding is suggestive of a more complicated
role for KISS1R in ccRCC whereby it may facilitate tumor cell invasion via a non-canonical mechanism, possibly in the absence of its ligand. Further studies are necessary to elucidate its regulation. In addition to KISS1R, we identify a pro-invasive role for KSR1,
CAMK1, and SSPN in the context of ccRCC. Given that
ccRCC is a highly metastatic tumor as evidenced by the
frequency of disease recurrence, these findings may shed
light on critical signaling pathways that drive tumor cell migration, even in early stage disease. These targets may themselves present as possible therapeutic candidates or prognostic biomarkers for disease aggressiveness given their overexpression at the protein level in ccRCC tissues.
In summary, patients with advanced ccRCC have limited therapeutic options due to the high degree of tumor heterogeneity, drug resistance, and lack of molecular targets that are consistently deregulated in a
large proportion of cases. The findings of this study not
only corroborates the work of other groups investigating ccRCC, but also illuminates the contribution of a cohort of genes that are less well understood in the context of this disease. In particular, our results reveal altered expression of several genes thought to be involved in cell adhesion and migration in other cancers and diseases, and further implicate their involvement in ccRCC cell migration. As
ccRCC is highly metastatic, these findings may be critical
for understanding the mechanisms that drive this invasive
phenotype. Moreover, our findings highlight additional
novel candidate factors that may serve as prognostic biomarkers or targets for therapeutic intervention for ccRCC patients given their requirement for tumor cell proliferation.
MATERIALS AND METHODS
Cell lines
Grossman [59]. VHL mutational and deletional status
were examined via DNA sequencing and multiplex
ligation dependent probe amplification, respectively. Cells were maintained in DMEM (Cellgro) supplemented
with 5% FBS (Hyclone) and 1% penicillin-streptomycin-amphotericin B (Cellgro) at 37oC with 5% CO
2.
High-Throughput DNA Microarray
Purified RNA samples were sent to the Mayo Clinic Advanced Genomic Technology Center Gene Expression
Core where gene array expression analysis was performed
using Affymetrix Human Genome U133 Plus 2.0 Array
chip. Samples were derived from matched normal and diseased ccRCC patient tissue across all stages of disease
(n= I-24, II-19, III-14, IV-15). Gene expression data was deposited at the Gene Expression Omnibus Database (Accession #GSE-53757). Details of the data processing
and methodology are previously described in [60]. Use of all tissues in the course of the study was approved by the Mayo Institutional Review Board. Heatmaps
were generated with Genespring GX 7.3.1 (Agilent
Technologies) using Affymetrix default analysis settings
and standard Genespring normalizations (normalized
value = Raw signal value/Control Value where the Control value is a product of the 50% of the chip and Median of the signal value for that gene). Meta-analysis of publicly available gene array datasets was performed as previously described using NextBio data mining platform [61].
High-Throughput shRNA Array
The top 195 genes overexpressed in RCC samples along with control genes were used to design a high-throughput shRNA screen. MISSION ® shRNA particles were prepared and plated individually by Sigma-Aldrich in Corning black, clear-bottom 96-well plates. ACHN, Caki1, Caki2, and KIJ265T cells were plated at 5000 cells
per well (for a 200 MOI) in phenol red-free DMEM with
10% FBS, 1% PSA and 1X glutamax. Triplicates were on 3 separate plates. After 72 hours, plates were washed with PBS, and stored at -80oC prior to analysis using
CyQuant ® Proliferation Analysis Kit (Invitrogen) as per
manufacturers’ protocol for relative fluorescence units.
Statistical Analysis
The raw relative fluorescence unit values for each
plate were used for analysis using HTS Corrector software for median [62] polishing and B score calculations (Z score analog). B scores were chosen over Z scores based upon uncommon variances due to column and row bias to rule out outliers as demonstrated in Figure S2 [11]. For screening the hits at 95% probability, P=0.05 and Z=
-1.645. Experimental error is presented as fold change or standard deviation where specified. Group comparisons
were performed using two-tailed paired student’s t-test, where p≤0.05 were considered to be statistically significant (normal vs. tumor and NT vs. shRNA) unless specified otherwise.
Gene Network Clustering
Ingenuity® Systems was used to cluster the 31 over-expressed genes validated by the high-throughput shRNA screen into functional groups.
Lentiviral Infections
MISSION shRNA pLKO.1 constructs (Sigma-Aldrich) were used to make self-inactivating shRNA lentiviruses for CAMK1 (NM_020397.x_399s1c1), KISS1R (NM_032551.2-342), KSR1 (XM_290793.4-1852s1c1), SSPN (NM_005086.3-352s1c1) and a non-target (NT) random scrambled sequence control (SHC002). Lentivirus was prepared as previously described [24]. Cells were incubated overnight with lentivirus particles. Cells were washed 3x with PBS, and were allowed to recover for 24 hours in regular growth media. Puromycin (Life Technologies) selection was added to cells for a minimum of 5 days prior to experimentation.
RNA isolation and Realtime QPCR Analysis
RNA from human tissue was prepared using using TRIzol® (Invitrogen) along with sonication on ice and then extracted using a Phenol (Ambion): Chloroform
(Boehringer Mannheim Inc.) mix prior to purification
using the RNAqueous Midi Kit (Ambion). cDNA was
prepared from purified RNA samples using using High
Capacity cDNA Reverse Transcriptase Kit (Applied Biosystems) per manufacturer’s instruction. TaqMan® Fast Universal PCR Master Mix (Applied Biosystems) and TaqMan® FAMTM dye-labeled probes including POLR2A
(Hs00172187_m1), CAMK1 (Hs00220668_m1), CDH13 (Hs01004530_m1), KISS1R (Hs00261399_m1), KSR1 (Hs01075790_m1), and SSPN (Hs01025520_m1) were combined with prepared cDNA samples to analyze relative mRNA expression via quantitative real time PCR (QPCR). POLR2A expression was used as normalization control. Fold change values were compared between normal and tumor as well as non-target scrambled lentiviral and target
Proliferation Assays
Cells were infected with either NT control or target lentivirus as previously described. Cells were plated at 2x10⁴ cells/well in 12-well plates (Midwest Scientific)
in triplicate. After 5 days, cell number was established using a Coulter Particle Counter (Beckman). Puromycin selection was maintained throughout the course of the assay.
Immunohistochemistry and immunocytochemistry Analysis:
Formalin-fixed paraffin-embedded tissue
microarrays (TMA) of patient ccRCC tumor and matched normal tissues were prepared. Samples were blocked with Diluent that contained Background Reducing Components (Dakocytomation, Denmark) for 30 minutes and then probed for KISS1R (Alomone Labs), KSR1 (Santa Cruz Biotechnologies), CDH13 (Sigma), and CD31 (R&D Systems). Tissue stain scoring was performed as previously described [60]. 20x images were obtained using Scanscope XT and Imagescope software (Aperio Technologies). Scoring methods were performed as previously described [24]. Cells were plated
in 4-chamber slides (Thermo Scientific), were fixed
with 4% paraformaldehyde (Sigma), permeabilized with 0.1% Triton X-100 (Sigma), and blocked with Diluent
(Dakocytomation) for 1H. Cells were first incubated
with primary antibody -VASP (Cell Signaling), KISS1R
(Alomone Labs), followed by species specific secondary.
Phalloidin (Life Technologies) stain was applied following
antibody application. VECTASHIELD mounting media
(Vector Labs) containing dapi was used. Negative sections were prepared by incubating the slides in the absence of the primary antibody.
Western Blot Analysis
Tissue protein extracts were prepared from frozen samples using 1% SDS (Sigma) in 50mM pH 8.0 Tris buffer (Sigma) containing protease inhibitor cocktail (Roche) and phosphatase inhibitor (Pierce). Samples were sonicated on ice. Bicinchoninic acid assay (Pierce)
was used to quantify protein concentrations. NuPAGE®
LDS sample loading buffer plus sample reducing agent (Invitrogen) were added to lysates. Samples were loaded
in Novex 4-12% Bis-Tris gels in MES buffer (Invitrogen) for electrophoresis separation, and transferred to 0.2 μM
Immobilon Psq membranes (Millipore) for western blot analysis. 5% milk in Tris Buffered Saline plus 0.1%
Tween-20 (TBS-T) (Fischer Scientific) was used as a
blocking buffer as well as antibody diluent. Primary antibodies to detect KISS1R (Alomone Labs), KSR1
(Santa Cruz Biotechnologies), CAMK1 (Abnova),
SSPN (Santa Cruz Biotechnologies), and β-actin
(Sigma-Aldrich) were used. All secondary
species-specific horseradish peroxidase-labeled antibodies were
purchased from Jackson Immunoresearch and Supersignal chemiluminescent kit (Pierce) was used to perform detection.
Cell Death Analysis via Flow Cytometry
ccRCC cells were infected with either NT control or target lentivirus as previously described. After puromycin
selection, both adhered and floating cells were collected
using Accutase (Innovative Cell Technologies, Inc.), washed with PBS, and were suspended in 1x cold binding buffer (BD Pharmingen) at 1x10⁶ cells/mL. Cells were
stained with Propidium Iodide (BD Pharmingen), and cell
death analysis was performed using an Accuri C6 flow
cytometer (Accuri). Unstained NT cells were used to set population parameters.
3D Cell Culture and Invasion Assays
3D cell culture assays were performed as previously described [64]. Media was changed every 2 days, and puromycin selection was maintained. Photos were taken
on day 10 at 10x magnification for an overview of colony size and density, and 40x magnification images were taken
to evaluate colony structure and morphology. For the invasion assays, cells were starved overnight in 0.2% FBS
DMEM. BD Biocoat Matrigel Invasion Chambers (8µm
pore) (BD Biosciences) were prepared per manufacturer’s protocol. 5,000 cells were plated (in triplicate) with 0.25% BSA in the upper chamber and 5% FBS was the attractant in the lower chamber. Puromycin selection
was maintained. Transwell inserts were fixed in 100%
methanol and stained with 0.2% crystal violet/2% ethanol after a 20 hour time period. Invasion was quantitated
as number of invading cells per visual field, where 3 visual fields were analyzed per transwell insert. Assay
was performed in triplicate per group. 10x images were obtained using an Olympus microscope (Olympus IX71).
ACKNOWLEDGEMENTS
We are grateful for the assistance given by Brandy
Edenfield in the processing and staining tissues for all IHC
analysis done in this study. We would also like to thank
Stefan K. Grebe for DNA sequencing and analysis of VHL
Conflicts of interest:
The authors of this manuscript have no conflicts of
interest to disclose.
Funding support:
This work was funded in part from NIH/NCI grants R01CA104505 (JAC), R01CA136665 (JAC), R01CA104505-05S1 (JAC) and 5R44CA125807 (MS);
a generous gift from the David & Lois Stulberg Endowed
Fund for Kidney Cancer Research (JAC); Mr. and Mrs. Ompal Chauhan Research Fund (JAC); Kidney Cancer Research at Mayo Clinic in Florida (JAC); James C. and Sarah K. Kennedy Mayo Clinic Research Career Development Award for Clinicians (HWT); Scheidel
Foundation (JAC); Fraternal Order of Eagles Florida
State Auxiliary (JAC); and a grant for rare cancers from
Dr. Ellis and Dona Brunton (JAC).
REFERENCES
1. Siegel R, Naishadham D and Jemal A. Cancer statistics, 2013. CA Cancer J Clin. 2013; 63(1):11-30.
2. Lam JS, Shvarts O and Pantuck AJ. Changing concepts in the surgical management of renal cell carcinoma. Eur Urol. 2004; 45(6):692-705.
3. Haddad H and Rini BI. Current treatment considerations in metastatic renal cell carcinoma. Curr Treat Options Oncol. 2012; 13(2):212-229.
4. Cohen HT and McGovern FJ. Renal-cell carcinoma. N Engl J Med. 2005; 353(23):2477-2490.
5. Mulders P, Figlin R, deKernion JB, Wiltrout R, Linehan M, Parkinson D, deWolf W and Belldegrun A. Renal cell carcinoma: recent progress and future directions. Cancer Res. 1997; 57(22):5189-5195.
6. Motzer RJ, Bacik J and Mazumdar M. Prognostic factors for survival of patients with stage IV renal cell carcinoma: memorial sloan-kettering cancer center experience. Clin Cancer Res. 2004; 10(18 Pt 2):6302S-6303S.
7. Coppin C, Kollmannsberger C, Le L, Porzsolt F and Wilt TJ. Targeted therapy for advanced renal cell cancer (RCC): a Cochrane systematic review of published randomised trials. BJU Int. 2011; 108(10):1556-1563.
8. Finley DS, Pantuck AJ and Belldegrun AS. Tumor biology and prognostic factors in renal cell carcinoma. Oncologist. 2011; 16 Suppl 2:4-13.
9. Jonasch E, Futreal PA, Davis IJ, Bailey ST, Kim WY, Brugarolas J, Giaccia AJ, Kurban G, Pause A, Frydman J, Zurita AJ, Rini BI, Sharma P, Atkins MB, Walker CL and Rathmell WK. State of the science: an update on renal cell carcinoma. Mol Cancer Res. 2012; 10(7):859-880. 10. Tang SW, Chang WH, Su YC, Chen YC, Lai YH, Wu PT,
Hsu CI, Lin WC, Lai MK and Lin JY. MYC pathway is activated in clear cell renal cell carcinoma and essential for proliferation of clear cell renal cell carcinoma cells. Cancer Lett. 2009; 273(1):35-43.
11. Malo N, Hanley JA, Cerquozzi S, Pelletier J and Nadon R. Statistical practice in high-throughput screening data analysis. Nat Biotechnol. 2006; 24(2):167-175.
12. Ooi A, Wong JC, Petillo D, Roossien D, Perrier-Trudova V, Whitten D, Min BW, Tan MH, Zhang Z, Yang XJ, Zhou M, Gardie B, Molinie V, Richard S, Tan PH, Teh BT, et al. An antioxidant response phenotype shared between hereditary and sporadic type 2 papillary renal cell carcinoma. Cancer Cell. 2011; 20(4):511-523.
13. Kort EJ, Farber L, Tretiakova M, Petillo D, Furge KA, Yang XJ, Cornelius A and Teh BT. The E2F3-Oncomir-1 axis is activated in Wilms’ tumor. Cancer Res. 2008; 68(11):4034-4038.
14. Qian CN, Huang D, Wondergem B and Teh BT. Complexity of tumor vasculature in clear cell renal cell carcinoma. Cancer. 2009; 115(10 Suppl):2282-2289.
15. Daurkin I, Eruslanov E, Stoffs T, Perrin GQ, Algood C, Gilbert SM, Rosser CJ, Su LM, Vieweg J and Kusmartsev S. Tumor-associated macrophages mediate immunosuppression in the renal cancer microenvironment by activating the 15-lipoxygenase-2 pathway. Cancer Res. 2011; 71(20):6400-6409.
16. Fujita Y, Mimata H, Nasu N, Nomura T, Nomura Y and Nakagawa M. Involvement of adrenomedullin induced by hypoxia in angiogenesis in human renal cell carcinoma. Int J Urol. 2002; 9(6):285-295.
17. Verine J, Lehmann-Che J, Soliman H, Feugeas JP, Vidal JS, Mongiat-Artus P, Belhadj S, Philippe J, Lesage M, Wittmer E, Chanel S, Couvelard A, Ferlicot S, Rioux-Leclercq N, Vignaud JM, Janin A, et al. Determination of angptl4 mRNA as a diagnostic marker of primary and metastatic clear cell renal-cell carcinoma. PLoS One. 2010; 5(4):e10421.
18. Le Jan S, Amy C, Cazes A, Monnot C, Lamande N, Favier J, Philippe J, Sibony M, Gasc JM, Corvol P and Germain S. Angiopoietin-like 4 is a proangiogenic factor produced during ischemia and in conventional renal cell carcinoma. Am J Pathol. 2003; 162(5):1521-1528.
19. Minner S, Rump D, Tennstedt P, Simon R, Burandt E, Terracciano L, Moch H, Wilczak W, Bokemeyer C, Fisch M, Sauter G and Eichelberg C. Epidermal growth factor receptor protein expression and genomic alterations in renal cell carcinoma. Cancer. 2012; 118(5):1268-1275.
20. De Luca A, Carotenuto A, Rachiglio A, Gallo M, Maiello MR, Aldinucci D, Pinto A and Normanno N. The role of the EGFR signaling in tumor microenvironment. J Cell Physiol. 2008; 214(3):559-567.
Cancer Lett. 2007; 246(1-2):139-148.
22. Gonzalez AM, Gonzales M, Herron GS, Nagavarapu U, Hopkinson SB, Tsuruta D and Jones JC. Complex interactions between the laminin alpha 4 subunit and integrins regulate endothelial cell behavior in vitro and angiogenesis in vivo. Proc Natl Acad Sci U S A. 2002; 99(25):16075-16080.
23. Vainionpaa N, Lehto VP, Tryggvason K and Virtanen I. Alpha4 chain laminins are widely expressed in renal cell carcinomas and have a de-adhesive function. Lab Invest. 2007; 87(8):780-791.
24. Smallridge RC, Copland JA, Brose MS, Wadsworth JT, Houvras Y, Menefee ME, Bible KC, Shah MH, Gramza AW, Klopper JP, Marlow LA, Heckman MG and Von Roemeling R. Efatutazone, an oral PPAR-gamma agonist, in combination with paclitaxel in anaplastic thyroid cancer: results of a multicenter phase 1 trial. J Clin Endocrinol Metab. 2013; 98(6):2392-2400.
25. Mohamed AJ, Yu L, Backesjo CM, Vargas L, Faryal R, Aints A, Christensson B, Berglof A, Vihinen M, Nore BF and Smith CI. Bruton’s tyrosine kinase (Btk): function, regulation, and transformation with special emphasis on the PH domain. Immunol Rev. 2009; 228(1):58-73.
26. Behbahani TE, Thierse C, Baumann C, Holl D, Bastian PJ, von Ruecker A, Muller SC, Ellinger J and Hauser S. Tyrosine kinase expression profile in clear cell renal cell carcinoma. World J Urol. 2012; 30(4):559-565.
27. Nam JS, Hirohashi S and Wakefield LM. Dysadherin: a new player in cancer progression. Cancer Lett. 2007; 255(2):161-169.
28. Ino Y, Gotoh M, Sakamoto M, Tsukagoshi K and Hirohashi S. Dysadherin, a cancer-associated cell membrane glycoprotein, down-regulates E-cadherin and promotes metastasis. Proc Natl Acad Sci U S A. 2002; 99(1):365-370. 29. Schuler Y, Lee-Thedieck C, Geiger K, Kaiser T, Ino Y,
Aicher WK and Klein G. Osteoblast-secreted factors enhance the expression of dysadherin and CCL2-dependent migration of renal carcinoma cells. Int J Cancer. 2012; 130(2):288-299.
30. Berx G and van Roy F. Involvement of members of the cadherin superfamily in cancer. Cold Spring Harb Perspect Biol. 2009; 1(6):a003129.
31. Therrien M, Chang HC, Solomon NM, Karim FD, Wassarman DA and Rubin GM. KSR, a novel protein kinase required for RAS signal transduction. Cell. 1995; 83(6):879-888.
32. Llobet D, Eritja N, Domingo M, Bergada L, Mirantes C, Santacana M, Pallares J, Macia A, Yeramian A, Encinas M, Moreno-Bueno G, Palacios J, Lewis RE, Matias-Guiu X and Dolcet X. KSR1 is overexpressed in endometrial carcinoma and regulates proliferation and TRAIL-induced apoptosis by modulating FLIP levels. Am J Pathol. 2011; 178(4):1529-1543.
33. Fisher KW, Das B, Kortum RL, Chaika OV and Lewis RE.
Kinase suppressor of ras 1 (KSR1) regulates PGC1alpha and estrogen-related receptor alpha to promote oncogenic Ras-dependent anchorage-independent growth. Mol Cell Biol. 2011; 31(12):2453-2461.
34. van der Slot AJ, Zuurmond AM, Bardoel AF, Wijmenga C, Pruijs HE, Sillence DO, Brinckmann J, Abraham DJ, Black CM, Verzijl N, DeGroot J, Hanemaaijer R, TeKoppele JM, Huizinga TW and Bank RA. Identification of PLOD2 as telopeptide lysyl hydroxylase, an important enzyme in fibrosis. J Biol Chem. 2003; 278(42):40967-40972. 35. Gilkes DM, Bajpai S, Wong CC, Chaturvedi P, Hubbi ME,
Wirtz D and Semenza GL. Procollagen lysyl hydroxylase 2 is essential for hypoxia-induced breast cancer metastasis. Mol Cancer Res. 2013; 11(5):456-466.
36. Tanaka T, Yamaguchi J, Shoji K and Nangaku M. Anthracycline inhibits recruitment of hypoxia-inducible transcription factors and suppresses tumor cell migration and cardiac angiogenic response in the host. J Biol Chem. 2012; 287(42):34866-34882.
37. Tang SW, Yang TC, Lin WC, Chang WH, Wang CC, Lai MK and Lin JY. Nicotinamide N-methyltransferase induces cellular invasion through activating matrix metalloproteinase-2 expression in clear cell renal cell carcinoma cells. Carcinogenesis. 2011; 32(2):138-145. 38. Yoshino H, Enokida H, Itesako T, Tatarano S, Kinoshita
T, Fuse M, Kojima S, Nakagawa M and Seki N. Epithelial-mesenchymal transition-related microRNA-200s regulate molecular targets and pathways in renal cell carcinoma. J Hum Genet. 2013; 58(8):508-516.
39. Chedotal A, Kerjan G and Moreau-Fauvarque C. The brain within the tumor: new roles for axon guidance molecules in cancers. Cell Death Differ. 2005; 12(8):1044-1056. 40. Dhanabal M, Wu F, Alvarez E, McQueeney KD, Jeffers
M, MacDougall J, Boldog FL, Hackett C, Shenoy S, Khramtsov N, Weiner J, Lichenstein HS and LaRochelle WJ. Recombinant semaphorin 6A-1 ectodomain inhibits in vivo growth factor and tumor cell line-induced angiogenesis. Cancer Biol Ther. 2005; 4(6):659-668. 41. Fu L, Wang G, Shevchuk MM, Nanus DM and Gudas LJ.
Activation of HIF2alpha in kidney proximal tubule cells causes abnormal glycogen deposition but not tumorigenesis. Cancer Res. 2013; 73(9):2916-2925.
42. Yano Y, Hayashi Y, Sano K, Shinmaru H, Kuroda Y, Yokozaki H, Yoon S and Kasuga M. Expression and localization of ecto-nucleotide pyrophosphatase/ phosphodiesterase I-3 (E-NPP3/CD203c/PD-I beta/B10/ gp130RB13-6) in human colon carcinoma. Int J Mol Med. 2003; 12(5):763-766.
44. Fluge O, Bruland O, Akslen LA, Lillehaug JR and Varhaug JE. Gene expression in poorly differentiated papillary thyroid carcinomas. Thyroid. 2006; 16(2):161-175. 45. Furge KA, Tan MH, Dykema K, Kort E, Stadler W, Yao
X, Zhou M and Teh BT. Identification of deregulated oncogenic pathways in renal cell carcinoma: an integrated oncogenomic approach based on gene expression profiling. Oncogene. 2007; 26(9):1346-1350.
46. Safarinejad MR. Insulin-like growth factor binding protein-3 (IGFBP-3) gene variants are associated with renal cell carcinoma. BJU Int. 2011; 108(5):762-770.
47. Xian L, Wu X, Pang L, Lou M, Rosen CJ, Qiu T, Crane J, Frassica F, Zhang L, Rodriguez JP, Xiaofeng J, Shoshana Y, Shouhong X, Argiris E, Mei W and Xu C. Matrix IGF-1 maintains bone mass by activation of mTOR in mesenchymal stem cells. Nat Med. 2012; 18(7):1095-1101. 48. Shoji S, Tang XY, Umemura S, Itoh J, Takekoshi S, Shima
M, Usui Y, Nagata Y, Uchida T, Osamura RY and Terachi T. Metastin inhibits migration and invasion of renal cell carcinoma with overexpression of metastin receptor. Eur Urol. 2009; 55(2):441-449.
49. Yoshioka K, Ohno Y, Horiguchi Y, Ozu C, Namiki K and Tachibana M. Effects of a KiSS-1 peptide, a metastasis suppressor gene, on the invasive ability of renal cell carcinoma cells through a modulation of a matrix metalloproteinase 2 expression. Life Sci. 2008; 83(9-10):332-338.
50. Cvetkovic D, Babwah AV and Bhattacharya M. Kisspeptin/ KISS1R System in Breast Cancer. J Cancer. 2013; 4(8):653-661.
51. Takai N, Ueda T, Nasu K, Yamashita S, Toyofuku M and Narahara H. Targeting calcium/calmodulin-dependence kinase I and II as a potential anti-proliferation remedy for endometrial carcinomas. Cancer Lett. 2009; 277(2):235-243.
52. Colomer J and Means AR. Physiological roles of the Ca2+/ CaM-dependent protein kinase cascade in health and disease. Subcell Biochem. 2007; 45:169-214.
53. Marshall JL and Crosbie-Watson RH. Sarcospan: a small protein with large potential for Duchenne muscular dystrophy. Skelet Muscle. 2013; 3(1):1.
54. Falvella FS, Colombo F, Spinola M, Campiglio M, Pastorino U and Dragani TA. BHLHB3: a candidate tumor suppressor in lung cancer. Oncogene. 2008; 27(26):3761-3764.
55. Reinhold WC, Reimers MA, Lorenzi P, Ho J, Shankavaram UT, Ziegler MS, Bussey KJ, Nishizuka S, Ikediobi O, Pommier YG and Weinstein JN. Multifactorial regulation of E-cadherin expression: an integrative study. Mol Cancer Ther. 2010; 9(1):1-16.
56. Krause M, Dent EW, Bear JE, Loureiro JJ and Gertler FB. Ena/VASP proteins: regulators of the actin cytoskeleton and cell migration. Annu Rev Cell Dev Biol. 2003; 19:541-564. 57. Baldewijns MM, Thijssen VL, Van den Eynden GG, Van
Laere SJ, Bluekens AM, Roskams T, van Poppel H, De Bruine AP, Griffioen AW and Vermeulen PB. High-grade clear cell renal cell carcinoma has a higher angiogenic activity than low-grade renal cell carcinoma based on histomorphological quantification and qRT-PCR mRNA expression profile. Br J Cancer. 2007; 96(12):1888-1895. 58. Cooper SJ, von Roemeling CA, Kang KH, Marlow LA,
Grebe SK, Menefee ME, Tun HW, Colon-Otero G, Perez EA and Copland JA. Reexpression of tumor suppressor, sFRP1, leads to antitumor synergy of combined HDAC and methyltransferase inhibitors in chemoresistant cancers. Mol Cancer Ther. 2012; 11(10):2105-2115.
59. Grossman HB, Wedemeyer G and Ren LQ. Human renal carcinoma: characterization of five new cell lines. J Surg Oncol. 1985; 28(3):237-244.
60. Tun HW, Marlow LA, von Roemeling CA, Cooper SJ, Kreinest P, Wu K, Luxon BA, Sinha M, Anastasiadis PZ and Copland JA. Pathway signature and cellular differentiation in clear cell renal cell carcinoma. PLoS One. 2010; 5(5):e10696.
61. Kupershmidt I, Su QJ, Grewal A, Sundaresh S, Halperin I, Flynn J, Shekar M, Wang H, Park J, Cui W, Wall GD, Wisotzkey R, Alag S, Akhtari S and Ronaghi M. Ontology-based meta-analysis of global collections of high-throughput public data. PLoS One. 2010; 5(9).
62. Makarenkov V, Kevorkov D, Zentilli P, Gagarin A, Malo N and Nadon R. HTS-Corrector: software for the statistical analysis and correction of experimental high-throughput screening data. Bioinformatics. 2006; 22(11):1408-1409. 63. Schmittgen TD and Livak KJ. Analyzing real-time PCR
data by the comparative C(T) method. Nat Protoc. 2008; 3(6):1101-1108.