ISSN: 1992-8645 www.jatit.org E-ISSN: 1817-3195
151
CONCRETE CRACK DETECTION BASED MULTI-BLOCK
CLBP FEATURES AND SVM CLASSIFIER
1
RGUIG MUSTAFA, 2EL AROUSSI MOHAMED
1
LETI Laboratory, EHTP Casablanca
2
LETI Laboratory, EHTP Casablanca
E-mail: [email protected], [email protected]
ABSTRACT
Recently Automatic concrete crack detection has been converted to a real challenge for high performance of the inspection and diagnosis of concrete structures images. Generally, there are various noises such as irregularly illuminated conditions, shading and divots in the concrete images. Hence it is difficult to detect cracks automatically. In this paper, a novel and efficient approach based on Compound Local Binary Pattern (CLBP) using support vector machines is proposed for automatic concrete crack detection. The contributions of this paper include the following steps: (1) the proposed system starts by pre-processing the database images, smoothing their texture and enhancing any existing cracks, being followed by the extraction of descriptive features. Here each image is divided into several non-overlapping blocks and each block originates a feature vector. (2) The support vector machine (SVM) is successfully applied to determine the concrete crack image classification. The experimental results gave a 97.43% classification accuracy rate, which indicate that the proposed method is a promising tool for analysis of concrete structures images.
Keywords: Concrete Crack Detection, Concrete Structure, Compound Local Binary Pattern, Support
Vector Machine, Feature Extraction, Local Binary Pattern.
1. INTRODUCTION
Recently, image processing for visual inspection has become very important with the recent emergence of applications in various fields. Concrete is a material very often used for buildings. The degradation of concrete is caused by many factors such as earthquakes, frost damage, salt erosion, rain water, and dry shrinkage. Cracks are the separation of the construction, the areas between them are contiguous in moving and strain. The detection and computation of cracks afterwards is a different approach to understand the behavior of the construction, it can be used to decide the appropriate rehabilitation method to fix the cracked structures and may be crucial for reasons of safety and cost-effective maintenance of concrete structures.
Practically, cracks on concrete surfaces are traced manually for diagnosis. The major disadvantage of this approach is that it strongly depends on the specialist’s knowledge and experience and lack objectivity in the quantitative analysis. Also, cracks tend to display linear characteristics, besides, various noise conditions make it hard to see cracks
from a distance. Hence it is not easy to detect them by conventional methods because they cannot achieve precise detection because the image of the concrete surface contains various types of noise due to numerous causes such as concrete blebs, stain, insufficient contrast, and shading. So, there is a clear need for methods of automatic crack detection to solve the problem.
Feature extraction and classification are two main steps of a pattern recognition system based on image processing techniques [13][14]. Feature extraction gives an effective representation of images to decrease the computational complexity of the classifier, which can greatly enhance the performance of a crack detection system, while the objective of classification is to distinguish those features with a good classifier. Hence, in order to improve the recognition rate of an automatic crack detection system, it is crucial to find a good feature extractor and an effective classifier.
ISSN: 1992-8645 www.jatit.org E-ISSN: 1817-3195
152 irregularities in crack shape and size, various blemishes and irregularly illuminated conditions. In [1] authors proposed an inspection system to detect and analyze cracks on the concrete surfaces. Some image-processing techniques such as wavelet transform, shading correction, and binarization are combined to detect cracks. Also in [2] authors used Canny filter and Wavelet transform for concrete crack detection, but varying crack width in a concrete surface image is not considered.
Other approach [5] compared the performance of crack detection using wavelet transform, Fourier transform, and some filters such as Sobel and Canny filters.
Although in [3] a method for crack-detection based on percolation model was introduced to see the effectiveness of binarization after percolation processing. However optimization of threshold and procedure for edges, which are not considered as cracks, are not considered in this work.
In [6] authors evaluate various edge-detection algorithms, as well as transform and statistical-based methods, for their effectiveness in assessing damage in a concrete dam from digital borehole imagery obtained using an acoustic televiewer. A clustering technique was used to quantify damage from the imagery, such as vertical cracks, horizontal cracks, voids, stains, and foundation damage.
In [7] Kawamuraet al. proposed a method using a genetic algorithm for the semiautomatic optimization of image processing parameters for precise crack detection. However, these methods do not consider the essential characteristics of cracks such as its connectivity. Also, these methods use global image processing methods such as the wavelet transform by focusing on the characteristics of the entire image.
On the other hand, some approaches employ local image processing for crack detection. Local image processing is necessary to extract such typical local characteristics of cracks as the direction and connectivity. Roli proposed a method utilizing conditional texture anisotropy for crack detection in granite slabs [8]. This method uses the orientation feature in the local window. Fujitaet al. proposed two preprocessing methods using the subtraction method and the Hessian matrix [9].
Cracks with dark colors are easily detected, while cracks with unclear colors are difficult to detect since their brightness is similar to that of the background. Shape information is extremely effective for detecting the unclear cracks. There
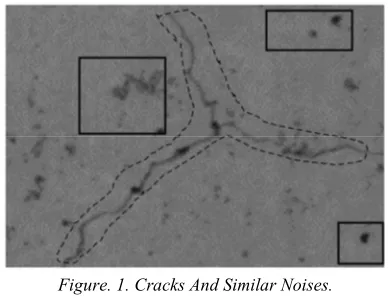
[image:2.612.325.519.154.303.2]exist several types of cracks, with different severity levels. Longitudinal, transversal, miscellaneous and alligator are the main crack types [10]. Figure. 1 shows examples of cracks and noises on a concrete surface.
Figure. 1. Cracks And Similar Noises. (Dashed Line: Cracked Part; Black Rectangle: Noisy
Part)
However these methods do quite well under some constrained conditions but still do not perform well in many real-world situations, especially when cracks are in complex background or in irregularly illuminated conditions. All the existing automatic analysis techniques [11] present some limitations in detecting all cracks for some images and, eventually they may detect a crack when there is none.
The Local Binary Pattern introduced by Ojala [12], has been a recently proposed texture descriptor which attracted the research community rigorously towards texture based analysis of images. LBP has been proved to be theoretically very simple, yet computational efficient approach for texture classification. It provide a unified description including both statistical and structural characteristics of a texture patch, so that it is powerful for texture analysis. Many texture descriptors have been developed as variants of Local Binary Pattern, because of its success. Faisal Ahmed [20] proposed Compound LBP (CLBP) which exploits 2P bits to encode a local neighborhood of P neighbors and magnitude of center and neighborhood pixels.
ISSN: 1992-8645 www.jatit.org E-ISSN: 1817-3195
153 The rest of this paper is organized as follows. A block diagram illustrating the main steps of the proposed approach is introduced in section 2. In section 3 a brief description of the SVM classifier is presented. Experimental results are presented and discussed in Section 4. Finally, conclusions and future work are stated in the last section.
2. THE PROPOSED CONCRETE CRACK
DETECTION APPROACH
Image processing techniques for automatic crack detection and identification are the focus of this paper. A main step in any kind of pattern recognition problem is the representation of data in a reduced number of dimension. This is carried out to improve classification. The purpose of feature extraction is to present the original data in a reduced form by measuring discriminative properties that can distinguish cracks. A summary of available techniques is presented in [16], Figure. 2 shows the general concrete crack detection system architecture.
The architecture presented in Figure 2 includes four main steps: i) pre-processing, ii) feature extraction iii) crack detection and iv)crack classification. In the first stage, the input image is filtered to remove noise and to enhance crack visual features. Then, the features are extracted from the pre-processed images. Based on the computed feature values, each image pixel block is classified as containing cracks or not, by the crack detection algorithm. Finally, the detected cracks can be classified according to their geometric properties.
2.1 Preprocessing
The role of the pre-processing step consists of removing, as much as possible, the noise and smoothing the road texture, while keeping the ability to identify eventually existing cracks. Depending on the pre-processing techniques selected, the overall crack detection results can be considerably improved, speeding up also the image processing [10]:
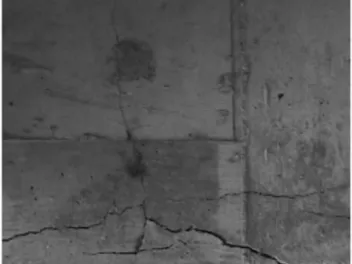
[image:3.612.312.528.59.204.2]In Fig.3 an example of a pre-processed image with histogram equalization is presented. The non-uniform illumination is considerably removed, producing a more uniform image without affecting much the crack pixels.
Figure.3 Example Of An Input Image (Top) And The Pre-Processed Image With Histogram Equalization (Bottom)
2.2 Feature extraction
In this paper, the feature descriptor is constructed with the Compound Local Binary Pattern (CLBP), an extension of the LBP for concrete crack detection.
2.2.1 Local Binary Pattern (LBP)
LBP is a gray-scale and rotation invariant texture primitive that describes the spatial structure of the local texture of an image[17]. LBP was first introduced by Ojala et al. [12]who showed the high discriminative power of this operator for texture classification. It can extract the local neighbor texture information of grayscale image.
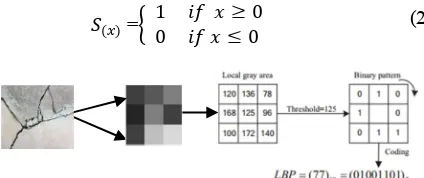
The basic form of an LBP operator on square image structure labels the pixels of an image by thresholding the 3*3 neighborhood of each pixel by the grey value of the pixel (the center). An illustration of the basic LBP operator is shown in (Figure.4). Note that the binary LBP code is circular. The basic LBP consists of 8 binary bits representing an integer from 0 to 255.
Formally, the LBP operator takes the form:
LBP x , y 2 s ,
Where corresponds to the grey value of the center pixel , , in to the grey values of the 8 surrounding pixels, and function is defined as:
= 1 0 00
[image:3.612.313.525.628.717.2]ISSN: 1992-8645 www.jatit.org E-ISSN: 1817-3195
154 In order to reduce the complexity of computation, uniform LBPs have been defined as shown in [17]. A uniform LBP is a LBP that contains at most two bit wise 0-1 or 1-0 transitions.
For example,00000000, 00001000 and 11000111 are uniform patterns. With this extension, there are 58 uniform LBP code patterns for 8 bit basic LBP code, and 256-58=198 non-uniform LBP code patterns.
The ULBP form is shown in equation (3) as follows:
!"# $ 2 s , !"# 0
9 &'()*+ ,)
And to quantify these !"#, a uniformity measure was introduced. This uniformity measure is shown in equation (4) as follows:
!"# | ./0 0 0 |
1 2 | 0
0 ./0 |
Therefore, uniform patterns are able to describe significant local texture information, such as bright spot, flat area or dark spot, and edges of varying positive and negative curvature [19]. The basic LBP operator discards the magnitude information of the differences between the center and the neighbor gray values in a local neighborhood. As a result, the LBP method tends to produce inconsistent codes in many cases. One example is shown in Figure.5. Here, the 8-bit uniform LBP code (11111111) corresponds to a flat area or a dark spot at the center pixel which is not consistent with the local region [19].
Figure.5. Generation Of Inconsistent Binary Pattern In The LBP Encoding Approach.
2.2.2 Compound Local Binary Pattern (LBP)
The original LBP encoding scheme considers only the sign of the difference between two gray values and thus, it often fails to generate binary codes consistent with the texture property of a local region. Being motivated by this, we use CLBP, an extension of the original LBP operator that assigns a 2P-bit code to the center pixel based on the gray values of a local neighborhood comprising P neighbors [20]. Unlike the LBP operator that employs one bit for each neighbor to represent only the sign of the difference between the center and the corresponding neighbor gray values, the proposed method uses two bits for each neighbor in order to encode the sign as well as the magnitude information of the difference between the center and the neighbor gray values. Here, the first bit represents the sign of the difference between the center and the corresponding neighbor gray values like the basic LBP encoding. The other bit is used to encode the magnitude of the difference with respect to a threshold value, which is the average magnitude Mavgof the difference between the
center and the neighbor gray values in the local neighborhood of interest. The CLBP operator sets this bit to 1 if the magnitude of the difference between the center and the corresponding neighbor is greater than the threshold Mavg. Otherwise, it is
set to 0. Thus, the indicator s(x) of equation2 is replaced by the following function:
,23, 4
5 6 7 6
800 30 9 0, :30 : ;<=>
01 30 9 0, :30 : ? ;<=>
10 30 0, :30 : 9 ;<=>
11 &'()*+ ,)
Here, ic is the gray value of the center pixel, ip is the
gray value of a neighbor p, and Mavg IS THE
AVERAGE MAGNITUDE OF THE difference between ip and ic in the local neighborhood. The
CLBP operator is illustrated in Figure.6.
Figure.6. Illustration Of The Basic CLBP Operator. Here, The CLBP Code = 1010101010111111 For Pixel C. (3)
ISSN: 1992-8645 www.jatit.org E-ISSN: 1817-3195
155 From Figure.5, it can be observed that, unlike the LBP encoding shown in Figure 4, the proposed CLBP method discriminates the neighbors in the north-east, east, and south-east directions as they have higher gray values than the other neighbors and thus, produces a pattern consistent with the local texture property.
[image:5.612.95.305.315.455.2]In the proposed method, the local feature extraction begins with dividing each image into non-overlapping blocks having a given size, to form the CLBP texture feature vector. Individual CLBP histograms are generated from each block and concatenated to form the CLBP texture feature vector of the input crack image. This step aims to extract appropriate texture features, to form the global histogram, simply bring together all local histograms already extracted from image block divisions (Fig.7).
Figure. 7. Global Histogram Of CLBP
3. SUPPORT VECTOR MACHINES
After performing crack detection, the final stage of the proposed architecture is crack classification, aiming to assign a crack type to each previously detected crack. Although some papers address this stage, they do not perform it after detecting the cracks. They simply label the crack type for each image without having detected the cracks automatically first. This section addresses support vector machines (SVM), the classifier used in this dissertation for the detection of concrete surface cracks.
An SVM classifier, just like other learning algorithms, is composed by training and testing stages [2]. In the training stage the selected features are extracted and typically mapped into a higher dimensional space in order to efficiently separate crack features from non-crack features. Since the ground-truth of the training set is supplied, the
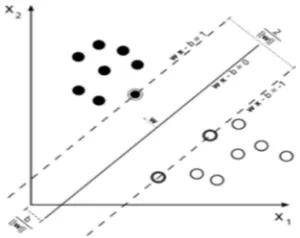
features that correspond to cracks and to non-cracks can be determined. Then, as illustrated in Figure.6, SVM selects the set of points in each class (support vectors) that are the nearest to the other class and through them computes a hyperplane that separates the two classes, being as far as possible from the support vectors. This hyperplane is often call maximum-margin hyperplane and makes SVM robust.
[image:5.612.343.493.321.440.2]Once the system has been trained, the following phase is the testing stage. In this stage each testing sample is classified as belonging to one of the two pattern classes. For that the testing set features are mapped into the same dimensional space produced in the training stage and, according to the hyperplane side they fall, the corresponding pattern class is attributed. Finally, the classifier accuracy can be evaluated by comparison against a set of manually labeled data.
Figure. 8. SVM Feature Space Example That Selects The Support Vectors To Separate The Two Pattern Classes
Through A Hyperplane.
The example illustrated in Figure.8is very simple and there is no need to map the extracted features into a higher dimensional space since they can be easily separated by a hyperplane. However the typical case is much more complex and the two classes are often mixed, being necessary to map the features to separate better the two classes. Note that in Figure.8several different hyperplanes could separate the two classes. However the hyperplane computed, tries to be as far as possible from the support vectors.
Given a training set of instance-label pairs {xi, yi},
i=1,...,l where xi ∈ R and y ∈ {-1,1}l, the support vector machines require the solution of the following optimization problem:
min
D,E,F
1
2 GH G 1 I JK
L
K /
Subject to:
ISSN: 1992-8645 www.jatit.org E-ISSN: 1817-3195
156
GHM
K 1 N 1 0 JK, JK 0
Here training vectors xi are mapped into a higher
(maybe infinite) dimensional space by the function Φ. Then SVM finds a linear separating hyper plane with the maximal margin in this higher dimensional space. C > 0 is the penalty parameter of the error term. We can define, K(xi,xj)= Φ(xi)TΦ (xj) called
the kernel function. Though new kernels are being proposed by researchers, the most common four basic kernels are: Linear, Polynomial, Radial basis function (RBF) and Sigmoid.
• Linear: K(xi,xj)=xiTxj
• Polynomial: K(xi,xj)=(ϒxixj+r)d ,ϒ>0
• Radial basis function (RBF): K(xi,xj)= exp(-ϒ||xi- xj||2 ),ϒ>0
• Sigmoid: K(x,x)=tanh (ϒxiTxj+r)
Where ϒ, r and d correspond to kernel parameters that can be defined or estimated.
4. EXPERIMENTAL RESULTS AND DISCUSSION
4.1 Database
Concrete crack images were captures from different cracks and under different conditions. The database contains 50 bridges images, out of which 25 are cracked and 25 are non-cracked. Some images are shown in Figures. 2–5 of specific interest is the image shown in Figure. 2which is a sample of a no-cracked bridge deck. The presence of such an image in the non-cracked database can cause miss identification due to manmade lines in the concrete surface. This concrete bridge is misidentified with crack especially when linear structure detectors were applied. Variety of cracked images is depicted in Figures.9-12. These cracks can be classified into longitudinal, transverse, and alligator. The longitudinal and transverse cracks occur due to the application of load [15]. The alligator cracks take place usually in the bottom of the bridge decks due to high tensile stress and strain.
In this study, the training set contains 5 cracked (numbered 1–5) and 5 non-cracked (numbered 6– 10) images. After processing training set images, 40 images are tested. Images 11–30 are cracked and images 31–50 are no cracked.
[image:6.612.341.520.406.535.2]Figure. 9. Non-Cracked Bridge Image.
[image:6.612.345.521.570.702.2]Figure.10. Concrete Bridge Image With Longitudinal Crack
Figure.11. Concrete Bridge Image With Transverse Crack
ISSN: 1992-8645 www.jatit.org E-ISSN: 1817-3195
157
4.2 Experiment setup
The experiments were carried out in Matlab (R2012a), on a 64-bit, PC with an i5 microprocessor with 4 cores, 4 GB of RAM and a hard disk of 250 GB. In our proposed approach we apply CLBP on block by block basis of N by N pixels, this is performed by dividing a region of interest (ROI) 48×48 into several blocks from which the features are extracted. Different values of N {8, 12, 16 and 24} are considered to see the fact of different number of blocks on the recognition rate. Some experiments also have been conducted to measure the performance of support vector machines (SVM), using different kernel functions especially SVM with polynomial, radial basis function (RBF) and linear kernel. In addition to test the effectiveness of CLBP as a mean of features extraction, the performance of this method is compared against other methods in terms of classification accuracy.
4.3 Results and discussion
The classification rate of the proposed method can be influenced by adjusting the number of regions into which the crack images are to be partitioned. As stated above in our approach information of concrete crack ROI is captured using the block based CLBP histogram. The SVM classifier is used to classify the feature vector to better validate our proposed technique. So the challenge here is to deal with two major questions:
• What is the optimal block size for CLBP which can bring in improvements in the detection?
• What are the optimal SVM parameters that produce the best classification accuracy?
The First analysis investigated the effect of numbers of features extracted using various sizes of sub block windows. We considered four cases in our experiments, where images were divided into 8×8, 12×12, 16×16 and 24×24 regions. This was carried out to find the best size of CLBP block window.
SVM classification approach is applied to our feature vector with different kernel functions: RBF, linear and polynomial. In general, RBF kernel is a reasonable first choice when we want to implement SVM. RBF kernel non-linearly maps the feature vectors into a higher dimensional space and therefore, unlike the linear kernel, it can handle the
case when the relation between class labels and attributes is nonlinear [18].
According to the proposed methodology, first we checked the performance of SVM with RBF kernel on the selected ROIs with different block sizes. This kernel has its own parameters which need to be optimized in order to improve the performance rate of the classifier [18]. We initiate the division by small blocks (8×8), followed by medium blocks (12×12) and finally, we finish by large blocks (16×16 and 24×24).
Results in Table I reveals that performing classification on the Block-Based CLBP input vector with SVM using RBF kernel gives the best classification rate (97.43%) at 16×16 blocks.
Table1:Performance Of SVM With RBF Kernel Using Block Based CLBP Feature Set
Block size Accuracy (%)
8×8 93.36
12×12 94.02
16×16 97.43
24×24 95.30
We now examine the performance of SVM with linear kernel. Unlike the rest of the kernels, this kernel has only one tunable parameter (C) [18]. Similar to the previous case, we also compared the performance of SVM as we used different block sizes: The best classification rate (94.80%)is obtained at 16×16 blocks. Results are shown in table II
.
Table2:Performance Of SVM With Linear Kernel Using Block Based CLBP Feature Set
Block size Accuracy (%)
8×8 92.56
12×12 93.50
16×16 94.80
24×24 94.00
Table III gives the performance of SVM with polynomial kernel on the selected ROIs from the database. This kernel depends on its degree parameter which affects the classification performance with its variations along with other associated parameters. In our case the optimal degree of polynomial kernel is quadratic (2). The best classification rate (95.88%) is obtained at 16×16 blocks
.
Table3:Performance Of SVM With Polynomial Kernel Using Block Based CLBP Feature Set
Block size Accuracy (%)
ISSN: 1992-8645 www.jatit.org E-ISSN: 1817-3195
158
12×12 93.90
16×16 95.88
24×24 95.07
Results from tables I, II and III support the idea that in our case, SVM classifier gives better accuracy using RBF kernel at 16×16 blocks. As stated above, for Support Vector Machine proper parameter setting in the kernels increases SVM classification accuracy. There are two parameters to be determined in the SVM model with the RBF kernel: C and gamma (γ). The gamma parameter automatically defines the distance which a single training example can reach, with low values meaning ‘far’ and high values meaning ‘close’. The C parameter gives the trade-off of training examples misclassification against decision surface simplicity. Lower C values ensure a smooth decision surface while higher C values attempts to classify training examples accurately. Experiments are carried out to evaluate SVM performance through variations of the Gamma and C parameters. Experiments for SVM-RBF were conducted with C value maintained at a constant value of 0.125 and Gamma value is varied (0.125, 0.25, and 0.75). The classification accuracy achieved is presented in Table IV.
Table4:Performance Of SVM –RBF According To Gamma Value
Gamma Accuracy (%)
0.125 93.36
0.25 95.89
0.75 97.43
0.90 96.07
It is observed from the Table that the varying of the parameter Gamma has a significant effect on the classification accuracy. Also, higher value of Gamma leads to efficient performance of the SVM. The best classification accuracy was obtained for Gamma value of 0.75.
To demonstrate the effectiveness of CLBP approach against Uniform LBP. The same steps were applied on the same data set of crack images selected in this work.
Table5:Accuracy Of CLBP Against LBP
CLBP (%) ULBP (%)
97.43 96.07
From the experimental results, it can be said that, crack feature representation based on the CLBP is
more robust and provides higher classification rate than the ULBP approach, even with low resolution images. The superiority of the CLBP encoding is due to the utilization of the magnitude of the difference between the center and the neighbor gray values by integrating it with the basic LBP pattern to get a compound binary code, which preserves some important texture information discarded by the original LBP operator. Thus, this method provides an effective and efficient approach to automatic crack detection.
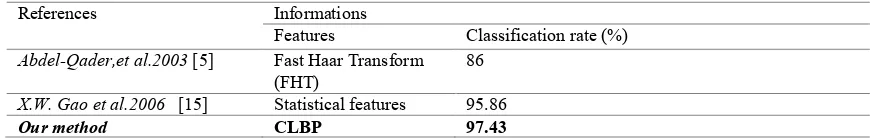
Finally, table VI presents a comparison in terms of accuracy of some representative approaches reported in literature for automatic cracks detection. It is difficult to compare the published work on concrete crack detection. Studies are based on different data and either consider the complete task chain of detection, classification or focus on the classification part only.
The table gives the features and classifiers used in the original works. However comparing the published works on automatic crack detection remains a difficult task because many factors can affect the accuracy of a classification system. The accuracy of a classification system depends strongly on the used experimental protocol e.g. the used database, the number of ROIs,
The results obtained from table VII showed that the proposed method showed much better than the other researches. Generally, the feature extraction scheme based on combination of block based CLBP and SVM-RBF has reached an important classification rate.
4. CONCLUSION
ISSN: 1992-8645 www.jatit.org E-ISSN: 1817-3195
159
REFRENCES:
[1] Ito, A., Aoki, Y., & Hashimoto, S. (2002, November). Accurate extraction and measurement of fine cracks from concrete block surface image. In IECON 02 [Industrial Electronics Society, IEEE 2002 28th Annual Conference of the] (Vol. 3, pp. 2202-2207). IEEE.
[2] Hutchinson, T. C., & Chen, Z. (2006). Improved image analysis for evaluating concrete damage. Journal of Computing in Civil Engineering.
[3] Yamaguchi, T., Nakamura, S., Saegusa, R., Hashimoto, S.: Image based crack detection for real concrete surfaces. Trans. Electr. Electron. Eng.3, 128–135 (2008).
[4] Kawamura, K., Miyamoto, A., Nakamura, H., Sato, R.: Proposal of a crack pattern extraction method from digital images using an interactive genetic algorithm. Proc. Japan Soc. Civ. Eng.742, 115– 131 (2003)
[5] Abdel-Qader, I., Abudayyeh, O., Kelly, M.E.: Analysis of edge detection techniques for crack identification in bridges. J. Comput. Civ. Eng.17 (3), 255–263 (2003)
[6] Kabir, S., Rivard, P., He, D., Thivierge, P.: Damage assessment for concrete structure using image processing techniques on acoustic borehole imagery. Constr. Build. Mater.23 (10), 3166–3174 (2009).
[7] Kawamura K, Miyamoto A, Nakamura H, Sato R. Proposal of a crack pattern extraction method from digital images using an interactive genetic algorithm. Proceedings of Japan Society of Civil Engineers2003; 742:115–131.
[8] Roli F. Measure of texture anisotropy for crack detection on textured surfaces. Electronics Letters1996; 32(14):1274–1275.
[9] Fujita Y, Mitani Y, Hamamoto Y. A method for crack detection on a concrete structure. Proceedings of International Conference on Pattern Recognition2006; 3:901–904.
[10] Marques, A. G. C. S., &Correia, P. L. (2012). Automatic Road Pavement Crack Detection using SVM. Lisbon, Portugal: Dissertation for the Master of Science Degree in Electrical and Computer Engineering at Instituto Superior Técnico.
[11] T. Nguyen, M. Avila and S. Begot, "Automatic detection and classification of defect on road pavement using anisotropy measure," in Proceedings of the 17th European Signal
Processing Conference, Glasgow, Scotland, 2009.
[12] T. Ojala, M. Pietikäinen, and D. Harwood, “A comparative study of texture measures with classification based on featured distributions,” Pattern Recognition, vol. 29, no. 1, pp. 51 – 59, 1996.
[13] El Margae, S., Kerroum, M. A., & Fakhri, Y. (2015). Fusion of Local and Global Feature Extraction Based on Uniform LBP and DCT for Traffic Sign Recognition. International Review on Computers and Software (IRECOS), 10(1), 52-60.
[14] Sanae Berraho, Mounir AitKerroum, and Youssef Fakhri. A hybrid feature extraction scheme based on dwt and uniform lbp for digital mammograms classification. International Review on Computers and Software (IRECOS), 10(1), 2015
[15] Marques, A. G. C. S., &Correia, P. L. (2012). Automatic Road Pavement Crack Detection using SVM. Lisbon, Portugal: Dissertation for the Master of Science Degree in Electrical and Computer Engineering at Instituto Superior Técnico.
[16] T. Nguyen, S. Begot, F. Duculty, J. Bardet and M. Avila, "Pavement Cracking Detection Using an Anisotropy Measurement," in 11th IASTED International Conference on Computer Graphics and Imaging - CGIM, 17-19 February, Innsbruck, Austria, 2010.
[17] Nayar SK, Poggio T. Early visual learning. New York: Oxford University Press; 1996. [18] C.W. Hsu, C.C. Chang, C.J. Lin, A practical
guide to support vector classification, Department of Computer Science, National Taiwan University, Taipei 106, Taiwan, March 2008.
[19] Ojala T., Pietikainen M., and Maenpaa T., “Multiresolution Gray-Scale and Rotation Invariant Texture Classification with Local Binary Patterns,” IEEE Transaction on Pattern Analysis and Machine Intelligence, vol. 24,no. 7, pp. 971-987, 2002.
ISSN: 1992-8645 www.jatit.org E-ISSN: 1817-3195
[image:10.612.90.472.70.203.2]160
Figure. 2. General Architecture Of An Automatic Concrete Crack Detection System
Table 6: Comparison In Terms Of Accuracy Of Some Representative Approaches Reported In Literature For Automatic Cracks Detection
References Informations
Features Classification rate (%) Abdel-Qader,et al.2003 [5] Fast Haar Transform
(FHT)
86
X.W. Gao et al.2006 [15] Statistical features 95.86
[image:10.612.87.522.267.336.2]