QOS BASED HYBRID SWARM INTELLIGENT INTRUSION
DETECTION SYSTEM FOR NETWORK SECURITY
E.BHARATHI1 and Dr.A.MARIMUTHU2
1Assistant Professor, Department of Computer Applications(MCA), Dr.SNS Rajalakshmi College of Arts
& Science(Autonomous), Coimbatore -641049.
2 Associate Professor, Department of Computer Science, Govt.Arts College (Autonomous), Coimbatore
-641018.
Email: [email protected], [email protected]
ABSTRACT
Intrusion detection system plays a vital role in system security which operates data in real time that may leads to dimensionality problem. As the number and size of the Network and Internet traffic increase and the need for the intrusion detection grows in step to reduce the overhead required for the intrusion detection and diagnosis, it has made public servers increasingly vulnerable to unauthorized accesses and incursion of intrusions. However, detecting the new type of attacks on a network system is a very difficult problem from the perspective of the classification mechanism of IDS. This research work presents swarm intelligence based approach for IDS to solve the QoS multicast routing problem of the entire network. In this paper, the Artificial Bee Colony operators are integrated with Genetic Algorithm (GA) where the employed Bees, Onlooker Bees and Scout Bees are there to improve the solution space named as Artificial Bee Genetic Colony Algorithm (ABGCA). Whereas Genetic algorithms belong to evolutionary algorithms, which produce solutions to optimization problems by means of approaches motivated by natural evolution. Artificial Bee Colony (ABC) is an algorithm derived from the intelligent actions of honey bee swarm. In the proposed approach, the operators of ABC are integrated with GA for local search strategy. In order to improve the overall performance of the system, hybrid swarm intelligence techniques can be used in IDS. The simulation results show that this algorithm has fast convergence and it improves the network security of the system.
Keywords: Quality of Service; Intrusion detection system; Multicast routing; Artificial bee colony; Genetic Algorithm.
1. INTRODUCTION
The security of a mainframe system or network is compromised when an intrusion is takes place. Accordingly, Intrusion Detection System (IDS) have become a vital part of security to identify threats and to follow the intruders. Since IDS should have a high value of attack Detection Rate (DR), with a low value of False Alarm Rate (FAR) simultaneously, structure of IDS is a tedious task [1]. Therefore, a new generation of computational approaches and materials is needed to detect intrusion from the fast growing volume of data. For this reason, data mining becomes the consistent solution for explaining the patterns that lie beneath in it. Data mining is the function of specific algorithms that has been generally employed for extracting patterns from data [2]. Two main things in data mining are data classification and feature
selection of data. Though, existing data classification and feature selection approaches used in data management are no longer sufficient to identify intrusive data. This insufficiency has incited the requirement for a novel intellectual technique based on stochastic population-based optimization that may possibly determine useful information from data [3].
258 To attain this, it is necessary to confine the collision of parameters on network performance regarding application specifications. Intrusion detection is also an object tracking process in a WSN can be look upon as a monitoring system for finding the intruder that attack the network area. Therefore, it is essential to expand and security system which is able to managing wide-ranging malicious attacks with energy conservation mechanism to increase system lifetime. In [5] and [6] the author illustrated that the sensor nodes can improve the performance and makes longer the system lifetime. Likewise, nodes with better resources provide as CHs performing computationally exhaustive tasks whereas reasonably priced less capable SNs are used mainly for sense the environment. Therefore, the heterogeneous WSN raises the detection probability for a known intrusion detection system. It is generally said in the research that clustering [7], is an effectual solution for attaining scalability, energy conservation, and reliability.
Multipath routing in WSN is a well thought-out process for fault and intrusion tolerance to develop data communication and data deliverance in WSNs. The majority of earlier research focused on using multipath routing to progress reliability [8] and to tolerate insider attacks [9]. Though, these studies mainly ignored energy consumption which can harmfully cut down the lifetime of the system. The research problems are to improve an Intrusion Detection System (IDS) of a WSN to extend its lifetime operation in the existence of changeable and malicious nodes. Additionally, to deal with the energy consumption and QoS gain in reliability, minimum delay and security with the objective to maximize the lifetime of a WSN whereas satisfying all the QoS requirements of multipath routing. To analyze the optimal quantity of redundancy the data are routed to a base station with untrustworthy and malicious nodes, so that the data release hit probability is increased whereas the WSN lifetime increases.
Due to the high demand of significant quality of services (QoS), a number of rigid QoS criteria, such as delay, bandwidth, delay jitter, and packet loss ratio, have been considered. Multicast routing algorithms would be able to satisfy the QoS requirements of the real-time applications for the high-speed information networks. The main goal of multicast routing algorithm is to minimize the communication resources used by the multicast session. This is achieved by minimizing the cost of the multicast tree, which is the sum of the costs of the links in the multicast tree.
The least-cost multicast routing problem is called as NP-Complete problem. The majority of the multicast routing algorithms make use of heuristic algorithms, such as the Kompella-Pasquale-Polyzos (KPP) heuristic [10], the Bounded Shortest Multicast Algorithm (BSMA) heuristic [11] etc. On the other hand, the results of earlier work are too slow or cannot calculate QoS constrained multicast trees with low costs. As such that, the deterministic heuristic algorithms for QoS constrained multicast routing are generally very slow, methods based on computational intelligence such as Neural networks, Genetic algorithms (GA) and Ant colony optimization algorithm (ACO) have been proposed for solving the QoS multicast routing problem. In the area of computational intelligence, GA-based algorithms have come into view as a powerful tool for solving NP-complete constrained optimization problems. GA-based algorithms [12] have been introduced for solving the QoS multicast routing problem. Xiang et al. [13] have planned as a GA-based algorithm for QoS multicast routing in general case. Wang et al. [14] presented a GA-based algorithm for delay-constrained least-cost multicast routing problem. They have employed a tree data structure for genotype demonstration; however this algorithm is being short of local search ability. Also, adaptive genetic simulated annealing algorithm (AGSAA) is presented to overcome the drawbacks and improve the Qos constraints performance. Even though the existing AGSAA algorithm has certain drawbacks like delay etc, to overcome the problem and improve the security a novel approach is proposed in this paper.
In this paper, the Artificial Bee Colony operators with Genetic Algorithm (GA) are proposed. Also an IDS system is introduced among two communication nodes to find the presence of intruder. Hence the network security performance gets improved.
2. PROBLEM FORMULATION
In A network can be explained as a weighted graph , , where V represents set of nodes correspond to routers, E is called as set of links that connect the routers. Let , represents route from source node ∈ to destination node . , is a multicast tree. ∈ represents destination nodes set in multicast tree [15].
Let be non-negative real numbers set. For each link ∈ , five non-negative real value functions can be define as cost function
, bandwidth function !" : → , delay jitter function _ %!&: → , packet loss ratio function '( _ : →
.
The total cost of multicast tree , is defined as the sum of the cost of all links in that tree and can be given by
) , * + ∈,
, is the routing path between source node s and destination node of multicast tree , ), which has following relations:
) , * + ∈,
!") , *
,!∈, !" '(_ ) , *
1 ∏∈,/1
'( _ 0 _%!&) , *
+ _%!& ∈,
The QoS multicast routing problem can be described as follows: Given network graph G, a source node s, a set of multicast destination nodes M, and the delay constraint , delay jitter constraint 1, bandwidth constraint and packet loss ratio constraint 2. The problem is defined as minimization of the cost function ) , *subject to the following conditions [16]:
, 3
!" , 4
_%!& , 3 1
'(_ , 3 2
3. MATERIALS AND METHODS
The algorithms proposed in this paper is explained below,
3.1 ABC Algorithm
The ABC algorithm is a swarm based, meta-heuristic algorithm proposed by [17] [18] on the foraging behaviour of honey bee colonies. The artificial bee colony consists of three bees; they are employed bees, onlookers and scouts. A promising solution to the optimization problem is denoted as the place of a food source and the amount of a food source significant to the quality (fitness) of the related solution. The amount of the employed bees is equivalent to the amount of solutions in the
population. At the initial step, a randomly distributed initial population is generated. An employed bee produce changes on the source position in its memory and measures the fitness at that position. If the fitness of the new position is superior to the preceding position, the bee stores the new source position and replaces the old one in memory. Later than all the employed bees have examined the new positions, the onlookers bees go to these positions through more onlookers moving to better positions and fewer onlookers moving to less fit position. The onlooker bees also formulate a change on that position and calculate the fitness at that position. The scout bees randomly select positions to assess.
This cycle maintain until the termination criteria is meet. Furthermore if the fitness of definite employed bee does not progress for a moment then that employed bee is transformed to a scout bee.
It is known from that there are three control parameters employed in the essential ABC: The number of the food sources is equivalent to the number of employed or onlooker bees (SN), the value of frontier and the maximum cycle number (MCN). The continued analysis and improvement of the bee colony are based on the fast discovery and efficient use of the best food resources. Likewise, the best solution of tricky engineering problems is associated to the relatively fast discovery of good solutions especially for the problems that required to be solved in real time. In a robust search process, exploration and exploitation processes should be carried out at once. In the ABC algorithm, while onlookers and employed bees carry out the exploitation process in the search space, the scouts control the exploration process.
A random population X , … , X is initialized, where, X x , x , … , x. Each solution vector is generated by the following equation
x
x
8 )x
x* rand /0, 10 1 where, j = 1, 2,…, D; i 1, 2, … , w xand xrespectively correspond to the upper and lower bounds for the dimension j
260 Then, each employed bee found new sources whose quantity is equal to half of the total number of sources. To find a new source v see as follows
v x8φx x (2)
where, φdenotes a uniformly distributed real random number within the range [-1, 1]
k represents the index of the solution chosen randomly from the colony (k = int(rand S) + 1) j = 1. . . D; D denotes the dimension of the problem.
Behind generating the new food source, the nectar amount will be evaluated and a greedy selection will be performed. If the quality of the new food source is better than the current position, the employed bee foliage its position and travel to the new food source. Also that, if the fitness of the new food source is equal or better than that of X, the new food source takes X in the population and develop into a new member. Hence, after creatingvAAAB, they compared xAAABsolutions and the best one was used as the source.
In the third step, onlooker bees choose a food source with the probability as in Equation 3 produces a new source in selected food source by equation (2). Once the new food source is generated, it will be calculated and a greedy selection will be functional, as like employed bees. As for employed bee, the better source is determined to be increased.
P
∑ౠసభ (3)
where, fitis the fitness of the solution xAAAB
Scout bees do not employ any prior knowledge and particulars when they are considering for nectar sources, and as such, their research was arbitrarily done. The scout bees are chosen between the employed bees with regard to the limit parameter. If a solution that indicates a source is not understands within a certain amount of trials, in that case source is discarded. The bee randomly finds new source using scout bee. The number of input and output to a source is related to ‘limit’ parameter. A new source of a scout bee is determined by Equation 4.
x x8 )x x* ∗ rand
(4)
Based on the above equation, each employed bee searches the neighborhood of its current food source to determine a new food source.
In ABC, the employed and the onlooker bees give out in the operation and the scouts serve in the process of exploration. Bees work for the
maximization of the quantity of the foods that are brought to the nest. The maximization of the objective function isFθ.
where, θ∈ R is done in the maximization problem
θrepresent the position of the ith source Fθdenotes the nectar amount in this source Pc |θc|, i 1,2, … . , S is the population of the sources including the positions of all the sources. Selecting a source of onlooker bees is based on the value of Fθ.
The more nectar amount of a source denotes more probability that the source would be selected. It means that, the probability of selecting a nectar source in the position is:
P !θ
∑ౡసభ!θౡ (5)
θc, where k is different from I, are randomly formed indices of a solution in the population.
After the onlooker bee observes the dance of the employed bees and selects the source with the equality (equation (6)), it identifies a neighboring source and takes its nectar. The position information of the chosen neighbor is computed by the following equation:
c 8 1
θc N ϕc (6)
where,ϕc denotes by considering the difference of certain parts of θcand θc.
If the nectar amount ofθc 8 1, F(θ (c+1)), is greater than the nectar amount in the position θc, in that case the bee moves to its beehive and shares this data with the further bees and remain θc 8 1 in the mind as a new position. If not, it goes on observance θc in mind. If the nectar source of the position θ is not understand by the number of ‘limit’ parameter, then the source in the position θ is redundant and the bee of that source becomes scout bee. The scout bee creates random researches and identifies a new source and the newly found source is assigned toθ. The algorithm iterates to the preferred cycle number, and the sources having the best nectar in mind denote the possible values of the variables. The obtained nectar amount denotes the solution of the object function.
3.2 Artificial bee genetic colony algorithm
a successful optimization approach for both continuous and discrete optimization problem. A disadvantage with GAs is a few relatively fit (but not optimal) individuals genes may quickly come to control the population, reason it to converge on a local maximum. If the population has converged, the capability of the GA as to carry on a search for better solutions is removed and crossover of identical chromosomes produces small values that are new. Only mutation residue to explore completely new ground and this simply processes slowly, random search. For fine exploration of the local search space at the time of search process and to avoid convergence on local maximum problem employed and onlooker bees of ABC are added. Both operators are main operator of ABC algorithm. Employed bee operators use the property of solution (dimension) and produce new solutions. It may be feasible that the generated solution is better than the existing one, than it will remove the current solution. Onlooker bee chooses the solution based on the probability associated to individual solution and produces new solution on the property of the selected solution. Fitness of both the solutions is once more compared to the best one replaces the worst solution. In this proposed approach, a linear crossover is employed as a crossover operator. Linear crossover is one of the earliest operator in real coded crossover it produces three solutions from two parents and the best two offsprings replace parents [18].
3.3 Sinkhole attack
Sinkhole attacks typically work by making a compromised node look especially attractive to surrounding nodes with respect to the routing algorithm.
Figure 1: Sinkhole Attack
For instance, an adversary could spoof or replay an advertisement for an extremely high quality route to a BS. Some protocols might actually try to verify the quality of route with end-to-end acknowledgements containing reliability or latency information. In this case, a laptop-class adversary with a powerful transmitter can actually provide a high quality route by transmitting with enough power to reach the BS in a single hop, or by using a wormhole attack.
Due to either the real or imagined high quality route through the compromised node, it is likely each neighboring node of the adversary will forward packets destined for a BS through the adversary, and also propagate the attractiveness of the route to its neighbors. Effectively, the adversary creates a large “sphere of influence”, attracting all traffics destined for a BS from nodes several hops away from the compromised node.
4. METHODOLOGY
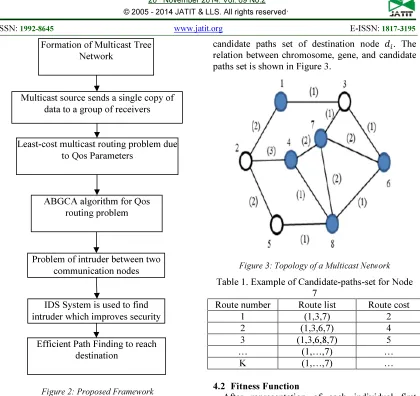
262 Figure 2: Proposed Framework
4.1 Initial Population
The formation of the initial population is done using Dijkstra kth shortest path algorithm.
For each destination node ∈ , calculate the least-cost paths from s to by means of Dijkstra kth shortest path algorithm to construct a candidate paths set. Let P be the candidate paths set for destination node :
P ,
", …
# (7) where
"
is the jth path for destination node . In this paper, initially select k=20. For instance, a topology of a multicast network is shown in Figure 2, and the cost of each link is defined. Node 1 is source node, and destination nodes set is (4, 6, 7, 8). Table 1 represents the candidate paths set for destination node 7.
A multicast tree , is encoded as an array of , ||elements, where each element is a path from source node to a destination node ∈ , i.e.,
, , , … , , where Q
Q , , ∈ , Q, is a path selected from the
candidate paths set of destination node . The relation between chromosome, gene, and candidate paths set is shown in Figure 3.
Figure 3: Topology of a Multicast Network
Table 1. Example of Candidate-paths-set for Node 7
Route number Route list Route cost
1 (1,3,7) 2
2 (1,3,6,7) 4
3 (1,3,6,8,7) 5
… (1,…,7) …
K (1,…,7) …
4.2 Fitness Function
After representation of each individual first calculate fitness value of each individual. On the basis of fitness value we determine the optimal solution. In case of network topology optimal solution is the minimization the value of equation (8). Equation (8) is the addition of the cost from one to another in a path to travel to reach the destination path. For calculating the fitness value first we have to calculate the cost matrix. Cost matrix contains the cost of travel from one path to another path in a multicast subtree. Our main objective is to minimize the fitness value, an individual who have the minimum fitness value is considered as the optimal solution.
R!
$ (8) The cost function is calculated f .
i. Calculation of fitness
The employed bee searches during traversal of the link for discovery a route. The number of the employed bee search phases is put down on each link (i, j) along the route R is observed by ∆R," and Formation of Multicast Tree
Network
Multicast source sends a single copy of data to a group of receivers
Least-cost multicast routing problem due to Qos Parameters
ABGCA algorithm for Qos routing problem
Problem of intruder between two communication nodes
IDS System is used to find intruder which improves security
it is a function of global quality of route R. It is denoted by the equation
∆R,"
&'ಓా('ಓు)'ಓ
'ಓీ*+'ಓౄి''ಓీ (9) Here λ&, λ(, λ), λ, λ*+ and λ' are the weight factors which point out the relative significance of the QoS parameters for the period of pheromone update on path (i, j). The amount of the updated pheromone is defined only after identifying the route. The quality link (i,j) of employed bee is updated.
ii. Path Preference Probability Calculation
Path Preference Probability is evaluated in each intermediate node in addition to source node upon receiving of request.
Suppose if current node i receives request from node j for destination d, the Path Preference Probability can be calculated as
,
- .τ0 . .D
0 . .η0. .B0. .E0. .DR0. .T0 ∑∈.τ0
. .D
0 . .η0. .B0. .E0. .DR0. .T0 10
Here α1, α2, α3,α4, α5, α6 and α7 are the adjustable parameters which control the relative weights of bee trails, hop count, bandwidth, residual energy, drain rate and throughput respectively.
[ is the set of neighbors of i and k is the neighbor node of i through which a path to destination is known.
The relative metrics are calculated from source i to destination d through j as
D:
:;<= > ,: (11)
η:
>? @?A > ,: (12)
B:bandwidth pathi, d (13)
E:energy path i, d (14)
DR:
drain rate path i,d (15)
T: throughput path i, d (16) At present, source with neighbors has multiple paths from source to destination. The path among higher Path Preference Probability is chosen for the data transmission.
4.3 Intrusion detection System for Attack Prevention in node for secure purpose
In network structure, even performing an efficient routing there is a difficulty of intruder between two communication nodes. Due to this, the data would take maximum time to reach the
destination node and also packet loss may take place while transmitting. To detect the intruder, a normal IDS system is proposed further for safe purpose. IDS for sensor networks which is designed to work with only partial and localized available information in each node. Especially, concentrated on how such IDS could identify blackhole and discriminating forwarding attacks. The nodes merely monitor their neighborhood and work together with each other sharing important information that finally leads to the successful detection of the attack.
In this paper, extend this IDS system so that it can detect sinkhole attacks, a predominantly severe attack that prevents the base station from obtaining whole and correct sensing data, therefore forming a serious threat to higher-layer applications. A complete intrusion detection solution for sensor networks is analyzed by finding the attacks using integrated IDS.
This research work also will focus on providing solution for above said problem by monitoring through intrusion detection system resulting in regaining of the normal state of the network. Also, it provides header information of all the nodes which are associated in the single mobile ad-hoc network and will monitor the actions of the nodes. If any node found to be produces uneven behavior or given that extra utilization of resources then normal then intrusion system will consider it as suspected node for any attack sequence observation. Usual monitoring will be obtained and regular updates by suspected node will be evaluated. Multicasting solutions will be selected to find the multiple nodes mischief.
The intrusion detection system follows a distributed structural design. It is collected of identical IDS clients running in each node in the network. Then the IDS clients commune with each other in order to reach a termination on an intrusion event. The functionality of each IDS client can be as follows:
Network Monitoring: Each IDS clients pay attention on the network and captures and observe individual packets passing from its instantaneous neighborhood in real time.
264 detect. The rule for the attack is distinct, which is discussed below.
Decision Making: Owed to its myopic vision in the region of its neighborhood, a node may not be competent to make a final decision whether a node is certainly an intruder. But, it cannot be trusted by the network, as it can be malicious itself. Hence, if an anomaly is detected by an IDS client then a cooperative mechanism is proposed with the neighboring nodes so that all of them come to a common conclusion.
Action: Every node has a response mechanism that allows it to respond to an intrusion circumstances.
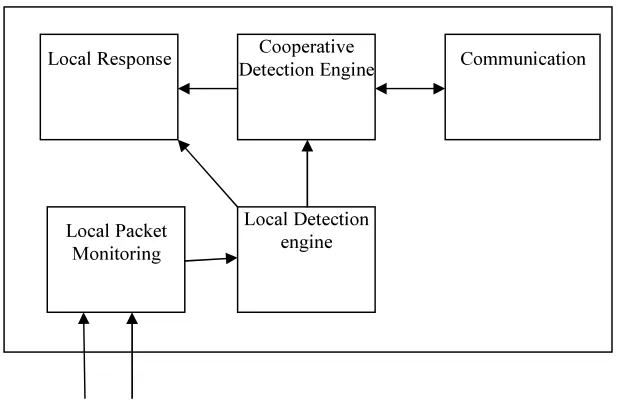
Based on these functions here build the architecture of the IDS client around five conceptual modules, as shown in Figure 3. Each module is liable for a specific function, which shown below. The IDS clients are identical in each node and they can exchange messages with clients in neighboring nodes.
[image:8.595.144.453.339.546.2]Let us assume that in the proposed sinkhole attack scenario, base station monitors all nodes in the network and collects the information about the suspected nodes. The collected information about the suspected nodes is broadcast to other nodes from base station.
Figure 4: The building blocks of the IDS client existing in each sensor node.
i. Local Packet Monitoring
This module gathers audit information to be given to the local detection module. Audit data in a sensor network IDS system can be the communication actions within its radio range. This particular data can be collected by seeing promiscuously to neighboring nodes' transmissions. As sensor nodes have this ability, this can be very valuable for intrusion detection.
The broadcasted information from the base station is received by other nodes and it is stored in the local packet monitoring module for further process. If any packet is received from neighbor nodes then first it will verify the list broadcasted by base station. Once the node confirms that received message or advertisement from the suspected nodes then it will drop the packets. Therefore, the neighbors of a node act as watchdogs for that node. One watchdog is not adequate to identify a sinkhole Local Response Cooperative
Detection Engine Communication
Local Packet Monitoring
Local Detection engine IDS Agent
attack, however, if all neighbors formulate their decision to the rest of them, then the task is complete, and the attacker is detected.
It is to be observed that the watchdogs need not have to store the packets/data in their memory. It is adequate to momentarily buffer each packet to apply the rules defined by the local detection engine and observe if any of these rules are fulfilled. Then the packet can be eliminated. No historical or statistical data need to be kept in the node's memory.
ii. Local Detection Engine
The local detection engine formulates all the conditions about the correct operation and monitors audit data with respect to these constraints, in order to recognize any deviations from normal behavior. These conditions are formulated in the form of rules, to avoid the overhead of training the network. In order to detect the attack, two rules will make an alert whenever the malicious node tries to impersonate another node, according to the attack. The main formulation is that route update packets should originate only from their legitimate sender and the nodes should defend against impersonation attacks.
Rule 1: For each overhead route update packet, the sender field is compared with the list of suspected nodes. If it is same as suspected node ID, then an alert signal has to be given to the neighbors."
Rule 2: each node will monitor the neighboring nodes by sending the hello packets to the neighbors. As mentioned in packet monitoring watch dog mechanism is used. If any neighboring node in the network drops the packet or didn’t forward the packet then that node is also added in the suspected list and forward to the base station.
For a node that identifies an anomaly based on the above rules, it is a sign that a sinkhole attack is in process. However, it is not possible to identify which node is trying to initiate the attack, as the sender field has been modified. It can be sure that the attacker is one of the neighboring nodes, as the route update packets are only broadcasted locally. So, it is required to rely on the cooperation of the nodes to minimize the candidates to one node, i.e. the attacker.
iii. Cooperative Detection Engine
The main aspect here is to know which intruder node will be revoked from the network. But, this
decision alone is not adequate because of the following reasons:
1. The node which makes the final decision can be compromised itself. Then, it could choose not to revoke an attacking node or revoke a legitimate one. So, the decision should be collaborative, and should come from all the nodes that are involved, i.e. the watchdogs.
2. In the case of sinkhole attack, there is no adequate data to conclude on the attacker.
Therefore, a cooperative detection engine is essential that will suggest the nodes about the other intruder nodes so that it can be revoked by the network. Based on this, when a malicious node launches an attack and one of the two rules in the local detection engine will be triggered at several of its neighbors. If these neighbors collaborate, it turns out that they can identify the attacker.
The joint approach consists of watchdog on each node broadcasting its neighbors list. Each and every watchdog can simply conclude than that the attacker is one of its neighbors. However, if all the nodes that generate the alert message to their neighbors to each other, the attacker has to be single of the nodes in the intersection of these sets. So, to set it correctly, if there is authentication of intrusion produced at the local detection engine, the cooperative detection module broadcasts an attentive alert to the neighboring nodes. The alert is self-possessed by the list of the IDs of the sender's neighbors. Ahead receiving such an alert and make available that it is a watchdog itself; a node prohibit from the potential attackers the entire node IDs in the alert that is not part of its own neighbor list. Therefore it performs an intersection between its own neighbor list and the node list establish in the alert. The result will be accumulated and utilized for the intersection with the next alert that the node is available to receive. Therefore each time a watchdog is receiving an alert; the connection will provide a smaller set of nodes. If at last there is only one node left as a result, that node is the attacker.
266 iv. Local Response
Once the watchdogs are attentive that the occurrence of intrusion and have noticed the compromised node, suitable actions are performed by the local response component. The initial process is to cut off the intruder to the extent that feasible and separate the compromised node. Afterward, right operation of the network must be reinstating. This may comprise of changes in the routing paths, updates of restoring part of the system by means of redundant information dispersed in other parts of the network. Autonomic performance of sensor networks revenue that these functions must be carried out without human knowledge and within finite time.
Based on the assurance and the type of the attack, the response can be classified into two ways:
Direct response: Not including the suspect node from any paths and performing regeneration of new cryptographic keys with the other set of the neighbors.
Indirect response: Informing the base station regarding the intruder or minimizing the quality estimation for the link to that node, so that it will slowly lose its path reliability. By this an attacker is identified, also the network happen to more secure. Later the competent path is determined by means of the proposed swarm algorithm.
4.4 Artificial Bee Genetic Colony for Qos multicast Routing Problem
To solve the Qos multicast Routing Problem, the Artificial Genetic Bee Colony Algorithm is used. Initialize the population by choosing random values from the search space than the sequence vector is connected with each individual is measured. Whereas, sequence vector is a member of the set of x! Sequences; where x is the total number of paths. Subsequent to receiving the initial population and related initial sequence vector calculate the fitness value of each individual, according to fitness equation.
In the next step these individuals are processed by employed bees of Bee colony algorithm. These operators are generally used for local search to evade local max problem. In this phase, a new candidate solution is produced and then it generate the candidate sequence corresponding to candidate solution and calculate the fitness of individual and if the fitness of new candidate solution is superior than the existing solution then it replace the previous solution and its sequence vector. Calculate the probability for each individual then. Later if the
crossover criterion is fulfilled, then crossover operation executed over two randomly selected individuals and accordingly a new individual and sequence is generated, whereas, replacing the worst individuals and sequences based on fitness value. Next the onlooker bee phase is carried out, were it is also the operator of bee colony to generate the new vector and produce a new sequence vector. Then the cost of this offspring is computed. By the sequence and its cost from the cost matrix the fitness value of the each individual is calculated.
Algorithm 1: Qos multicast Routing Problem using ABGCA
[Initialization Phase]
for p=0 to population size (path) do for d=0 to dimension size of the path do
initialize particle randomly
Using SPV rule a sequence vector is generated
end for d
Compute fitness of that particle
end for s
Repeat
[Employed Bee Phase]
for i=0 to maximum no of employed bee do for d= 0 to dimension size do
produce a new candidate solution
produce candidate sequence on the basis of candidate solution
end for d
Compute fitness of individual
if fitness of new solution is better than the previous solution restore the older solution and its sequence vector.
end for i
Calculate the probability for each individual.
[Update Phase]
[Crossover Operator Phase]
if crossover criteria is met then
Select two random individuals from the current population for crossover operation
Precede crossover operation to generate new individuals new offspring generated from parents as the output of crossover.
New set of sequence vector is generated for new offspring
Compute the cost for that offspring Compute the fitness of updated individual
Replace the worst parent and associated sequence individual with new best offspring and its sequence vector if it is better Update individuals
[Onlooker Bee Phase]
for i=0 to maximum no of onlooker bee do
for d= 0 to dimension do
produce new candidate solution
produce candidate sequence on the basis of candidate solution
end for d
compute fitness of individual
if fitness of new candidate solution is better than the existing solution replace the older solution and its sequence vector.
end for i
[Scout Bee Phase]
If any food source fatigued
Then replace it by random position generated by scout memorize the best solution and sequence found so far
until(stopping criteria is not met)
5. RESULTS AND DISCUSSIONS
The experimental simulations are carried out in Network Simulator (NS2). The network topology is created by in this experiment based on [18].
True Positive (TP): This occurs when an IDS raises true alerts on a detected malicious traffic. Hence TP is the total detected malicious activity.
True Negative (TN): This occurs when there’s no malicious activity taking place in the network, and the Intrusion Detection system is thus not raising any alarm. Hence TN can be obtained by subtracting TP from the total monitored traffic.
False Positive (FP): This occurs when an IDS erroneously raises a false alarm over a legitimate activity in the network. These can be generated from adapting the IDS to a normal non-malicious traffic.
False Negative (FN): This occurs when the IDS fails to detect a malicious activity taking place in the network.
False Positive Rate (FPR): This shows the proportion of instances which were not an intrusion, but were still alerted on. FPR is obtained using the following formula
f f 8 [f
True Positive Rate (TPR): This rate shows how good the IDS is at detecting intrusions in a network. It is also called the Detection Rate. TPR is obtained as:
8 f[
A well-working IDS is expected to have a FPR of less than 1% and a very high TPR.
Pulse rate
TN TP FN FP TPR FPR
0.1 656 42 2 1 95.12% 0.15%
0.2 625 20 2 2 90.48% 0.32%
0.3 610 22 2 3 91.30% 0.48%
0.4 630 43 2 3 95.56% 0.48%
0.5 608 46 2 2 95.83% 0.33%
AVG - - - - 93.66% 0.35%
Table 2: Simulation Parameters
Simulation
Parameter
Value
Number of
nodes 50
Area size 1500 x 1500 m
Mac 802.11
Traffic Source CBR
Transmit
Power 10
Receiving
Power 30
Initial Energy 100 J
Packet Size 1024 bytes
Antenna Omni Antenna
Radio
propagation
Two ray Ground
Interface
268 Queue Length 50
Channel Type Channel/Wireless channel
Routing
Protocol AODV
[image:12.595.85.518.81.673.2]The average degree of each node in the random generated graphs is shown in figure 4. The degree is close to the average node degree of current networks. The multicast group is randomly selected in the graph. The numbers of network nodes are 20, 40, 60, 80 and 100nodesrespectively, and the size of multicast group is 5 is shown in the figure 4 – figure 9.
Figure 5: Comparison of Least Tree Cost in 20 Nodes Network
Figure 6: Comparison of Least Tree Cost in 40 Nodes Network
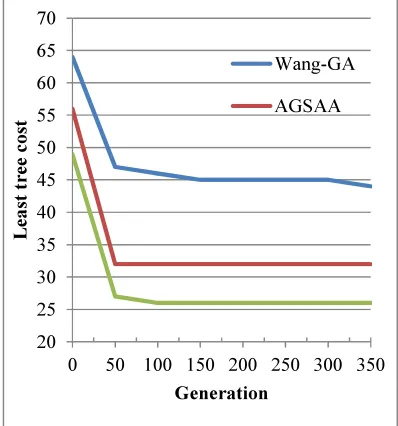
Figure 7: Comparison of Least Tree Cost in 60 Nodes Network6
20 25 30 35 40 45 50 55 60 65 70
0 50 100 150 200 250 300 350
Le
a
s
t
t
r
e
e
c
o
s
t
Generation
Wang-GA
AGSAA
40 45 50 55 60 65 70 75 80
0 50 100 150 200 250 300 350
Le
a
s
t
t
r
e
e
c
o
s
t
Generation
Wang-GA
AGSAA
60 65 70 75 80 85 90
0 50 100 150 200 250 300 350
Le
as
t
t
r
e
e
c
o
s
t
Generation
Wang-GA
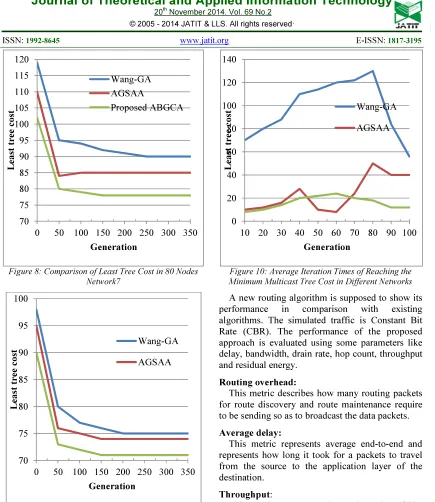
[image:12.595.89.288.318.531.2]Figure 8: Comparison of Least Tree Cost in 80 Nodes Network7
Figure 9: Comparison of Least Tree Cost in 100 Nodes Network
Figure 10: Average Iteration Times of Reaching the Minimum Multicast Tree Cost in Different Networks
A new routing algorithm is supposed to show its performance in comparison with existing algorithms. The simulated traffic is Constant Bit Rate (CBR). The performance of the proposed approach is evaluated using some parameters like delay, bandwidth, drain rate, hop count, throughput and residual energy.
Routing overhead:
This metric describes how many routing packets for route discovery and route maintenance require to be sending so as to broadcast the data packets.
Average delay:
This metric represents average end-to-end and represents how long it took for a packets to travel from the source to the application layer of the destination.
Throughput:
This metrics represents the total number of bits forwarded to higher layers per second. It is measured in bps. It can also be defined as the total amount of data a receiver actually receiver to obtain the last packet.
Packet Delivery Ratio:
The ratio between the amount of incoming data packets and actually received data packets
70 75 80 85 90 95 100 105 110 115 120
0 50 100 150 200 250 300 350
L
e
a
s
t
t
r
e
e
c
o
s
t
Generation
Wang-GA AGSAA
Proposed ABGCA
70 75 80 85 90 95 100
0 50 100 150 200 250 300 350
Le
as
t
t
r
e
e
c
o
s
t
Generation
Wang-GA
AGSAA
0 20 40 60 80 100 120 140
10 20 30 40 50 60 70 80 90 100
L
e
a
s
t
t
r
e
e
c
o
s
t
Generation
Wang-GA
[image:13.595.91.291.345.585.2]270
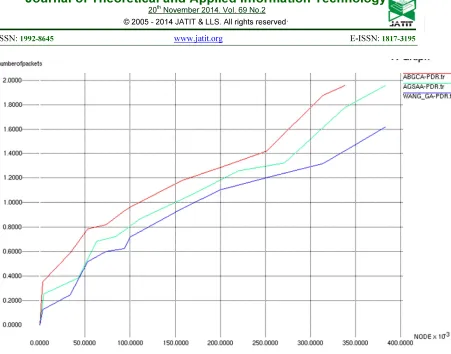
Figure 11: Packet Delivery Vs Number of Nodes
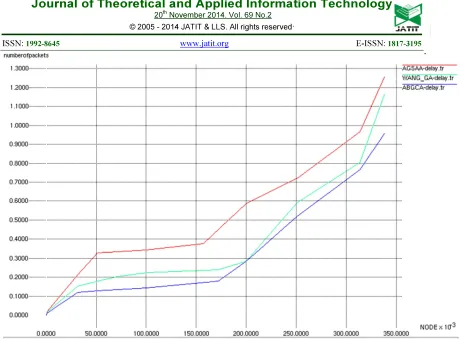
Figure 12: Average Delay Vs Number of Nodes
272
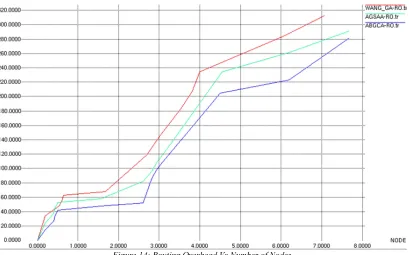
Figure 13: Throughput Vs Number of Nodes
The figure 12 is drawn for the Throughput Vs Number of nodes. From the figure the proposed ABGCA system which as higher value of Throughput when compared with another existing
techniques like AGSSA and WANG_GA technique. The results illustrates that the proposed ABGCA approach performs better when compared to other algorithm.
[image:16.595.96.505.482.737.2]The figure 13 is drawn for the Routing Overhead Vs Number of nodes. From the figure the proposed ABGCA system which as higher value of Routing Overhead when compared with another existing techniques like AGSSA and WANG_GA technique. The results illustrates that the proposed ABGCA approach performs better when compared to other algorithm.
6. CONCLUSION AND FUTURE WORKS
Multicast is an essential technology for many real-time multimedia applications involving group communication. QoS multicast routing become one of important technique in network real-time information transmission. Least-cost QoS multicast routing algorithm will be essential for the high-speed information networks. In this paper, a hybrid model called Artificial Bee Genetic Colony Algorithm (ABGCA) based on QoS aware multipath routing algorithm is proposed which supports real time applications. The proposed algorithm is used to find the optimal path for efficient routing. Also that, an IDS system is introduced between two communication nodes to detect attacks and also it improves the network security. The simulation results indicate that proposed scheme can perform better than the existing Genetic algorithm and adaptive genetic simulated annealing algorithm (AGSAA) under high mobility because of alternate route maintenance scheme.
REFRENCES
[1] Deris tiawan, Abdul Hanan Abdullah, Mohd. Yazid dris, “Characterizing Network Intrusion Prevention System”, International Journal of Computer Applications (0975 – 8887), Volume 14– No.1, (January 2011).
[2] J. Han and M. Kamber, Data Mining: Concepts and Techniques. San Fransisco: Morgan Kaufmann, 2001.
[3] C. Grosan, A. Abraham, and M. Chris, "Swarm Intelligence in Data Mining," Studies in Computational Intelligence, vol. 34, pp. 1-20, Springer-Verlag: Berlin Heidelberg, 2006. [4] Sneha Dhage, Purnima Soni, “Intrusion
Detection & Fault Tolerance in Heterogeneous Wireless Sensor Network: A Survey”, International Journal of Scientific and Research Publications, Volume 4, Issue 2, February 2014.
[5] Mohamed Mubarak T, Syed Abdul Sattar, G.Appa Rao, Sajitha M,” Intrusion detection: An Energy efficient approach in Heterogeneous WSN,” in proc.2011 IEEE International Conference on Emerging Trends in Electrical and Computer Technology. [6] X. Du and F. Lin, “Improving routing in
sensor networks with heterogeneous sensor nodes,” in Proc. 2005 IEEE Veh. Technol. Conf., pp 2528-2532.
[7] S. Bandyopadhyay and E. J. Coyle, “An energy efficient hierarchical clustering algorithm for wireless sensor networks,” in Proc. 2003 Conf. IEEE Computer Commun., pp. 1713–1723.
[8] I. R. Chen, A. P. Speer, and M. Eltoweissy, “Adaptive fault-tolerant QoS control algorithms for maximizing system lifetime of query-based wireless sensor networks,” IEEE Trans. Dependable Secure Computing, vol. 8, no. 2, pp. 161–176, 2011.
[9] W. Lou and Y. Kwon, “H-SPREAD: a hybrid multipath scheme for secure and reliable data collection in wireless sensor networks,” IEEE Trans. Veh. Technol., vol. 55, no. 4, pp. 1320– 1330, 2006.
[10]Kompella VP, Pasquale JC, Polyzos GC, “Multicast routing for multimedia communication”, IEEE/ACM Transactions on Networking, vol. 1, No. 3, (1993), pp. 286– 292
[11]Parsa M, Zhu Q, Garcia-Luna-Aceves JJ, “An iterative algorithm for delay constrained minimum-cost multicasting”, IEEE/ACM Transactions on Networking, vol. 6, no. 4, (1998), pp. 461–474.
[12]Wang ZY, Shi BX, Zhao ED, “Bandwidth Delay Constrained Least Cost Multicast Routing Based on Heuristic Genetic Algorithm”, Computer Communications, vol. 24, (2001), pp. 685–692.
[13]Fei X, Luo JZ, Wu JY, Gu JQ, “QoS Routing Based on Genetic Algorithm”, Computer Communications, vol. 22, (1999), pp. 1392– 1399.
[14]Wang XH, Wang GX, “A multicast routing approach with delay-constrained minimum-cost based on genetic algorithm”, Journal of China Institute of Communications, vol.23, no.3, (2002), pp. 112–117.
274 Future Generation Communication and Networking Vol. 5, No. 1, March, 2012. [16]Rehab FAK, “Hybrid discrete PSO with GA
operators for efficient QoS multicast routing”, Ain Shams Engineering Journal, vol. 2, (2011), pp. 21–31.
[17]D. Karaboga and B. Akay. “Artificial bee colony algorithm on training artificial neural networks”, In Signal Processing and Communications Applications, 2007. SIU 2007. IEEE 15th, pages 1–4. IEEE, 2007. [18]Hemant Nagpure, Rohit Raja, “RBGCA- Bee