http://dx.doi.org/10.4236/nm.2014.55024
How to cite this paper: Pascoal-Faria, P., Patrício, M., Leal, A., Caramelo, F., Freire, A., Januário, C. and Castelo-Branco, M. (2014) Understanding Tremor in Rapid Upper Limb Movements Using 3D Accelerometers Data. Neuroscience & Medicine, 5, 205-213. http://dx.doi.org/10.4236/nm.2014.55024
Understanding Tremor in Rapid Upper Limb
Movements Using 3D Accelerometers Data
Paula Pascoal-Faria1,2*, Miguel Patrício3*, Adriana Leal2, Francisco Caramelo3,António Freire2,4, Cristina Januário4, Miguel Castelo-Branco2
1Center for Rapid and Sustainable Product Development (CDRSP), School of Technology and Management
(ESTG) of the Polytechnic Institute of Leiria (IPLeiria), Leiria, Portugal
2IBILI, Faculty of Medicine, University of Coimbra, Coimbra, Portugal
3Laboratory of Biostatistics and Medical Informatics, IBILI, Faculty of Medicine, University of Coimbra, Coimbra,
Portugal
4Neurology Department, Coimbra University Hospital Centre (CHUC), Coimbra, Portugal
Email: [email protected]
Received 12 September 2014; revised 11 October 2014; accepted 6 November 2014
Copyright © 2014 by authors and Scientific Research Publishing Inc.
This work is licensed under the Creative Commons Attribution International License (CC BY). http://creativecommons.org/licenses/by/4.0/
Abstract
Tremor is a manifestation of a variety of human neurodegenerative diseases, notably Parkinson’s disease (PD) and Essential Tremor (ET), both affecting millions worldwide. PD is primarily caused by a progressive loss of dopamine neurons in the nigrostriatal system that leads to widespread motor symptoms such as bradykinesia, rigidity, tremor and postural instability. ET typically in-volves a tremor of the arms, hands or fingers. No definitive test or biomarker is yet available for PD or ET, so the rate of misdiagnosis is relatively high. As tremor is a very common feature at the onset of both diseases, it is crucial to be able to characterize it. This is made possible using acce-lerometers to quantify the tremor amplitude and frequency. In this work we aim to find tasks in-volving upper limb movements that are suitable to modulate both types of tremor. Four tasks were tested, differing on whether the arms moved together or alternatingly and whether loads were added. Significant differences in tremor measures were found when patients were asked to perform simultaneous rapid arms movements with loads placed on their wrists. These results may allow the design of an efficient fMRI protocol for identifying the cortical circuits responsible for the modulation of tremor.
Keywords
Disease, Essential Tremor, Tremor Quantification, Tremor Modulation, Accelerometers
mor [1]. PD tremor is caused by the degeneration of the dopaminergic neural system, i.e., the progressive loss of dopamine-producing neurons in the substantia nigra [2]-[4]. Additionally, tremor can be classified according to the type of occurrence in two major groups: resting or action tremor [2][5]-[7]. Each of these can be characte-rized by different amplitudes and frequencies and may occur in various body parts, where the position of the limbs also plays an important role [2][6][7]. PD tremor is identified mainly as a rest tremor with frequencies varying between 4 and 7 Hz, often displaying a pill-rolling feature [2][8][9]. In turn, ET is characterized by an action tremor also within the same range frequencies ranging from 4 to 12 Hz [2][6]. However, ET can also be seen in some PD patients, adding a confound to their diagnosis [2][5][6][9]. Thus, these different types of tre-mors are often difficult to isolate and distinguish, leading to the need of finding a useful method or algorithm for the differential diagnosis of the underlying diseases [2]-[4][10] [11]. Quantitative mathematical analysis and modeling of tremor using electrophysiology techniques can play an important role in this [1][12].
In this paper we focus solely on PD and ET tremors. Motor symptoms of the former include rigidity, bra-dykinesia and postural unbalance, besides tremor [6][9][13]-[15]. Both PD and ET induce hand tremor most prominently [1][2][6]. The genesis of both types of tremor has not been identified yet and has been rather dif-ficult to decipher up to now [4][11]. Neuroimaging and also electrophysiology can play an important role in finding the cortical circuits associated with tremor. This article assesses the impact of different tasks in tremor modulation. Four tasks that comprise different movement combinations and loading conditions were performed by three groups: two cohorts of patients (PD and ET) and a healthy control group. The tremor was quantified for each patient and for each task using 3D accelerometers placed at the dorsum of the hand, in the limb where tre-mor was dominant for each participant [16]. An offline Fourier analysis of the acceleration in terms of time was used to determine the amplitude as a function of the frequency and ultimately the area under the curve was computed. The resulting data were assessed resorting to statistical tests. A task where subjects were asked to move their arms up and down and then return them to a relax position, repeating this procedure several times with a load placed at both wrists, was identified as being adequate to modulate tremor. This information can be useful to set up an efficient fMRI protocol to study tremor.
2. Methods
2.1. Subjects
Six patients (mean age ± SD: 68.0 ± 8.4 years, 3 males and 3 females) were included in this study, all of which attended the Movement Disorder Consultations at the Coimbra University Hospitals. Three of them were dia-gnosed with PD and the other three with ET. The diagnosis was performed by experienced neurologists who were trained in the differential diagnosis of tremor disorders (Hoehn & Yahr: I-III). All patients revealed an asymmetric tremor, the right side being the dominant upper limb. The medication was maintained by patients before tremor recordings. Six healthy voluntary controls without neurological abnormalities also participated in this study (mean age ± SD: 50.8 ± 19.3 years, 5 males and 1 female). All the participants were right-handed by self-report. This study and all procedures were reviewed and approved by the Ethics Commissions of the Faculty of Medicine of the University of Coimbra and were conducted in accordance with the declaration of Helsinki. Written informed consent was obtained from all participants.
2.2. Procedures
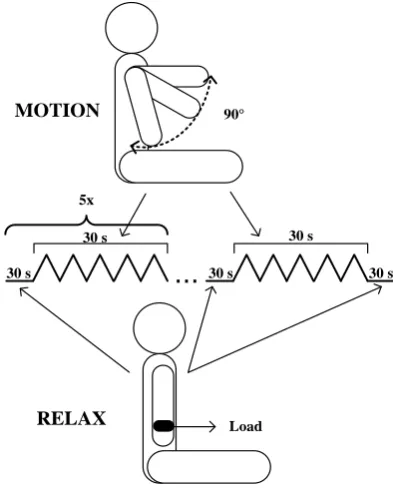
Figure 1. Schematic diagrams of tasks 1 and 2 (un- loaded) and tasks 3 and 4 (loaded). A detailed descrip-tion of each task can be read in the text.
participant—6 segments corresponding to the relax position and 5 to the arms motion. The tasks differed in the loading conditions and how the arms motion was performed. The first two tasks (task 1 and 2) were performed without any additional load, unlike the other two tasks (tasks 3 and 4), for which a load of 0.5 Kg was placed in each of the participants’ wrists. On the other hand, while in tasks 1 and 3 the arms of each participant moved in parallel, in tasks 2 and 4 the arms moved in opposite directions. Each task was carefully detailed to the partici-pants, who were additionally guided through the experiment by an animation programmed using Physicophysics Toolbox Version 3, a free set of Matlab R2010a. Two balls, each representing one arm, were initially placed on the bottom of a 33.8 cm × 27.1 cm computer screen (1280 × 1024 pixels), which was located 50 cm in front of the chair where the participants were seated. Different ball colors (blue and red) and screen positions (left and right, respectively) were chosen to represent the two arms (left and right, respectively). The balls were initially positioned in a black line at the bottom of the computer screen and later moved up and down in the screen joint-ly or alternatingjoint-ly, mimicking the motions asked of the volunteers to perform in each task. Each participant simply had to follow the movement of the balls with both arms. Tremor modulation during the tasks was mea-sured with a 3D-axis accelerometer positioned at the dorsal part of the hand of the dominant arm of each partic-ipant. An in-house built sensor module was used, incorporating a Kionix KXTF9 3D-axis accelerometer with sensitivity of 8 bits/64 counts/g, and a configured maximum rating of ±2 g. The bandwidth was configured to be 0 - 12.5 Hz. The modules were attached in the dorsal part of the hand, near the fingers junctions. Acceleration data were sampled at 25 Hz and stored on a Micro SD for offline analysis.
2.3. Data Analysis
The three axis acceleration components were obtained as function of time and normalized for each segment for each task and each participant. A Fourier analysis was performed in Matlab R2012a to obtain the frequency and amplitude of each segment. Additionally, the amplitude as a function of frequency was integrated for each task segment using trapezoidal integration using the values within 3 - 12.5 Hz range and normalized to the cor-responding duration [17]. A total of 11 scalar values were then obtained for each participant and each task. These values were hereby denoted by bi and mj (i ranging from 1 to 6 and j from 1 to 5), corresponding to the
baseline (relax) and motion segments, respectively. For each participant, the averages b and m of the baseline segment values bi and the motion segment values mj were also determined. Finally, for each of the three groups
30 s 30 s
30 s 30 s
30 s 5x
...
Load 90°
PD patients of their corresponding averaged baseline values.
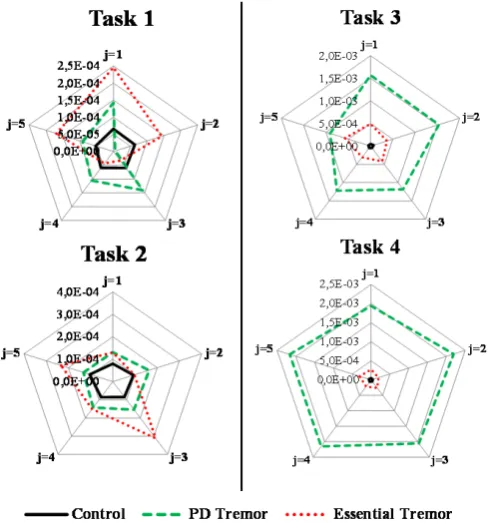
To allow visualising the differences between the time evolution profile of the area under the curve for each segment, descripted above, for the three groups, radar charts were plotted for each task, with a clockwise repre-sentation of the values of |mj(G) − b(G)|, where G = PD, ET or C. Based on these plots, only those tasks for which
a visual discrimination between the groups is possible were carried on for further analysis. Notably, for those tasks where the ranks of the values of |mj(G) − b(G)| were maintained for the different values of j, the data were
further reduced by also averaging the values corresponding to the motion segments. Kruskal-Wallis tests were then performed to statistically assess whether the absolute values of m − b vary significantly between groups. When statistical significance was found, Mann-Whitney U test were performed to compare pairs of groups.
We also sought to ascertain whether the repetition of the instructions within each task had any effect on the tremor measures. In other words, for each group and each task, the values taken by |mj − b| when j varies were
compared by performing a Friedman test.
Finally, we note that the determination of the time instants corresponding to the start and end of each segment was performed automatically. Although the participant’s movements were guided by a visual animation, which was thought to insure high compliance, delays between a shift of action in the animation and its execution by the human subject were to be expected. To assess whether this aspect had a significant impact on the summary measures of interest, the process of determination of the absolute values of mj − b was repeated starting from a
manual determination of the time limits of each segment. The latter was performed by handpicking these limits by graphical observation. The intraclass correlation coefficient (ICC) [18] was then computed to assess the cor-relation between values determined automatically and manually.
All statistical analyses were performed using IBM SPSS Statistics 19.0 software package assuming a 0.05 level of significance.
3. Results
As described earlier, the frequency and the amplitude were obtained from the normalized raw data collected by the accelerometers, see Figure 2 for an example of the data collected from a PD, an ET and a control subject, when performing task 1.
We note that for nearly every PD patient a peak of frequency could be observed in the range of 4 Hz to 7 Hz in the movement segments, mj. As expected, no relevant frequency was observed in the segments corresponding
to the baselines, in which the frequency amplitudes take values considerably lower than those related to the mo-tion segments. As for the healthy volunteers and ET patients the results, both for momo-tion and baseline segments, are very similar to the baseline segments of PD patients. However, main differences can be noted in motion segments, with increasing peak amplitude from controls to ET patients and from those to PD patients. The va-lues of |mj(G) − b(G)| are represented clock-wise in Figure 3 for the unloaded tasks (1 and 2, left panel) and for
tasks involving added loading (3 and 4 in the right panel). In the latter, the values corresponding to each group maintained the same ranking for all values of j, which is not true for the unloaded tasks. A clear distinction in the profiles of the groups is therefore only visible for the tasks involving loading, on which the focus of the re-maining analysis is placed.
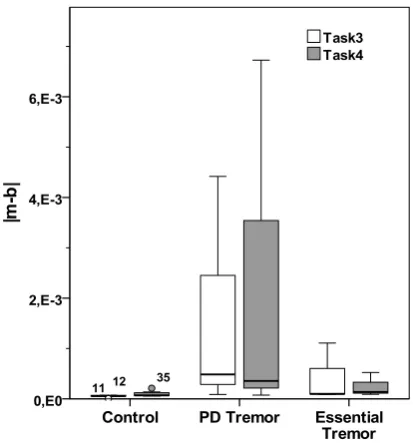
To assess whether significant statistical differences were detectable between the three groups (PD, ET and control) in tasks 3 and 4, the data were first reduced by averaging the motion segment values mj for each
parti-cipant. A boxplot of the values of |m − b| obtained for the participants is displayed in Figure 4.
Figure 2. Plots of the amplitude (power spectral density estimate) as a function of the frequency, obtained for each segment for a typical (a) PD patient; (b) ET patient; and (c) Healthy subject. The plots for each type of segment are presented: those corresponding to the baseline segments bj, 1 ≤ j≤ 6 and the plots corresponding to the motion segments mj, 1 ≤ j≤ 5. The
ho-rizontal axis of each plot represents the frequency (in Hz, ranging between 3 and 12.5) and the vertical axis amplitude (in V2∙Hz−1, ranging between 0 and 0.1).
Figure 3. Clockwise representation of the time evolution of changes in tremor, for each group, for the unloaded tasks (task 1
[image:5.595.177.422.424.686.2]Figure 4. Boxplot representing the absolute values of
[image:6.595.81.539.90.526.2]|m − b| for each group, for the loaded tasks (task 3 and 4).
Table 1.Kruskal-Wallis test results.
Task
3 4
2 KW
χ 6.656 3.548
p 0.036 0.170
Table 2.Mann-Whitney U test results for task 3.
Groups Control PD
PD 0.030 -
ET 0.053 0.827
Table 3.Friedman tests results.
Groups Control PD ET
Task 3 0.120 0.615 0.113
Task 4 0.060 0.031 0.231
Post-hoc tests (Dunn test) were taken to check for which pairs of segments the difference was found to be significant. A difference was only found between the first and second segment, although the p-value is near the threshold (p = 0.045). The analysis above critically depends on the accurate determination of the limits of the segments corresponding to the different actions performed by the participants. The results that have been pre-sented are based on an automatic determination of these limits.
To verify the validity of this approach, the values of |mj− b| were computed once again, but this time starting
from a manual determination of the limits of the segments. The latter was based on the graphical observation of the plots of the raw data. The intraclass correlation coefficient between values arising from manual and auto-matic procedures is ICC = 0.996, p < 0.001, which shows a nearly perfect agreement between both procedures.
4. Discussion
[image:6.595.91.537.343.565.2]rating scales or objective clinical assessment of drawn figures [1]. These measures do not allow rigorous statis-tical analysis and can differ from examiner to examiner [2] [19]. Additionally, there are no biological or elec-trophysiological markers that can be used for the differentiation between types of tremors [20].
To try to overcome this problem different or combined electrophysiological techniques such as accelero-meters, EMG, gyroscope, other sensors, laser or video-analysis have been proposed. Quantitative measures pro-vided by these techniques not only help on the follow-up of patients and their therapeutic but also provide in-sights on the underlying diseases [6][19][21].
The goal of this work was to assess four different tasks where patients were asked to perform rapid alternating or simultaneous arms movement and positions, with or without a load of 0.5 Kg. We sought to find out which tasks could modulate tremor of Parkinson’s disease and essential tremor patients, as well as healthy controls and also to find out if the tremor modulation would be statistically different between the three cohorts that partici-pate in this study. Identifying such a task is paramount to designing an efficient fMRI protocol for the identifica-tion of the cortical circuits associated to tremor in PD and ET, which until now have been very difficult to deci-pher [4].
This article follows a previous work from our group, where patients had been asked to repeat a slower move-ment where they would raise their arms for 30 sec and then return them to a baseline position for an equal period of time, cf. [22]. This was performed with and without added load. Significant statistical differences between the tremor profiles of the groups were found only for the unloaded task. However, radar charts for both unloaded and loaded tasks showed that the profiles corresponding to the dominant arms of the patients were visually very distinct (see Figure 4 in [22]), much like what is now shown in the present article for the loaded tasks (see Fig-ure 3). A point in common between both articles is that the statistical differences are found between the control group and other groups (in the present article, only between controls and PDs, while a p value slightly greater than 0.05 was found when comparing controls and ETs). It was not possible to statistically distinguish tremor from PDs and ETs. The boxplot in Figure 4 illustrates why: the values of |m − b| are rather small for controls and can be much higher for PDs, but there is an overlap between the range of values attained by PDs and by ETs. This suggests that an fMRI protocol designed with task 3 (or task 4) such at it is presented here may only be useful to compare PDs or ETs to controls, and not the two patient groups between themselves. Additionally,
Figure 2 shows that the use in an fMRI protocol of different types of movements can play an important role in tremor differentiation because different tremor amplitudes can be seen when the arms are in a rest or in a movement/postural condition. This protocol will be able to ascertain if there is a difference between brain acti-vation comparing e.g., blocks in which arms are at rest with blocks corresponding to ascending and descending movements or blocks in which participants maintain arms in a postural position.
Note however that in our studies there were no exclusion criteria concerning medication usage or stages of a disease. It is known that medication can have an impact in tremor measures of 25% - 30% [23]-[25]. A rigorous selection of participants taking into account the stadium of the disease should decrease the range of values of |m − b| for each group. Naturally, increasing the number of participants will also contribute to that. Whether that will be enough to diminish the overlapping region in Figure 3 (left panel) sufficiently so that significant differ-ences between the groups are attained may not be answered without performing more studies.
The profiles displayed in Figure 3 suggest that adding load to the tasks contributes to clearing out a distinc-tion between the profiles of tremor moduladistinc-tion for PDs, ETs and controls. This has been reported in the litera-ture [26], though the impact of adding a load to the wrist cuff or arm to modulate tremor is still object of debate, mostly due to the role that might be played by the antagonist muscles that are not affected by the load but are able to interfere with tremor quantification when for example, the EMG is used to characterized tremor [9][27] [28].
Taking the time evolution of tremor measures as an indicator of the level of tiredness of the participants when performing the tasks, our results show that all participants tolerate the effort on both task 3 and 4, to which the analysis was restricted. Statistical differences between measures obtained at different task segments were only obtained for the first two segments of the PD group for one of the tasks. However, the p-value was quite close to the threshold value and no other statistically significant differences were found. These results are in agreement with the work performed by Milanović [29] where PD patients obtained the same results as the control group in a contraction/force task.
Patients were asked to perform tasks involving rapid motions of the arms. It was shown that placing an added load on the wrists of subjects interfered with the tremor modulation in a way that allowed better discrimination between healthy controls and patients diagnosed with PD or ET. This information may allow setting up an effi-cient fMRI protocol to study tremor for identifying the cortical circuits responsible for the modulation of tremor.
Acknowledgements
We would like to acknowledge all the participants and their families for their participation in this study. We also wish to express our gratitude to the support of BIN (the Brain Imaging Network of Portugal) for providing tech-nical infrastructure and data archival facilities. We are also grateful to David Ribeiro, Gregor Philipiak and João Paulo Cunha from IEETA, University of Aveiro, Portugal for the home made accelerometers built and for the technical support on data acquisition. This was supported by National Funds through FCT-Foundation for Science and Technology within the project PEst-OE/EME/UI4044/2013.
Conflict of Interest
The authors declare that they have no conflict of interest.
References
[1] Hess, C.W. and Pullman, S.L. (2012) Tremor: Clinical Phenomenology and Assessment Techniques. Tremor and
Oth-er HypOth-erkinetic Movements (New York, N.Y.), 2, 1-15.
http://www.ncbi.nlm.nih.gov/pmc/articles/PMC3517187/?report=classic
[2] Buijink, A.W.G., Contarino, M.F., Koelman, J.H.T.M., Speelman, J.D. and van Rootselaar, A.F. (2012) How to Tackle Tremor—Systematic Review of the Literature and Diagnostic Work-Up. Frontiers in Neurology, 3, 146.
http://dx.doi.org/10.3389/fneur.2012.00146
[3] Lees, A.J., Hardy, J. and Revesz, T. (2009) Parkinson’s Disease. Lancet, 373, 2055-2066. http://dx.doi.org/10.1016/S0140-6736(09)60492-X
[4] Stoessl, A.J., Martin, W.W., McKeown, M.J. and Sossi, V. (2011) Advances in Imaging in Parkinson’s Disease. Lancet
Neurology, 10, 987-1001. http://dx.doi.org/10.1016/S1474-4422(11)70214-9
[5] Mamorita, N., Iizuka, T., Takeuchi, A., Shirataka, M. and Ikeda, N. (2009) Development of a System for Measurement and Analysis of Tremor Using a Three-Axis Accelerometer. Methods of Information in Medicine, 48, 589-594. http://dx.doi.org/10.3414/ME9243
[6] Mansur, P.H.G., Cury, L.K.P., Andrade, A.O., Pereira, A.A., Miotto, G.A.A., Soares, A.B., et al. (2007) A Review on Techniques for Tremor Recording and Quantification. Critical Reviews in Biomedical Engineering, 35, 343-362. http://dx.doi.org/10.1615/CritRevBiomedEng.v35.i5.10
[7] Veluvolu, K.C. and Ang, W.T. (2011) Estimation of Physiological Tremor from Accelerometers for Real-Time Appli-cations. Sensors (Basel, Switzerland), 11, 3020-3036. http://dx.doi.org/10.3390/s110303020
[8] Grimaldi, G. and Manto, M. (2010) Neurological Tremor: Sensors, Signal Processing and Emerging Applications.
Sensors (Basel, Switzerland), 10, 1399-1422. http://dx.doi.org/10.3390/s100201399
[9] Hwang, I.-S., Lin, C.-C.K. and Wu, P.-S. (2009) Tremor Modulation in Patients with Parkinson’s Disease Compared to Healthy Counterparts during Loaded Postural Holding. Journal of Electromyography and Kinesiology: Official Journal
of the International Society of Electrophysiological Kinesiology, 19, e520-e528.
http://dx.doi.org/10.1016/j.jelekin.2009.03.005
[10] Massano, J. and Bhatia, K.P. (2012) Clinical Approach to Parkinson’s Disease: Features, Diagnosis, and Principles of Management. Cold Spring Harbor Perspectives in Medicine, 2, a008870.
http://dx.doi.org/10.1101/cshperspect.a008870
[11] Raethjen, J. and Deuschl, G. (2009) Tremor. Current Opinion in Neurology, 22, 400-405. http://dx.doi.org/10.1097/WCO.0b013e32832dc056
[13] Castelo-Branco, M., Mendes, M., Silva, F., Massano, J., Januário, G., Januário, C., et al. (2009) Motion Integration Deficits Are Independent of Magnocellular Impairment in Parkinson’s Disease. Neuropsychologia, 47, 314-320. http://dx.doi.org/10.1016/j.neuropsychologia.2008.09.003
[14] Deuschl, G., Bain, P. and Brin, M. (2008) Consensus Statement of the Movement Disorder Society on Tremor.
Move-ment Disorders, 13, 2-23. http://dx.doi.org/10.1002/mds.870131303
[15] Jankovic, J. (2008) Parkinson’s Disease: Clinical Features and Diagnosis. Journal of Neurology, Neurosurgery and
Psychiatry, 79, 368-376. http://dx.doi.org/10.1136/jnnp.2007.131045
[16] Zeuner, K.E., Shoge, R.O., Goldstein, S.R., Dambrosia, J.M. and Hallett, M. (2003) Accelerometry to Distinguish Psychogenic from Essential or Parkinsonian Tremor. Neurology, 61, 548-550.
http://www.ncbi.nlm.nih.gov/pubmed/12939436
http://dx.doi.org/10.1212/01.WNL.0000076183.34915.CD
[17] Schwingenschuh, P., Katschnig, P., Seiler, S., Saifee, T.A., Aguirregomozcorta, M., Cordivari, C., et al. (2011) Mov-ing toward “Laboratory-Supported” Criteria for Psychogenic Tremor. Movement Disorders: Official Journal of the
Movement Disorder Society, 26, 2509-2515. http://dx.doi.org/10.1002/mds.23922
[18] Shrout, P.E. and Fleiss, J.L. (1979) Intraclass Correlations: Uses in Assessing Rater Reliability. Psychological Bulletin,
86, 420-428. http://www.ncbi.nlm.nih.gov/pubmed/18839484 http://dx.doi.org/10.1037/0033-2909.86.2.420
[19] Marusiak, J., Jaskólska, A., Kisiel-Sajewicz, K., Yue, G.H. and Jaskólski, A. (2009) EMG and MMG Activities of Agonist and Antagonist Muscles in Parkinson’s Disease Patients during Absolute Submaximal Load Holding. Journal
of Electromyography and Kinesiology: Official Journal of the International Society of Electrophysiological
Kinesiolo-gy, 19, 903-914. http://dx.doi.org/10.1016/j.jelekin.2008.03.003
[20] Burne, J.A., Blanche, T. and Morris, J.J. (2004) Muscle Loading as a Method to Isolate the Underlying Tremor Com-ponents in Essential Tremor and Parkinson’s Disease. Muscle & Nerve, 30, 347-355.
http://dx.doi.org/10.1002/mus.20109
[21] Giuffrida, J.P., Riley, D.E., Maddux, B.N. and Heldman, D.A. (2009) Clinically Deployable Kinesia Technology for Automated Tremor Assessment. Movement Disorders: Official Journal of the Movement Disorder Society, 24, 723-730. http://dx.doi.org/10.1002/mds.22445
[22] Faria, P., Patricio, M., Philipiak, G., Caramelo, F., Januario, C., Freire, A., et al. (2013) Tremor Modulations across Periods with and without Voluntary Motion and Limb Load Task Demands Using Movement Quantification.
Proceed-ings of the 35th IEEE Annual International Conference of the Engineering in Medicine and Biology Society (EMBC),
Osaka, 3-7 July 2013, 4338-4341. http://dx.doi.org/10.1109/EMBC.2013.6610506
[23] Brown, P. (1997) Does Parkinsonian Action Tremor Contribute to Muscle Weakness in Parkinson’s Disease? Brain,
120, 401-408. http://dx.doi.org/10.1093/brain/120.3.401
[24] Budzianowska, A. and Honczarenko, K. (2008) Assessment of Rest Tremor in Parkinson’s Disease. Neurologia I
Neurochirurgia Polska, 42, 12-21. http://www.ncbi.nlm.nih.gov/pubmed/18365958
[25] Hellwig, B., Mund, P., Schelter, B., Guschlbauer, B., Timmer, J. and Lücking, C.H. (2009) A Longitudinal Study of Tremor Frequencies in Parkinson’s Disease and Essential Tremor. Clinical Neurophysiology: Official Journal of the
International Federation of Clinical Neurophysiology, 120, 431-435. http://dx.doi.org/10.1016/j.clinph.2008.11.002
[26] Zeuner, K.E. and Deuschl, G. (2012) An Update on Tremors. Current Opinion in Neurology, 25, 475-482. http://dx.doi.org/10.1097/WCO.0b013e3283550c7e
[27] Meshack, R.P. and Norman, K.E. (2002) A Randomized Controlled Trial of the Effects of Weights on Amplitude and Frequency of Postural Hand Tremor in People with Parkinson’s Disease. Clinical Rehabilitation, 16, 481-492. http://www.ncbi.nlm.nih.gov/pubmed/12194619
http://dx.doi.org/10.1191/0269215502cr521oa
[28] Pfann, K.D., Buchman, A.S., Comella, C.L. and Corcos, D.M. (2001) Control of Movement Distance in Parkinson’s Disease. Movement Disorders: Official Journal of the Movement Disorder Society, 16, 1048-1065.
http://www.ncbi.nlm.nih.gov/pubmed/11748736 http://dx.doi.org/10.1002/mds.1220
[29] Milanović, S., Filipović, S.R., Radovanović, S., Blesić, S., Ilić, N.V., Kostić, V.S., et al. (2013) Changes in Motor Cortex Excitability Associated with Muscle Fatigue in Patients with Parkinson’s Disease. Vojnosanitetski Pregled.
Military-Medical and Pharmaceutical Review, 70, 298-303. http://www.ncbi.nlm.nih.gov/pubmed/23607242