© 2017, IRJET | Impact Factor value: 5.181 | ISO 9001:2008 Certified Journal | Page 2825
COMPARATIVE ANALYSIS OF AN IRREGULAR STRUCTURE WITH
SHEARWALL AND WITHOUT SHEARWALL FRAME SYSTEM
Wasim Ahmad
1, Rizwanullah
21
M-Tech (Structure and Foundation Engineering) Department of Civil Engineering, Al-Falah University,
Faridabad, India
2
Assistant Professor . Department of Civil Engineering, Al-Falah University, Faridabad, India
---***---Abstract -
The main objective of the research workpresented in this paper is to study the seismic behavior and to compare the results of buildings with reinforced concrete shearwall and without shearwall. Two buildings, one with shear wall and one without shear wall with the same plan and equal number of storeys are considered. A brief review of design concept is presented and need of shear wall, effect of earthquake are discussed. Response spectrum analysis has been done to both the buildings with shear wall and without shearwall with same plan. The storey displacements of both the buildings are obtained and compared to each other to meet the shear wall effect. The analysis and design of models are done according to IS codes in an eco friendly software ETAB 2015
Key Words: Etabs, Response spectrum, Shearwall, Stiffness, Story drifts
1. INTRODUCTION
Shear walls are specially designed structural walls included in the buildings to resist horizontal forces that are induced in the plane of the wall due to wind, earthquake and other forces. They are mainly flexural members and usually provided in highrise buildings to avoid the total collapse of the highrise buildings under seismic forces. Shear wall has high in-plane stiffness and strength which can be used to simultaneously resist large horizontal loads and support gravity loads. Shear walls also provide lateral stiffness to prevent the roof or floor from excessive side sway.
1.1 MODEL CONFIGURATION
[image:1.595.337.539.231.448.2]Three buildings with twenty five story irregular reinforced concrete building are considered in seismic zone IV. The beam length in (x) transverse direction are 5m, and beams in (y) direction are of length 5m. Figure 1 and 2 shows the plan and 3D view of the twenty five story building having 6 bays in x-direction and four bays in y-direction. Story height of each building is assumed 3m. .Beam cross section 300X450 mm and Column cross section is 450x600 mm.
Fig 1.1:Building1
[image:1.595.328.545.234.733.2]© 2017, IRJET | Impact Factor value: 5.181 | ISO 9001:2008 Certified Journal | Page 2826
Fig 1.3: Plan of Building 1Fig 1.4: Plan of Building 2
1.2 TIME PERIOD
IS-1893-2016 defines different Sa/g values for different values of approximate time period (T). The fundamental natural period (Ta) is taken for moment resisting frame building without brick infill panels as Ta = 0.075h0.75 , Where, h = Height of the building in m.
Table 1.1 : Time period of Building 1 and 2.
Time Period Building 1 Building 2
Global x 1.36 1.36
Global y 1.36 1.36
1.3 DESIGN BASE SHEAR
The design base shear of a building can be calculated by using the code IS-1893-2002
Vb =Ah*W
Where Ah=design horizontal seismic coefficient W= seismic weight
The Design horizontal seismic coefficient (Ah) is a function of peak ground acceleration (z), Importance Factor (I), Response Reduction Factor (R) and Design acceleration coefficient (Sa/g) for different types of soil normalized corresponding to 5 % damping.
Ah=Z I Sa 2Rg
Sa/g values for medium soil according to IS-1893- 2002 For medium soil sites
[image:2.595.53.285.83.461.2]Sa/g =
Table -1.2: Design base shear for Building 1 and 2 for Equivalent static load
Design base
shear Building 1 Building 2
Global
X (KN) 1446.7803 1647.0879
Global Y(KN)
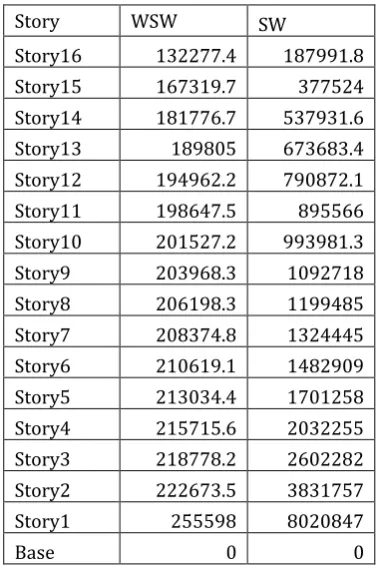
1.4 STIFFNESS
Table 1.3: Story stiffness in X direction for equivalent static loads
Story WSW SW
Story16 132277.4 187991.8
Story15 167319.7 377524
Story14 181776.7 537931.6
Story13 189805 673683.4
Story12 194962.2 790872.1
Story11 198647.5 895566
Story10 201527.2 993981.3
Story9 203968.3 1092718
Story8 206198.3 1199485
Story7 208374.8 1324445
Story6 210619.1 1482909
Story5 213034.4 1701258
Story4 215715.6 2032255
Story3 218778.2 2602282
Story2 222673.5 3831757
Story1 255598 8020847
Base 0 0
[image:2.595.339.528.468.751.2]© 2017, IRJET | Impact Factor value: 5.181 | ISO 9001:2008 Certified Journal | Page 2827
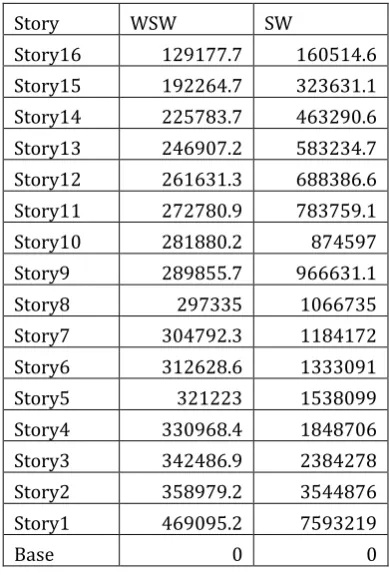
Table 1.4: Story stiffness in Y direction for equivalentstatic load
Story WSW SW
Story16 129177.7 160514.6 Story15 192264.7 323631.1 Story14 225783.7 463290.6 Story13 246907.2 583234.7 Story12 261631.3 688386.6 Story11 272780.9 783759.1
Story10 281880.2 874597
Story9 289855.7 966631.1
Story8 297335 1066735
Story7 304792.3 1184172
Story6 312628.6 1333091
Story5 321223 1538099
Story4 330968.4 1848706
Story3 342486.9 2384278
Story2 358979.2 3544876
Story1 469095.2 7593219
Base 0 0
[image:3.595.59.263.465.748.2]1.5 MAXIMUM STORY DISPLACEMENT
Table 1.5: Max displacement in X Direction
Story WSW SW
Story16 86.282 17.568
Story15 84.519 16.201
Story14 81.805 14.817
Story13 78.247 13.418
Story12 73.964 12.011
Story11 69.068 10.605
Story10 63.665 9.211
Story9 57.851 7.844
Story8 51.717 6.52
Story7 45.345 5.258
Story6 38.807 4.093
Story5 32.172 3.033
Story4 25.496 2.087
Story3 18.83 1.283
Story2 12.216 0.648
Story1 5.698 0.212
Base 0 0
Chart 1: Displacement in x direction
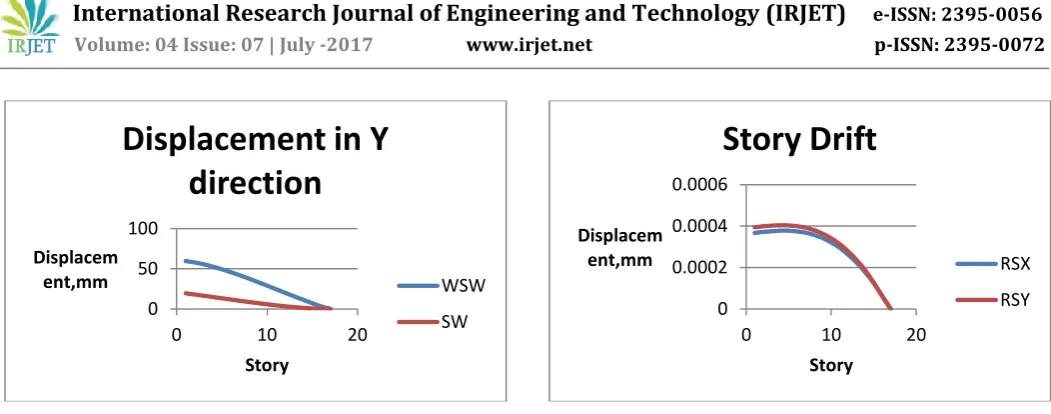
Table 1.6: Max displacement in Y Direction for equivalent static load
Story WSW SW
Story16 59.659 19.459
Story15 57.864 17.937
Story14 55.512 16.395
Story13 52.658 14.84
Story12 49.378 13.276
Story11 45.743 11.715
Story10 41.822 10.169
Story9 37.68 8.655
Story8 33.378 7.189
Story7 28.974 5.794
Story6 24.52 4.49
Story5 20.064 3.301
Story4 15.652 2.252
Story3 11.322 1.37
Story2 7.112 0.681
Story1 3.084 0.217
Base 0 0
0 50 100
0 10 20
Displacem ent,mm
Story
Displacement in x
direction
WSW
© 2017, IRJET | Impact Factor value: 5.181 | ISO 9001:2008 Certified Journal | Page 2828
Chart 2: Displacement in Y direction
[image:4.595.35.561.49.256.2]1.6 STORY DRIFT
Table 1.7: Story drift of building with shear wall due to response spectrum
Story RSX RSY
Story16 0.000367 0.000394 Story15 0.000372 0.000399 Story14 0.000375 0.000402 Story13 0.000378 0.000404 Story12 0.000378 0.000403 Story11 0.000374 0.000399 Story10 0.000368 0.000392
Story9 0.000357 0.00038
Story8 0.000342 0.000363
Story7 0.000321 0.000341
Story6 0.000295 0.000313
Story5 0.000262 0.000278
Story4 0.000223 0.000236
Story3 0.000177 0.000187
Story2 0.000124 0.000128
Story1 6.30E-05 6.20E-05
Base 0 0
Chart 3: Story drift of building with shear wall due to response spectrum
Table 1.8: Story Drift of building without shear wall due to response spectrum
Story RSX RSY
Story16 0.000493 0.000471 Story15 0.000787 0.000638 Story14 0.001016 0.000781 Story13 0.001187 0.000891 Story12 0.001322 0.000974 Story11 0.001435 0.001038 Story10 0.001536 0.001087
Story9 0.00163 0.001125
Story8 0.001716 0.001157
Story7 0.00179 0.001185
Story6 0.001858 0.001212
Story5 0.00192 0.001236
Story4 0.00198 0.00126
Story3 0.002044 0.001283
Story2 0.002103 0.001284
Story1 0.001895 0.001014
Base 0 0
0 50 100
0 10 20
Displacem ent,mm
Story
Displacement in Y
direction
WSW
SW 0
0.0002 0.0004 0.0006
0 10 20
Displacem ent,mm
Story
Story Drift
RSX
[image:4.595.327.522.343.629.2]© 2017, IRJET | Impact Factor value: 5.181 | ISO 9001:2008 Certified Journal | Page 2829
Chart 4: Story drift of building without shear wall dueto response spectrum
3. CONCLUSIONS
By analyzing the buildings with shear wall and without shear wall we conclude that the maximum displacement at top story occurs in the building with no shear wall i.e. with a displacement of 59.659 mm in Y direction while in the building with shear wall the displacement is19.459 mm in the Y direction. While in X direction the displacements are shown in Table 1.5. This shows us that the minimum displacement occurs in the building with the shear wall.
The stiffness in building without shear wall is most as compared to buildings with shear walls as shown in Table 1.3 and 1.4.
Also the story drifts are found to be maximum in the building without shear wall as compared to building with shear wall which we can deduce from tables 1.7 and 1.8.
The result of the analysis concludes that the building with shear wall is much safer as compared to a building without shear wall.
REFERENCES
[1] Romy Mohan and C Prabha, “Dynamic Analysis of RCC
Buildings with shear wall”, International Journal of Earth Science and Engineering,Vol.04,No.06, October 2011
[2] RS Malik, SK Madan, VK Sehgal, Effect of Height on
Seismic Response of Reinforced Cement Concrete Framed Buildings with Curtailed Shear Wall
[3] P. P. Chandurkar, Dr. P. S. Pajgade,""Seismic Analysis
of RCC Building with and Without Shear Wall", International Journal of Modern Engineering Research (IJMER), Vol. 3, Issue. 3, May - June 2013 pp-1805-1810
0 0.001 0.002 0.003
0 10 20
Displacem ent,mm
Story
Story Drift
RSX