http://dx.doi.org/10.4236/odem.2014.24009
Evaluation of Occupational Risk Factors for
Healthcare Workers through Analysis of
the Florida Workers’ Compensation
Claims Database
Sheila Mohammed, Davinderjit Singh, Giffe T. Johnson, Ping Xu, James D. McCluskey, Raymond D. Harbison
Center for Environmental and Occupational Risk Analysis and Management, Department of Environmental and Occupational Health, College of Public Health, University of South Florida, Tampa, FL, USA
Email: [email protected]
Received 5 September 2014; revised 17 October 2014; accepted 3 November 2014
Copyright © 2014 by authors and Scientific Research Publishing Inc.
This work is licensed under the Creative Commons Attribution International License (CC BY).
http://creativecommons.org/licenses/by/4.0/
Abstract
The purpose of this study is to evaluate occupational risk factors for nurses and CNAs by analyzing the Florida workers’ compensation claims database. Risk factors for the cause of injury, nature of injury, body part injured, and demographic and lifestyle factors were evaluated for a sample of CNAs, nurses, and restaurant servers. The results identified falls, lifting, being struck, and pushing and pulling as major causes for injury among nurses and CNAs as compared to servers. Regarding the nature of injury, sprains and strains constituted the majority of claims for nurses and CNAS with the lower back being the body part most commonly injured in a claim. The results of this study indicate that nurses and CNAs are at far greater risk for physical injury than injury or illness from chemical or biological exposures. It is recommended that emphasis must be placed on inter-ventions for musculoskeletal injuries such as falls and lifting, taking into account environmental factors such as age and lifestyle factors that further exacerbate risk for injury.
Keywords
Healthcare Workers, Workers’ Compensation, Physical Hazards, Occupational Injury
1. Introduction
emerging evidence that physical hazards may constitute a larger determinant of occupational health risk. Health- care workers as a whole are more likely to experience a musculoskeletal disorder (MSD) than workers in con-struction mining or manufacturing [1]. Among nurses, 52% complain of chronic back pain with a lifetime pre-valence of up to 80% [2]. Thirty-eight percent of nurses’ report having occupational-related back pain severe enough to require leave from work [3]. Back pain is so ubiquitous in the profession that many nurses accept musculoskeletal pain as part of their job [4]. Twelve percent of nurses who leave the profession report back pain as a main contributory factor and 20% have reported changing to a different unit, position, or employment be-cause of back pain [5].
Injury from physical hazards may have a substantial impact on the costs from occupational injury in the healthcare sector. The average workers’ compensation cost for back pain is $10,698 per case [6] and nursing personnel have among the highest incidence rates of workers’ compensation claims for back injuries for all oc-cupational classifications [2]. In 2010, nursing aides, orderlies, and attendants had the highest rates of MSDs of all occupations with an incidence of 249 per 10,000 compared to 34 per 10,000 for all workers [7].
Among healthcare workers, one of the most frequent causes of injury is the manual handling of patients [4] [6]. Musculoskeletal disorders are aggravated by working in awkward postures with very repetitive or static forceful exertions [6]. The cumulative weight lifted by a nurse in one typical 8-hour shift is equivalent to 1.8 tons [8]. The repetitive heavy stress on individual employees is likely impacted by decreased staffing resulting in an increased per employee workload. A study of 21 hospitals in the Twin Cities found that when Registered Nurse (RN) positions were decreased by 9%, work-related illnesses and injuries among nurses increased by 65%
[9]. The aging healthcare worker population may make these workers more susceptible to injury from physical hazards; the average age of a registered nurse in the United States is approximately 47 years [6].
Given the emerging evidence that demonstrates the importance of physical hazards on healthcare worker in-jury rates, the current research was conducted to evaluate the workers’ compensation claims made by Certified Nursing Assistants (CNAs), nurses, and servers in the state of Florida for the year 2010. Claims analysis pro-vides inference on the risk factors leading to the most important adverse health outcomes in nurses and CNAs as compared to a baseline population and characterizes the impact of demographic and environmental factors. By identifying important sources of injury and illness and assessing their relative uniqueness to healthcare workers, the results of this study provide guidance for areas of injury prevention among this population.
2. Methods
2.1. Data Collection
All open claims for CNAs, RNs, Licensed Practical Nurses (LPNs), and servers, for the year 2010 were queried from the claims database of the Florida Workers’ Compensation Bureau of Data Quality and Collection. Data were available for demographic classifications, cause of injury, nature of injury, body part injured age, gender, time of injury, day, month, year of injury, length of time workers were off-work, weekly wages received during off-duty periods, and city and county in which the injury took place. The data were formatted and coded ac-cording to standards from the International Association of Industrial Accident Boards and Commissions (IAIABC). This study was certified exempt from the University of South Florida Institutional Review Board (IRB) rules for Human Subjects Research as no personally identifiable information was transmitted to study personnel in the data collection process.
2.2. Data Analysis
Descriptive data analysis for nature of injury according to various risk factors was performed by calculating measures of central tendency and frequency stratified by worker classification and demographic variables. Lo-gistic regression analysis and linear regression analysis for outcomes of interest were performed to determine whether adverse health outcomes were associated with healthcare workers compared to the baseline population (servers), and to determine the magnitude of such associations. Microsoft Excel 2010 and SAS version 9.2 were used to tabulate and analyze the data.
3. Results
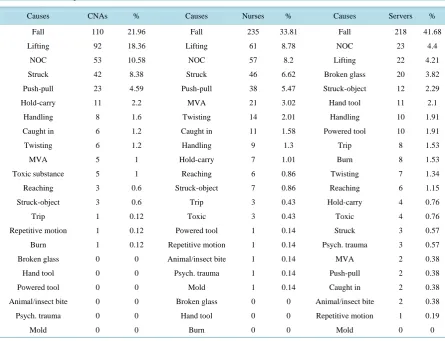
“nurse” claims, and 523 “server” claims were queried and extracted for analysis. The frequency of causes of in-jury are reported in Table 1, where falls, lifting injuries, and Contact with NOC (Not Otherwise Classified) in any other code predominated among all 3 employee classifications. Not Otherwise Classified in any other code includes cleaning agents and fertilizers. Among the three groups, servers had the greatest percentage of claims related to falls at 41.68%. In terms of lifting injuries, CNAs had the greatest percentage at 21.96% followed by nurses at 8.78%. Push/pull injuries were similar for nurses and CNAs at 5.47%, and 4.59% respectively, while for the baseline population, servers, there were only 0.38% injuries from pushing and pulling. Lifting is the greatest risk factor across all groups with CNAs bearing the greatest burden at 18.3%. Injuries from hold/carry job tasks were highest for CNAs at 2.2% while for nurses it was 1.01% and only 0.76% for servers.
Sprains and strains were by far the most common nature of injury across all three study groups with the high-est percentage being for CNAs (Table 2). Contusion injuries among the three groups were similar for CNAs, nurses and servers. Fracture injuries were most prominent in the baseline server population closely followed by nurses. CNAs were 1.5 times as likely to claim injury for occupational disease by chemical exposure as com-pared to servers. Nurses were twice as likely to claim injury from chemical exposure as comcom-pared to servers.
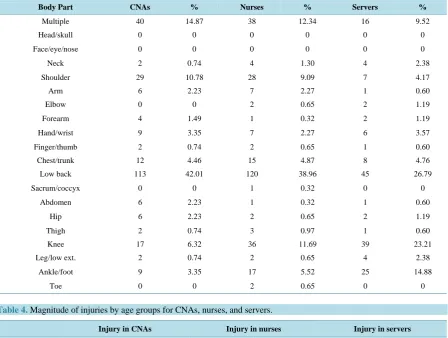
[image:3.595.90.536.384.725.2]Lower back injuries occurred at the highest frequency across all study groups (Table 3). Lower back injury for nurses is 1.5 times higher than that of our baseline population. Shoulder injuries occurred at the highest fre-quency in CNAs followed by nurses and the baseline population. CNAs and nurses were twice as likely to file a claim for shoulder injury compared to servers. Knee injuries were highest in our population of servers as com-pared to nurses and CNAs. Injuries to the ankle and foot body part occurred at the highest frequency in our baseline population as compared to nurses and CNAs. In the youngest age group, servers are much more likely to file a claim than CNAs or nurses (Table 4). This may be due to a younger population working as servers. Most claims for CNAs and nurses were filed by the 44 - 54 age group. There was a high rate of claim for nurses in the 55 - 65 age group.
Table 1. Causes of injuries for CNAs, nurses, and servers.
Causes CNAs % Causes Nurses % Causes Servers %
Fall 110 21.96 Fall 235 33.81 Fall 218 41.68
Lifting 92 18.36 Lifting 61 8.78 NOC 23 4.4
NOC 53 10.58 NOC 57 8.2 Lifting 22 4.21
Struck 42 8.38 Struck 46 6.62 Broken glass 20 3.82
Push-pull 23 4.59 Push-pull 38 5.47 Struck-object 12 2.29
Hold-carry 11 2.2 MVA 21 3.02 Hand tool 11 2.1
Handling 8 1.6 Twisting 14 2.01 Handling 10 1.91
Caught in 6 1.2 Caught in 11 1.58 Powered tool 10 1.91
Twisting 6 1.2 Handling 9 1.3 Trip 8 1.53
MVA 5 1 Hold-carry 7 1.01 Burn 8 1.53
Toxic substance 5 1 Reaching 6 0.86 Twisting 7 1.34
Reaching 3 0.6 Struck-object 7 0.86 Reaching 6 1.15
Struck-object 3 0.6 Trip 3 0.43 Hold-carry 4 0.76
Trip 1 0.12 Toxic 3 0.43 Toxic 4 0.76
Repetitive motion 1 0.12 Powered tool 1 0.14 Struck 3 0.57
Burn 1 0.12 Repetitive motion 1 0.14 Psych. trauma 3 0.57
Broken glass 0 0 Animal/insect bite 1 0.14 MVA 2 0.38
Hand tool 0 0 Psych. trauma 1 0.14 Push-pull 2 0.38
Powered tool 0 0 Mold 1 0.14 Caught in 2 0.38
Animal/insect bite 0 0 Broken glass 0 0 Animal/insect bite 2 0.38
Psych. trauma 0 0 Hand tool 0 0 Repetitive motion 1 0.19
Table 2.Magnitude of nature of injury for CNAs, nurses, and servers.
Nature of injury CNAs % Nurses % Servers %
Fracture 25 4.99 103 14.82 80 15.30
Contusion 64 12.77 90 12.95 53 10.13
Strain/sprain 259 51.70 289 41.58 164 31.36
Infection 2 0.4 0 0 0 0
Laceration 2 0.4 9 1.29 59 11.25
Puncture 0 0 2 0.29 3 0.57
Burn 1 0.2 0 0 13 2.49
Occupational disease 3 0.6 6 0.86 2 0.38
Concussion 1 0.2 4 0.58 2 0.38
[image:4.595.90.539.285.623.2]Hernia 1 0.2 4 0.58 3 0.57
Table 3.Sprain and strain injuries as a % to various body parts for CNAs, nurses, and servers.
Body Part CNAs % Nurses % Servers %
Multiple 40 14.87 38 12.34 16 9.52
Head/skull 0 0 0 0 0 0
Face/eye/nose 0 0 0 0 0 0
Neck 2 0.74 4 1.30 4 2.38
Shoulder 29 10.78 28 9.09 7 4.17
Arm 6 2.23 7 2.27 1 0.60
Elbow 0 0 2 0.65 2 1.19
Forearm 4 1.49 1 0.32 2 1.19
Hand/wrist 9 3.35 7 2.27 6 3.57
Finger/thumb 2 0.74 2 0.65 1 0.60
Chest/trunk 12 4.46 15 4.87 8 4.76
Low back 113 42.01 120 38.96 45 26.79
Sacrum/coccyx 0 0 1 0.32 0 0
Abdomen 6 2.23 1 0.32 1 0.60
Hip 6 2.23 2 0.65 2 1.19
Thigh 2 0.74 3 0.97 1 0.60
Knee 17 6.32 36 11.69 39 23.21
Leg/low ext. 2 0.74 2 0.65 4 2.38
Ankle/foot 9 3.35 17 5.52 25 14.88
Toe 0 0 2 0.65 0 0
Table 4.Magnitude of injuries by age groups for CNAs, nurses, and servers.
Injury in CNAs Injury in nurses Injury in servers
Age groups Number Percent Number Percent Number Percent
17 - 21 14 3.18 1 0.17 55 1233
22 - 32 89 20.23 39 6.48 110 24.66
33 - 43 110 25 149 24.75 105 23.54
44 - 54 140 31.82 207 34.39 99 22.3
55 - 65 79 17.95 173 28.74 62 13.9
[image:4.595.87.536.606.721.2]The frequency of injuries tapered off with length of time (Table 5). In the 49 - 60 month range, the baseline population was at 0.19%, nurses were at 0.58% and CNAs were at 0%.
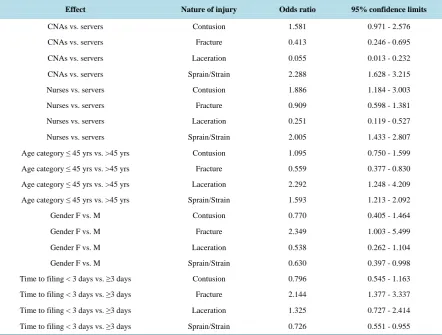
[image:5.595.87.539.221.360.2]Logistic regression analysis demonstrated that CNAs were less than half as likely to claim a fracture injury as compared to servers (Table 6). Servers were 20 times more likely to report laceration than CNAs. Both CNAs and nurses were twice as likely to report sprain/strain injuries as compared to servers. Younger workers less than 45 years of age were twice as likely to report laceration and about half as likely to report fracture. Younger workers less than 45 years of age, were 1.5 times more likely to report sprains and strains. Females were about half as likely to claim strains and sprains, but twice as likely to claim fracture. Sprains and strains, and fracture were more likely to have delayed reporting of more than 3 days from the time of injury.
Table 5. Injury-related length of time off-work in months for CNAs, nurses and servers.
CNAs Nurses Servers
Months Number of injury % Number of injury % Number of injury %
0 - 6 444 88.62 630 90.65 448 85.66
7 - 12 30 5.99 28 4.03 20 3.82
13 - 24 21 4.19 18 2.59 8 1.53
25 - 36 3 0.6 8 1.15 3 0.57
37 - 48 1 0.2 5 0.72 1 0.19
49 - 60 0 0 4 0.58 1 0.19
Table 6. Logistic regression analysis for nature of injury showing odds ratio estimates and confidence intervals.
Effect Nature of injury Odds ratio 95% confidence limits
CNAs vs. servers Contusion 1.581 0.971 - 2.576
CNAs vs. servers Fracture 0.413 0.246 - 0.695
CNAs vs. servers Laceration 0.055 0.013 - 0.232
CNAs vs. servers Sprain/Strain 2.288 1.628 - 3.215
Nurses vs. servers Contusion 1.886 1.184 - 3.003
Nurses vs. servers Fracture 0.909 0.598 - 1.381
Nurses vs. servers Laceration 0.251 0.119 - 0.527
Nurses vs. servers Sprain/Strain 2.005 1.433 - 2.807
Age category ≤ 45 yrs vs. >45 yrs Contusion 1.095 0.750 - 1.599
Age category ≤ 45 yrs vs. >45 yrs Fracture 0.559 0.377 - 0.830
Age category ≤ 45 yrs vs. >45 yrs Laceration 2.292 1.248 - 4.209
Age category ≤ 45 yrs vs. >45 yrs Sprain/Strain 1.593 1.213 - 2.092
Gender F vs. M Contusion 0.770 0.405 - 1.464
Gender F vs. M Fracture 2.349 1.003 - 5.499
Gender F vs. M Laceration 0.538 0.262 - 1.104
Gender F vs. M Sprain/Strain 0.630 0.397 - 0.998
Time to filing < 3 days vs. ≥3 days Contusion 0.796 0.545 - 1.163
Time to filing < 3 days vs. ≥3 days Fracture 2.144 1.377 - 3.337
Time to filing < 3 days vs. ≥3 days Laceration 1.325 0.727 - 2.414
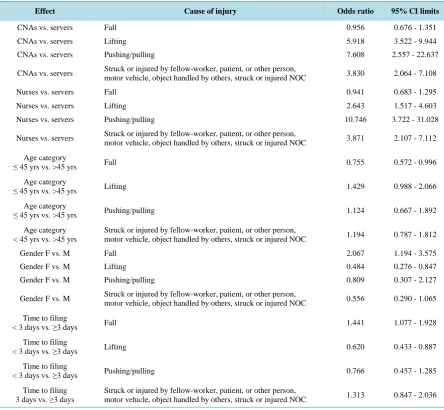
[image:5.595.95.538.386.721.2]CNA’s were almost 6 times as likely to claim lifting injuries, 7 times as likely to claim pushing/pulling inju-ries and were almost 4 times as likely to claim being “struck” by something or someone in the workplace com-pared to servers (Table 7). Also, nurses were 10 times as likely to claim pushing/pulling injuries, as well as having increased “struck” and “lifting” injuries. Younger workers (less than 45 yrs old) were less likely to report falls. Females were twice as likely to report a fall injury and half as likely to claim “lifting” injuries as compared to males and fall injuries were 1.5 times likely to have delayed filing 3 days or more after the injury. Lifting in-juries were also almost twice as likely to have delayed filing (3 days or more).
Younger workers (45 years of age, or less) were slightly more likely to claim some degree of permanent im-pairment than older workers (Table 8). CNA’s on average, reached maximum medical improvement 89 days faster than servers while the findings for nurses were not significant. Another finding which was not significant but close, is that for every 1 day filing was delayed, time to recovery increased to 1.14 days (Table 9).
[image:6.595.90.535.314.724.2]The duration of benefits was also evaluated to characterize relative costs, however, but few statistically sig-nificant findings resulted. A finding which approached statistical significance was that CNAs on average re-ceived benefits about 12 days more than servers. A significant finding was that for every 1 year increase in age, claimants received on average about a half day more benefits. This means that for every 10 years increase in age, about 5 more days of benefits was received. Another significant finding was that, on average, females received benefits about 25 days longer than males.
Table 7.Logistic regression analysis for cause of injury showing odds ratios and confidence intervals.
Effect Cause of injury Odds ratio 95% CI limits
CNAs vs. servers Fall 0.956 0.676 - 1.351
CNAs vs. servers Lifting 5.918 3.522 - 9.944
CNAs vs. servers Pushing/pulling 7.608 2.557 - 22.637
CNAs vs. servers Struck or injured by fellow-worker, patient, or other person, motor vehicle, object handled by others, struck or injured NOC 3.830 2.064 - 7.108
Nurses vs. servers Fall 0.941 0.683 - 1.295
Nurses vs. servers Lifting 2.643 1.517 - 4.603
Nurses vs. servers Pushing/pulling 10.746 3.722 - 31.028
Nurses vs. servers Struck or injured by fellow-worker, patient, or other person,
motor vehicle, object handled by others, struck or injured NOC 3.871 2.107 - 7.112
Age category
≤ 45 yrs vs. >45 yrs Fall 0.755 0.572 - 0.996
Age category
≤ 45 yrs vs. >45 yrs Lifting 1.429 0.988 - 2.066
Age category
≤ 45 yrs vs. >45 yrs Pushing/pulling 1.124 0.667 - 1.892
Age category < 45 yrs vs. >45 yrs
Struck or injured by fellow-worker, patient, or other person,
motor vehicle, object handled by others, struck or injured NOC 1.194 0.787 - 1.812
Gender F vs. M Fall 2.067 1.194 - 3.575
Gender F vs. M Lifting 0.484 0.276 - 0.847
Gender F vs. M Pushing/pulling 0.809 0.307 - 2.127
Gender F vs. M Struck or injured by fellow-worker, patient, or other person, motor vehicle, object handled by others, struck or injured NOC 0.556 0.290 - 1.065
Time to filing
< 3 days vs. ≥3 days Fall 1.441 1.077 - 1.928
Time to filing
< 3 days vs. ≥3 days Lifting 0.620 0.433 - 0.887
Time to filing
< 3 days vs. ≥3 days Pushing/pulling 0.766 0.457 - 1.285
Time to filing
Table 8. Logistic regression evaluating permanent impairment for the various groups.
Effect Permanent impairment Odds ratio 95% Confidence limits
CNAs vs. servers 0 0.962 0.682 - 1.398
Nurses vs. servers 0 0.781 0.566 - 1.079
Age category ≤ 45 yrs vs. >45 yrs 0 1.358 1.038 - 1.777
Gender F vs. M 0 0.701 0.429 - 1.146
Time to filing < 3 days vs. ≥3 days 0 0.784 0.593 - 1.036
Table 9. Linear regression analysis of time to recovery.
Parameter Estimate Standard error t value Pr > [t]
Intercept 245.4099070 55.13404058 4.45 <0.0001
CNAs −89.1738657 29.94658995 −2.98 0.0030
Nurses −43.1738147 29.07357755 −1.48 0.1382
Servers 0.0000000 . . .
Age at injury −0.0799480 0.92508195 −0.09 0.9312
Time to filing 1.1464600 0.61356479 1.87 0.0623
Gender-F 44.7656236 42.57993890 1.05 0.2936
Gender-M 0.0000000
4. Discussion
Based on both the descriptive evaluation of the dataset and the data analysis using logistic regression, sprains and strains were the number one cause of injury in all three study groups. CNAs and nurses were twice as likely to report sprains and are most at risk as the burden of assisting patients with their Activities of Daily Living (ADL) is a major part of their job tasks. CNAs have the primary responsibility for heavy lifting and may rarely use mechanical aids. Most strains and sprains occur from sudden load to the body as when a patient moves sud-denly and shifts their body weight and the CNAs body performs an involuntary reaction to that sudden move-ment.
Upon examining the results of the descriptive analysis for infectious disease, puncture wounds and chemical exposures, it was found that CNAs are at greater risk for infection even though the frequency was extremely low. One explanation for this finding is that CNAs are mostly responsible for assisting patients with cleaning and toileting activities which bring them in close contact with patients’ and bodily fluids and excreta. Puncture wounds, including needle stick injuries were uncommon for CNAs. Nurses had a low frequency for puncture wounds compared to the baseline population of servers. Nurses were half as likely to suffer a puncture wound as compared to servers. Needle stick injuries, infectious diseases and stress-related claims infrequently resulted in time-loss claims although they are known to cause great concern in the workplace. Occupational exposure to blood and body fluids is common among health care workers but most exposures confer a low risk of blood borne infection. Healthcare workers are also exposed to hepatitis B, hepatitis C, and human immunodeficiency viruses in non-hospital settings. The results suggest this area of occupational exposure for healthcare workers is well controlled despite the obvious opportunities to come into contact with it.
[image:7.595.87.537.222.368.2]The summary statistics for lifting injuries demonstrated that CNAs made the most claims for injuries due to lifting. They were 4 times more likely to file a workers’ compensation claim as compared to servers. This corre-lates well with the logistic regression analysis which produced significant results for CNAs lifting injury claims being 6 times greater as compared to servers. Similar results of a lesser magnitude were found for nurses. These results complement a lifting team study that showed that a 95% reduction in lost time injuries can be obtained if a professional lifting team lifted clients, as opposed to CNAs and nurses doing the lifting. The “lift team” me-thod was devised to remove nursing personnel from the everyday task of moving patients. This type of interven-tion assumes that lifting is a specialized skill to be performed only by expert professional patient movers who have been thoroughly trained in the latest lifting device techniques [11]. Better training for CNAs and nurses in good lifting and handling techniques may be called for as it has previously been reported that although 82% of nurses surveyed believed they used safe manual handling practices, only 18% of these 106 nurses correctly answered items assessing manual handling knowledge [12].
Overtime work and being of female gender increases risk for injury among heavy lifters, as does the influence of other nurses. One possible lifting solution is a “tag-team” approach to care delivery for patients. In this me-thod, nurses and clinical assistants work in pairs as they provide care. No single person positioning and transfers are done when there is a clear need for two people. One staff member is not assigned to complete total care for patients when two staff members could complete the task more safely and efficiently. There is a need for poli-cies to be in place to prevent lifting injuries. One such policy is the “Zero Lift” policy which nurses have been researching and promoting for many years. The goal of zero lift policies is to replace manual lifting with me-chanical lifting during transferring, and re-positioning of patients. Use of patient assist devices reduces patient- handling injury claims by 43% and time lost frequency rate by 50% [13].
Our results indicated that overall, younger workers who are 45 years old or less, were slightly more likely to claim some degree of permanent impairment compared to older workers more than 45 years old. However, summary statistics showed that in the younger age groups, servers had more injures as compared to CNAs, and nurses. At age group 44 - 54 years, CNAs and nurses were much more likely to file a claim and at the older age group of 55 - 65 years, nurses were much more likely to file a claim. There was a similar trend in the 66 - 80 age group. This may be due to the ageing nursing workforce, as well as diminishing levels of fitness with age.
Linear regression analysis demonstrated that CNAs, on average, reached Maximum Medical Improvement (MMI) 89 days faster than the baseline population of servers. There may be injury independent factors that mo-tivate CNAs to return to work more quickly than servers. As well, though not highly significant, it was found that for every 1 day the claim filing delayed, time to recovery increased by 1.14 days. It may be that injuries not immediately reported and treated may incur a longer recovery period.
5. Limitations
Claims data may not be representative of all injuries that occur in the healthcare industry. Any work-related in-juries or illnesses not reported to the WCB would have been missed in this study, and therefore our results may underestimate to some extent the true burden of injury and illness among CNAs and nurses. The magnitude of under-reporting is unknown. In addition, the Florida workers compensation claims database does not collect all data elements listed in the IAIABC. The mechanism of injury is not documented, which could provide insightful analysis in the effort of designing safety interventions. It is recommended that the Florida Workers’ Compensa-tion Bureau of Data Quality and CollecCompensa-tion adopt a more comprehensive variable set from the IAIABC to fur-ther characterize the nature of illness and injury produced by workplace exposures.
6. Conclusion
References
[1] CDC (Centers for Disease Control) (2009) Preventing Back Injuries in Healthcare Settings. Journal of Long-Term Ef-fects of Medical Implants, 14, 521-553.
[2] Edlich, R.F., Winters, K.L., Hudson, M.A., Britt, L.D. and Long, W.B. (2004) Prevention of Disabling Back Injuries in Nurses by the Use of Mechanical Patient Lift Systems. Journal of Long-Term Effects of Medical Implants, 14, 521-533.
http://www.dl.begellhouse.com/journals/1bef42082d7a0fdf,16037a523da07b06,399de97714c998eb.html http://dx.doi.org/10.1615/JLongTermEffMedImplants.v14.i6.70
[3] American Nursing Association (2012) Handle with Care Fact Sheet.
http://www.nursingworld.org/MainMenuCategories/ANAMarketplace/Factsheets-and-Toolkits/FactSheet.html
[4] Gropelli, T. and Corle, K. (2011) Assessment of Nurses’ and Therapists’ Occupational Musculoskeletal Injuries. Med-surg Nursing, 20,297-304.
http://search.ebscohost.com/login.aspx?direct=true&db=a2h&AN=67702133&site=ehost-live
[5] Li, J., Wolf, L. and Evanoff, B. (2004) Use of Mechanical Patient Lifts Decreased Musculoskeletal Symptoms and In-juries among Health Care Workers. Injury Prevention, 10, 212-216.
http://injuryprevention.bmj.com/content/10/4/212.long http://dx.doi.org/10.1615/JLongTermEffMedImplants.v14.i6.70
[6] HHS (2012) Prevalence of Obesity in the United States, 2009-2010. NCHS Data Brief.
http://www.cdc.gov/nchs/data/databriefs/db82.htm
[7] Department of Labor (2012) Healthcare Facilities.
http://www.osha.gov/SLTC/healthcarefacilities/index.htm
[8] Nelson, A. and Baptiste, A. (2004) Evidence-Based Practices for Safe Patient Handling and Movement. Online Journal of Issues in Nursing, 9.
http://www.nursingworld.org/MainMenuCategories/ANAMarketplace/ANAPeriodicals/OJIN/TableofContents/Volum e92004/No3Sept04/EvidenceBasedPractices.aspx
[9] Trinkoff, A.M., Johantgen, M., Muntaner, C. and Rong, L. (2005) Staffing and Worker Injury in Nursing Homes. American Journal of Public Health, 95, 1220-1225.
http://ajph.aphapublications.org/doi/pdfplus/10.2105/AJPH.2004.045070http://dx.doi.org/10.2105/AJPH.2004.045070
[10] Collins, J.W., Bell, J.L. and Gronqvist, R. (2010) Developing Evidence-Based Interventions to Address the Leading Causes of Workers’ Compensation among Healthcare Workers. Rehabilitation Nursing, 35, 225-235.
http://www.rehabnurse.org/uploads/apps/files/RNJ_10%20NOV%20DEC(1).pdf http://dx.doi.org/10.1002/j.2048-7940.2010.tb00052.x
[11] Hefti, K.S., Farnham, R.J., Docken, L., Bentaas, R., Bossman, S. and Schaefer, J. (2003) Back Injury Prevention: A Lift Team Success Story. AAOHN Journal, 51, 246-251.
[12] Kay, K. and Glass, N. (2011) Debunking the Manual Handling Myth: An Investigation of Manual Handling Know-ledge and Practices in the Australian Private Health Sector.International Journal of Nursing Practice, 17, 231-237.
http://onlinelibrary.wiley.com/doi/10.1111/j.1440-172X.2011.01930.x/full http://dx.doi.org/10.1111/j.1440-172X.2011.01930.x
[13] Charney, W., Simmons, B., Lary, M. and Metz, S. (2006) Zero Lift Programs in Small Rural Hospitals in Washington State: Reducing Back Injuries among Health Care Workers. AAOHN Journal, 54, 355-358.