© 2017, IRJET | Impact Factor value: 5.181 | ISO 9001:2008 Certified Journal | Page 1767
COMPARISON AND OPTIMIZATION OF CUTTING PARAMETERS IN CNC
TURNING OF EN8 STEEL USING VEGETABLE OIL AND AL2O3
NANOCOOLANT AS CUTTING FLUID
Phati P. Sawant
1, Abhay S. Naik
2, Gaurav A. Desai
3, Abhijit R. Bhagat
4, Khandekar S. B.
51,2,3,4
Students of B.E., Mechanical Engineering, Rajendra Mane College of Engineering & Technology, Ambav,
Devrukh, Maharashtra, India
5
Assistant Professor, Mechanical Engineering, Rajendra Mane College of Engineering and Technology, Ambav,
Devrukh, Maharashtra, India.
---***---Abstract -
In this study, an attempt has been made tocompare machining parameters in CNC turning of EN8 steel
using vegetable oil and AL2O3 nanocoolant as cutting fluid and
to suggest the optimum machining parameters and process. Experiments were designed using Taguchi method and were carried out on CNC lathe using Tungsten Carbide inserts as cutting tool. The results obtained showed better surface finish and reduced tool wear using nanocoolant as cutting fluids. By using ANOVA, the optimum machining condition for tool life, surface roughness was found out.
Key Words: EN8 Steel, vegetable oil (High Cut 150), depth of cut, feed rate, Spindle speed, surface roughness, tool wear, nanoparticle concentration, DOE.
1. INTRODUCTION
In machining process, turning is the most basic and widely used operation. Turning operation includes parameters such as, feed rate, spindle speed, depth of cut, cutting fluids, tool geometry, which have major impact on surface finish, tool wear, cutting temperature, material removal rate and dimensional stability of workpiece material and this in turn affects the manufacturing cost. The selection of optimum cutting parameters is essential to obtain better product quality and to minimize the overall cost of production. Nanoparticles, because of their high thermal conductivity and better heat removal rate are mixed with vegetable oils as base fluids and used as cutting fluids.
EN8 carbon steel is medium carbon and medium tensile steel with improved strength over mild steel through hardening. EN8 is readily machinable in any condition. EN8 is suitable for all general engineering applications requiring a high strength than mild steel such as shafts, gears, bolts, studs, axles etc. In case of precision parts of aerospace and automobile industries, close dimensional tolerances has to be obtained while machining so with the use of nanocoolant this risk can be reduced by carrying away the heat generated at the tool-workpiece interface. This will improve the response variables such as surface roughness, tool wear etc.
With the continuous improvement in manufacturing industry there is a need to reduce the tooling costs, which would in turn reduce the cost of the product machined. In conventional machining HSS was used as cutting tool material. Nowadays use of tungsten carbide is becoming more prominent in industries. Tungsten carbide is a type of steel. It is comprised of mainly tungsten carbide and cobalt. The cobalt acts as a binder and improves shock resistance. As the percentage of cobalt in the mix rises, so does the shock resistance. Tungsten carbide is known for its ability to retain an extremely sharp edge for an extended amount of time under certain cutting applications.
2. LITERATURE REVIEW
[1] N. K. Chavda, Jay R. Patel, Hardik H. Patel, Atul P. Parmar, (2014) carried out an experimental investigation to determine the effect of various concentration of Al2O3 nano-dispersion mixed in water as base fluid on heat transfer characteristics of double pipe heat exchanger for parallel flow and counter flow arrangement. The conclusion derived for the study is that overall heat transfer coefficient increases with increase in volume concentration of Al2O3 nano-dispersion compared to water up to volume concentration of 0.008 % and then decreases.
[2] Nithin K Mani, Prof. Cijo Mathew, Prof. Prakash M Kallanickal (2015), found that the addition of nanoparticles to vegetable oil improved the properties of workpiece material. The experiments conducted in machining found that the nanoparticle concentration & feed rate are the main factor that determines the surface finish on the EN8 steel. Based on ANOVA, 0.5 wt. % Al2O3 nanoparticle concentration is found to be the most optimum parameter obtaining minimum surface roughness. Feed rate with the level of 0.15mm/rev was found as an important factor in identifying the surface roughness.
© 2017, IRJET | Impact Factor value: 5.181 | ISO 9001:2008 Certified Journal | Page 1768
conductivity by THW technique. The result indicated 10.41%enhancement in thermal conductivity at 30oC for the nanofluids containing 0.035 volume fraction of Al2O3 and a maximum of approx. 11.25% at 80oC. For Al2O3-based nanofluids, nanoparticle of size ranges from 13–80 nm in base oil by different research groups were studied resulting in 5–40% enhancement in thermal conductivity. The temperature varied between 10oC–80oC for Al2O3-based nanofluids and reported 2.6–40.8% enhancement in thermal conductivity.
[4] Shrikant Borade. Dr. M. S. Kadam, (2016) studied and compared the effect of vegetable oil and al2o3 nanofluids used with mql on surface roughness and temperature. The surface roughness (Ra) and Temperature (T) were measured under different cutting conditions for different combinations of machining parameters. These experiments show that Surface Roughness and Temperature reduced significantly by machining EN353 steel using nanofluid (i.e. 3 Vol. % of Al2O3 Nanofluid) as compared to MQL Vegetable oil.
3. MATERIAL SPECIFICATIONS
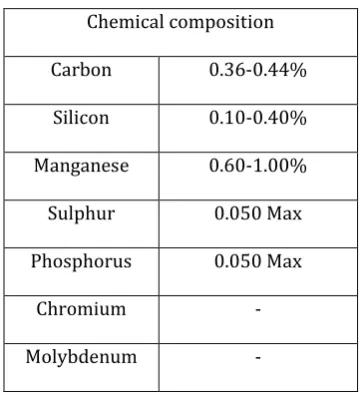
3.1 Work Material: EN8
Table -1: EN8 properties
Chemical composition
Carbon 0.36-0.44%
Silicon 0.10-0.40%
Manganese 0.60-1.00%
Sulphur 0.050 Max
Phosphorus 0.050 Max
Chromium -
Molybdenum -
[image:2.595.308.515.98.278.2]3.2 Cutting tool: Tungsten Carbide
Table -2: Tool specifications
Insert style CNMG
Insert size 432
Manufacturers grade IC907
coating TiAlN
shape Diamond
Chip breaker TF
Coating process PVD
Length (mm) 12.9
Thickness (inch) 0.1874
Included angle (degree) 80
4. EXPERIMENTS AND METHODOLOGY
The main objective of this work is to study and compare the effect of vegetable oil and nanocoolant on turning operation and to determine the optimum machining parameters of turning. The cutting parameters and nanoparticle concentration were varied to identify the best values of the response variables. The experiments were designed using Taguchi method and were performed on CNC lathe machine.
4.1 Design of Experiments
Taguchi factorial design was used to determine the machining conditions for various experiments required to be carried out for optimization of cutting parameters. It uses orthogonal arrays such as L9, L16, and L27 etc. to organize the process parameters at different levels. It is commonly used in improving industrial product quality due to the proven success. With the use of Taguchi method we can significantly reduce the number of experiments.
The experiments were designed using L9 orthogonal array on Minitab 17. A 33 Taguchi factorial design was obtained for
machining with vegetable oil. It contains 3 factors (Speed, feed and depth of cut) each at 3 different levels.
34 Taguchi factorial design was obtained for machining with
[image:2.595.34.214.427.625.2]nanocoolant. It contains 4 factors (Speed, feed, depth of cut and nanoparticle concentration) each at 3 different levels.
Table -3: Machining parameters and levels
Sr. no Factor Levels
1 2 3
© 2017, IRJET | Impact Factor value: 5.181 | ISO 9001:2008 Certified Journal | Page 1769
2 Feed
(mm/rev) 0.1 0.12 01.5
3 Depth of cut
(mm) 0.5 1 1.5
4
Nanoparticle concentration
(wt. %)
0.06 0.08 1
4.2 Methodology
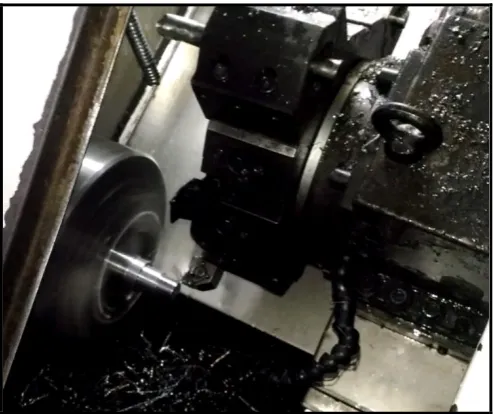
All the experiments were performed on CNC lathe machine using tungsten carbide tool inserts. First, machining using vegetable oil (High Cut 150) was carried out according to Taguchi design. Cutting temperature was recorded for each experiment using an Infrared Temperature Sensor.
Fig -1: Experimental setup
Then, machining using nanocoolant with different Al2O3 concentrations was conducted. Al2O3 nanoparticles were mixed with vegetable oil as base fluid, which increased the heat carrying capacity of vegetable oil. The experiments were conducted by varying the process parameters according to the Taguchi design and the cutting temperatures were recorded. For each experiment the response variables were to be investigated.
Surface roughness was measured using Surface Roughness Tester, tool wear was measured using Tool Maker’s Microscope and hardness was measured using Brinell Hardness Tester.
The results obtained were analyzed using ANOVA to find optimum machining parameters and nanocoolant concentration.
5. RESULT
Analysis of Taguchi design was performed using the software, Minitab 17. SN ratios were calculated for each experiment. SN ratio is the conversion of the loss function. The output characteristics contains a desirable value, termed as ‘signal’ which is the result of controllable factors and an undesirable value called ‘noise’, which is due to the uncontrollable factors. So if the effect of the uncontrollable factors is negligible then, it would give best response. The SN ratio analysis is categorized into three types that are the higher the better, nominal the better and the lower the better. The SN ratio for each experiment is calculated based on SN ratio analysis. The experiment having the highest SN ratio gives the optimum conditions of machining for that particular response. All the responses i.e. surface roughness, tool wear and cutting temperature were analyzed for SN ratios using lower the better performance characteristics.
SN ratio for lower the better:
S / N = -10log
10(
)
The response table for each response was also obtained. It gives rank to each factor which helps to determine the most significant factors that affect the process the most.
[image:3.595.36.283.321.528.2] [image:3.595.308.564.450.691.2]© 2017, IRJET | Impact Factor value: 5.181 | ISO 9001:2008 Certified Journal | Page 1770
5.1. Taguchi Analysis for machining using
Vegetable oil
[image:4.595.307.568.129.354.2]A. Cutting temperature
Table -4: SN ratio for Cutting temperature
Exp.
No (RPM) Speed
Feed (mm/ rev)
Depth of cut (mm)
Cutting Temperatur
e (oC)
SN Ratio
1 1200 0.10 0.5 29.330 -29.3462
2 1200 0.12 1.0 28.900 -29.2180
3 1200 0.15 1.5 29.600 -29.4258
4 1400 0.10 1.0 29.833 -29.4939
5 1400 0.12 1.5 29.060 -29.2659
6 1400 0.15 0.5 29.300 -29.3374
7 1600 0.10 1.5 29.330 -29.3462
8 1600 0.12 0.5 29.400 -29.3669
9 1600 0.15 1.0 29.150 -29.2928
The table 4 shows the cutting temperature measured on the EN8 steel machined surface and their corresponding signal to noise ratios. The cutting temperature varies from 28.9oC to
29.83oC. The main effects plot for S/N ratio is as shown in
figure 1.
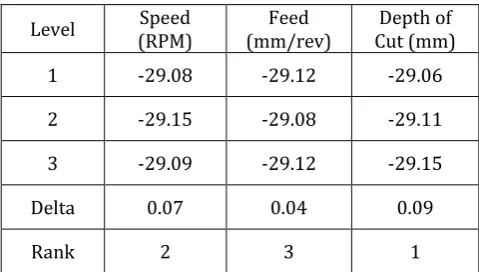
Table -5: Response Table for Cutting temperature
Table 5 is the response table of Signal to Noise ratios for cutting temperature. It can be seen that lowest cutting temperature of 28.9oC was obtained at feed (0.12 mm/rev),
speed (1200 rpm), Depth of cut (1 mm). Depth of cut is the
most influencing parameter on Cutting temperature followed by speed and feed.
Chart -1: Main effects plot for cutting temperature
Optimal machining condition for low Cutting temperature: Speed= 1400 rpm Feed= 0.15 mm/rev Depth of cut= 0.5 mm
[image:4.595.28.299.187.444.2]B. Surface roughness
Table -6: SN ratio for Surface roughness
Exp. No
Speed (RPM
)
Feed (mm/ rev)
Depth of cut (mm)
Surface Roughness
(µm) SN Ratio
1 1200 0.10 0.5 1.513 -3.59678
2 1200 0.12 1.0 2.033 -6.16275
3 1200 0.15 1.5 1.350 -2.60668
4 1400 0.10 1.0 1.630 -4.24375
5 1400 0.12 1.5 2.737 -8.74550
6 1400 0.15 0.5 1.070 -0.58768
7 1600 0.10 1.5 1.637 -4.28097
8 1600 0.12 0.5 2.837 -9.05719
9 1600 0.15 1.0 2.190 -6.80888
Level (RPM) Speed (mm/rev) Feed Cut (mm) Depth of
1 -29.08 -29.12 -29.06
2 -29.15 -29.08 -29.11
3 -29.09 -29.12 -29.15
Delta 0.07 0.04 0.09
[image:4.595.302.563.511.786.2] [image:4.595.30.270.559.695.2]© 2017, IRJET | Impact Factor value: 5.181 | ISO 9001:2008 Certified Journal | Page 1771
The surface roughness for each experiment are shown in [image:5.595.302.567.145.431.2]table 6. Surface roughness varies from 1.07 µm to2.837 µm
Table -7: Response Table for Surface roughness
It can be seen from the ranks obtained from the response table 7 that feed is the most influencing parameter for surface roughness followed by speed and depth of cut.
Chart -2: Main effects plot for Surface roughness
Optimal machining condition for surface roughness: Speed= 1200 rpm
Feed= 0.12 mm/rev Depth of cut= 1 mm
C. Tool wear
Table -8: SN ratio for Tool wear
Exp.
No (RPM) Speed (mm/rev) Feed
Depth of cut (mm)
Tool Wear
(mm) SN Ratio
1 1200 0.10 0.5 0.210 13.5556
2 1200 0.12 1.0 0.760 2.3837
3 1200 0.15 1.5 0.260 11.7005
4 1400 0.10 1.0 0.135 17.3933
5 1400 0.12 1.5 0.715 2.9139
6 1400 0.15 0.5 0.695 3.1603
7 1600 0.10 1.5 0.230 12.7654
8 1600 0.12 0.5 0.198 14.0667
9 1600 0.15 1.0 0.285 10.9031
The tool wear for each experiment are shown in table 6 and it varies from 0.135 mm to 0.760 mm.
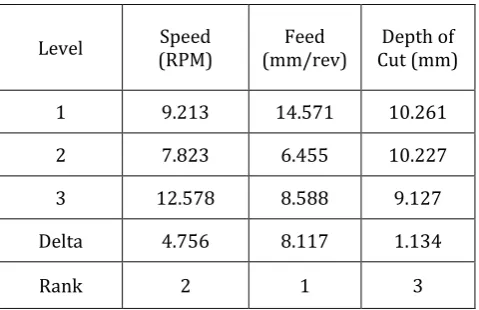
Table -9: Response Table for Tool wear
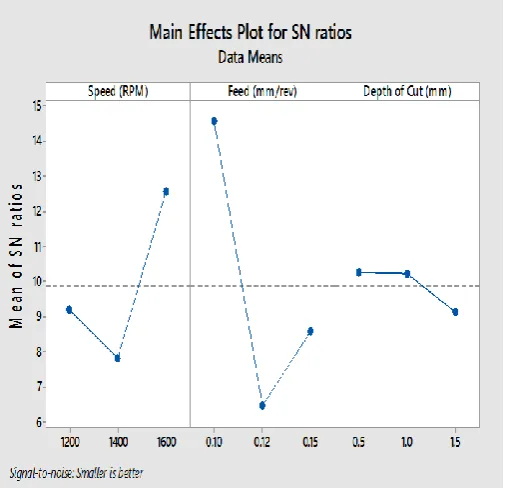
It can be seen from the ranks obtained from the response table (table 9) that feed is the most influencing parameter for tool wear followed by speed and depth of cut.
Level (RPM) Speed (mm/rev) Feed Cut (mm) Depth of
1 9.213 14.571 10.261
2 7.823 6.455 10.227
3 12.578 8.588 9.127
Delta 4.756 8.117 1.134
Rank 2 1 3
Level (RPM) Speed (mm/rev) Feed Cut (mm) Depth of
1 -4.122 -4.041 -4.414
2 -4.526 -7.988 -5.738
3 -6.716 -3.334 -5.211
Delta 2.594 4.654 1.325
[image:5.595.31.271.151.306.2] [image:5.595.38.285.367.646.2]© 2017, IRJET | Impact Factor value: 5.181 | ISO 9001:2008 Certified Journal | Page 1772
Chart -3: Main effects plot for Tool wearOptimal machining condition for tool wear: Speed= 1400 rpm
Feed= 0.1 mm/rev Depth of cut= 1 mm
5.2 Taguchi Analysis for machining using
Nanocoolant
[image:6.595.37.291.100.344.2]A. Cutting temperature
Table -10: SN ratio for Cutting temperature
Exp.
No (RPM) Speed Feed (mm/r
ev)
Depth of cut (mm)
Al2O3
concent ration (gm/litr
e)
Cutting Temperat
ure (oC)
SN Ratio
1 1200 0.10 0.5 0.6 28.4 -29.07
2 1200 0.12 1.0 0.8 28.3 -29.04
3 1200 0.15 1.5 1.0 28.6 -29.13
4 1400 0.10 1.0 1.0 28.7 -29.16
5 1400 0.12 1.5 0.6 28.8 -29.19
6 1400 0.15 0.5 0.8 28.5 -29.1
7 1600 0.10 1.5 0.8 28.6 -29.13
8 1600 0.12 0.5 1.0 28.2 -29.00
9 1600 0.15 1.0 0.6 28.6 -29.13
The table 10 shows the cutting temperature measured on the EN8 steel machined surface and their corresponding signal to noise ratios. The cutting temperature varies from 28.2oC
to 28.8oC. The main effects plot for S/N ratio is as shown in
[image:6.595.311.566.185.331.2]figure 1.
Table -11: Response Table for Cutting temperature
It can be seen from the ranks obtained from the response table that depth of cut is the most influencing parameter for cutting temperature followed by speed feed and Al2O3
concentration.
Chart -4: Main effects plot for Cutting temperature
Optimal machining condition for cutting temperature: Speed= 1600 rpm
Feed= 0.12 mm/rev Depth of cut= 0.5 mm
Al2O3 Concentration: 1 gm/litre (0.1 wt. %)
Level (RPM) Speed
Feed (mm/ rev)
Depth of Cut (mm)
Al2O3
concentration (gm/litre)
1 -29.08 -29.12 -29.06 -29.13 2 -29.15 -29.08 -29.11 -29.09 3 -29.09 -29.12 -29.15 -29.10
Delta 0.07 0.04 0.09 0.04
[image:6.595.306.570.402.674.2]© 2017, IRJET | Impact Factor value: 5.181 | ISO 9001:2008 Certified Journal | Page 1773
B. Surface roughnessTable -12: SN ratio for Surface roughness
Exp.
No (RPM) Speed Feed (mm/ rev)
Depth of cut (mm)
Al2O3
concentrati on (gm/litre)
Surface Roughnes
s (µm)
SN Ratio
1 1200 0.10 0.5 0.6 1.480 -3.406
2 1200 0.12 1.0 0.8 2.147 -6.637
3 1200 0.15 1.5 1.0 1.336 -2.516
4 1400 0.10 1.0 1.0 0.840 1.514
5 1400 0.12 1.5 0.6 0.950 0.446
6 1400 0.15 0.5 0.8 0.933 0.602
7 1600 0.10 1.5 0.8 0.900 0.915
8 1600 0.12 0.5 1.0 0.867 1.24
9 1600 0.15 1.0 0.6 1.313 -2.362
[image:7.595.22.291.145.425.2]The surface roughness and SN ratios for each experiment are shown in table 6. Surface roughness varies from 0.84 µm to 2.147 µm.
Table -13: Response Table for Surface roughness
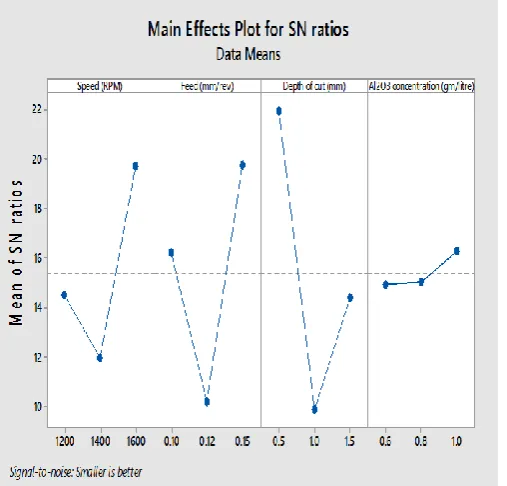
The ranks obtained from the response table show that speed is the most influencing parameter for surface roughness followed by depth of cut, Al2O3 concentration and feed.
Chart -5: Main effects plot for Surface roughness
Optimal machining condition for Surface roughness: Speed= 1400 rpm
Feed= 0.1 mm/rev Depth of cut= 1 mm
Al2O3 Concentration: 1 gm/litre (0.1 wt. %)
C. Tool wear
Table -14: SN ratio for Tool wear
Exp . No
Spee d (RPM
)
Feed (mm /rev )
Depth of cut (mm)
Al2O3
concent ration (gm/lit re)
Tool
wear SN Ratio
1 1200 0.10 0.5 0.6 0.085 21.4116
2 1200 0.12 1.0 0.8 0.675 3.4139
3 1200 0.15 1.5 1.0 0.115 18.7860
4 1400 0.10 1.0 1.0 0.390 8.1787
5 1400 0.12 1.5 0.6 0.545 5.2721
6 1400 0.15 0.5 0.8 0.075 22.4988
7 1600 0.10 1.5 0.8 0.110 19.1721
8 1600 0.12 0.5 1.0 0.080 21.9382
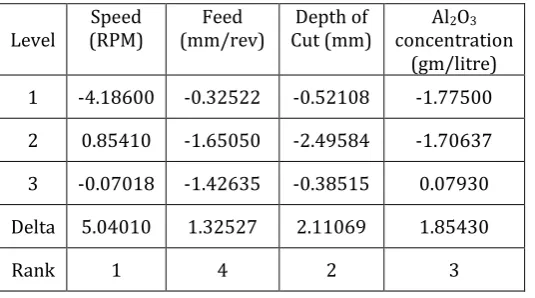
9 1600 0.15 1.0 0.6 0.125 18.0618 Level (RPM) Speed (mm/rev) Feed Cut (mm) Depth of concentration Al2O3
(gm/litre) 1 -4.18600 -0.32522 -0.52108 -1.77500
2 0.85410 -1.65050 -2.49584 -1.70637
3 -0.07018 -1.42635 -0.38515 0.07930
Delta 5.04010 1.32527 2.11069 1.85430
[image:7.595.22.290.498.647.2]© 2017, IRJET | Impact Factor value: 5.181 | ISO 9001:2008 Certified Journal | Page 1774
The tool wear for each experiment are shown in table 6 and [image:8.595.37.291.383.626.2]it varies from 0.075 mm to 0.675 mm.
Table -15: Response Table for Tool wear
The ranks obtained from the response table show that depth of cut speed is the most influencing parameter for tool wear followed by feed, speed and Al2O3 concentration.
Chart -6: Main effects plot for Tool wear
Optimal machining condition for Tool wear: Speed= 1400 rpm
Feed= 0.15 mm/rev Depth of cut= 0.5 mm
Al2O3 Concentration: 0.8 gm/litre (0.08 wt. %)
6. CONCLUSIONS
In machining operations, high amount of heat energy is developed at tool-workpiece interface which results in thermal crack. This eventually reduces the life of cutting tool and also affects the surface roughness of workpiece. Cutting fluids are introduced in machining in order to cool the tool and workpiece at their interface. Thermal conductivity plays an important role in enhancing the heat transfer performance of a base fluid (vegetable oil). Since the thermal conductivity of solid metals and metal oxides is higher than that of base fluids, the suspended particles increase the thermal conductivity and heat transfer performance of base fluid. Cutting fluids also act as lubricant and reduces the cutting forces exerted by tool on workpiece.
Feed, speed and depth of cut are the three cutting parameters selected for machining and were tested for three different levels of operation. The experiments were designed by using Taguchi Factorial Design using Minitab 17 software.
Machining was carried out using two different coolants i.e. 1. Water based vegetable oil (high cut 150)
2. Nanofluids (Al2O3 mixed with base fluid)
And their results were compared to find optimum machining parameters and Al2O3 concentration from Taguchi analysis
using signal to noise ratio.
A significant temperature drop was observed when nanocoolant was used as cutting fluid which ranged from 28.20C to 28.80C whereas with the use of vegetable oil it
ranged from 28.90C to 29.830C.
Optimal machining condition for cutting temperature: Speed= 1600 rpm
Feed= 0.12 mm/rev Depth of cut= 0.5 mm
Al2O3 Concentration: 1 gm/litre (0.1 wt. %)
Considering the surface roughness nanocoolant delivered better surface finish as compared to vegetable oil. Optimal machining condition for Surface roughness:
Speed= 1400 rpm Feed= 0.1 mm/rev Depth of cut= 1 mm
Al2O3 Concentration: 1 gm/litre (0.1 wt. %)
Nanocoolant also influences the tool wear rate. The temperatures obtained using nanocoolant shows that heat carrying capacity was increased and thus reducing the tool wear. Optimal machining condition for Tool wear:
Speed= 1400 rpm Feed= 0.15 mm/rev Depth of cut= 0.5 mm
Al2O3 Concentration: 0.8 gm/litre (0.08 wt. %)
Level (RPM) Speed (mm/rev) Feed
Depth of Cut (mm
Al2O3
concentration (gm/litre)
1 14.537 16.254 21.950 14.915
2 11.983 10.208 9.885 15.028
3 19.724 19.782 14.410 16.301 Delta 7.741 9.574 12.065 1.386
© 2017, IRJET | Impact Factor value: 5.181 | ISO 9001:2008 Certified Journal | Page 1775
REFERENCES
[1] N. K. Chavda, Jay R. Patel, Hardik H. Patel, Atul P.
Parmar, “Effect of Nanofluid on Heat Transfer Characteristics of Double Pipe Heat Exchanger: Part-I: Effect of Aluminum Oxide Nanofluid”, International Journal of Research in Engineering and Technology eISSN: 2319-1163 | pISSN: 2321-7308, 2014.M. Young, The Technical Writer’s Handbook. Mill Valley, CA: University Science, 1989.
[2] Nithin K Mani, Prof. Cijo Mathew, Prof. Prakash M
Kallanickal, “Optimization of Cutting Parameters & Nanoparticle Concentration in CNC Turning of EN8 Steel using Al2O3 Nanofluids as Coolant”, International Journal f Engineering Trends and Technology (IJETT) – Volume 29 Number 6 - November 2015.
[3] V Sridhara, Lakshmi Narayan Satapathy, “Effect of
Nanoparticles on Thermal Properties Enhancement in Different Oils – A Review”, Critical Reviews in Solid State
and Materials Sciences, 40:6, 399-424, DOI:
10.1080/10408436.2015.1068159, 2015.
[4] Shrikant Borade. Dr. M. S. Kadam, “COMPARISON OF
MAIN EFFECT OF VEGETABLE OIL AND AL2O3 NANOFLUIDS USED WITH MQL ON SURFACE ROUGHNESS AND TEMPERATURE”, International Journal of Mechanical Engineering and Technology (IJMET) Volume 7, Issue 1, Jan-Feb 2016.
BIOGRAPHIES
Phati Prabhakar Sawant, student of B.E (Mechanical Engineering) and working on project of “Experimental Investigation and Optimization of Machining Parameters for Cryogenically Treated Tool and Nanocoolant” under the guidance of prof. S. B. Khandekar.
Abhay Shivdas Naik, student of B.E (Mechanical Engineering) and working on project of “Experimental Investigation and Optimization of Machining Parameters for Cryogenically Treated Tool and Nanocoolant” under the guidance of prof. S.B. Khandekar.
Gaurav Appa Desai, student of B.E (Mechanical Engineering) and working on project of “Experimental Investigation and Optimization of Machining Parameters for Cryogenically Treated Tool and Nanocoolant” under the guidance of prof. S.B. Khandekar.
Abhijit Rambhau Bhagat, student of B.E (Mechanical Engineering) and working on project of “Experimental Investigation and Optimization of Machining Parameters for Cryogenically Treated Tool and Nanocoolant” under the guidance of prof. S.B. Khandekar.