© 2018, IRJET | Impact Factor value: 6.171 | ISO 9001:2008 Certified Journal
| Page 2016
PARAMETRIC COMPARISON STUDY ON THE PERFORMANCE OF BUILDING UNDER
LATERAL LOADS AS PER IS 875(PART3):1987 AND REVISED CODE OF IS
875(PART 3):2015
Prakash Channappagoudar
1, Vineetha Palankar
2, R. Shanthi Vengadeshwari
3, Rakesh
Hiremath
41
Senior Vice President, Shibanee and Kamal Architects, Bangalore,
2Associate Design Engineer, Shibanee and Kamal Architects, Bangalore,
3
Associate Professor, Dept. of Civil Engineering, Dayananda Sagar College of Engineering, Bangalore,
4PG Student, Dept. of Civil Engineering, Dayananda Sagar College of Engineering, Bangalore.
---***---Abstract
-The high-rise Structure construction has become a feasible solution to the issues related with the urban society. Structures built today are designed to withstand earthquakes, wind and blast loadings. These have been made possible with the advances in structural engineering and a revolution in electronic computation in the past 50 years especially in the field of Finite Element Analysis. Very tall buildings are being built due to the recent advancements in construction technology and material science. Gust Effectiveness Factor Method, which is more realistic particularly for computing the wind loads on flexible tall slender structures and tall building towers. In the recent past many tall buildings and high rise towers are being built in India. This paper deals with one such computation where a building in Pune is taken into consideration for analysis with respect to wind loads for different number of floors. Analysis is done for both codes of IS 875(Part 3):1987 and IS 875(Part 3):2015 for different parameters affecting the stability of building. This paper also includes important points of IS 16700:2017 which takes both the previous codes of Wind and Earthquake into consideration and specifies a new code of conduct for design of tall buildings ranging from 50 – 250 meters.Key Words
:
Gust Effectiveness Factor, Peak Acceleration, Stability, Tall Buildings, IS 16700:2017.1. INTRODUCTION
Structural analysis and design is an exceptionally old craftsmanship and is known to individuals since early human advancements. The Pyramids built by Egyptians around 2000 B.C. stands even today as the declaration to the abilities of engineers of that era. Planning, analysis and construction of buildings is a science by itself. The main purpose of any structure is to support the loads coming on it by properly transferring them to the foundation. Today structures are designed to withstand earthquakes, tsunamis, cyclones and blast loadings. These have been made possible with the advances in structural engineering and a revolution in electronic computation in the past 50 years. The construction material industry has also undergone a revolution in the last four decades resulting in new materials having more strength and stiffness than the traditional
construction material. The structural analysis process can be broadly classified into three main categories:
Static analysis determines internal forces and displacements due to time-independent loading conditions. Stability analysis deals with products that are subject to compressed time-independent forces. Vibration analysis determines the natural frequencies / eigenvalues and corresponding mode shapes (eigen functions) of vibration in the product. We start by simulating a geometric model of the product. This model needs to be mesh able into a correct finite element mesh. This is done in order to ensure that the CAD geometry will mesh and will provide important data like stresses, drifts, moments, time periods, displacements or temperature distribution with accepted accuracy. This explains behavior of buildings during all types of loading conditions including the wind and earthquake loads.
2. METHODOLOGY
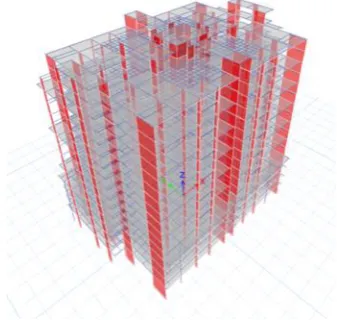
1. Modeling: Creating a model with 4 towers, including shear wall and frame structure.
a. Defining the geometry and groups
b. Defining the geometric properties and material
properties
c. Assigning supports, loading and running analysis.
2. Wind Analysis:
a. Taking the values for Fundamental Time period from
the model and calculating Wind forces of the building. b. Running the Analysis with the Input of lateral forces in both directions such that it accounts for both codes.
c. Viewing the results of reformed shape and creating a Force Vs Levels and displacement values with acceleration calculations.
3. Repeat above steps for,
© 2018, IRJET | Impact Factor value: 6.171 | ISO 9001:2008 Certified Journal
| Page 2017
4. Comparison of all the results above with respect to new code of IS-16700:2017 for acceleration.
3. MODELLING
The structure consists of Beam-Slab system (Special Moment Resisting Frame, SMRF) located in Pune, Maharastra. The building is also analyzed for the dynamic effects for 27 and 39 floors of wind since the structure is slender and the natural frequency is less than 1Hz. The analysis of structure is carried out using ETABS.
Property modifiers used for P-∆ analysis
Element Serviceability Design Strength Design
Shear Walls 1.0*Ig 0.7*Ig
Slabs 0.5*Ig 0.25*Ig
Beams 0.5*Ig 0.35*Ig
[image:2.595.322.526.74.205.2]Columns 1.0*Ig 0.7*Ig
Table 1- Property Modifiers
Materials -Concrete :
Young’s Modulus, Ec = 5000√fck N/mm2
Poisson’s Ratio, v = 0.2
Coefficient of Thermal Expansion = 0.0000055/0C
Reinforcement Bars :Reinforcement shall be high strength deformed/ TMT bars Fe500D, conforming to the relevant Indian Standards with a specified characteristic strength of
500 N/mm2 with elongation greater than 14.5%.
Standard sizes of bars generally will be 8, 10, 12, 16, 20, 25 and 32 mm.
Site specific data
Maximum Bearing Pressure: 1500 kN/m2
Allowable settlement: 10mm
The plan of the building 54 x 38m, is as per figure 1, three models as such are created for 15, 27 and 39floors for analysis of codes IS 875 (Part 3) 1987 and IS 875 (Part 3) 2015.
[image:2.595.49.277.245.351.2]Fig -1- Plan of Building
[image:2.595.366.535.254.414.2]Fig -2- Brick load example-Etabs
Fig -3- 15 Floors example-Etabs
All loads are assigned as per above table to the respective frames and floors. One such examples are shown in Figure 2 confirming XBRICK for frame.
4. DESIGN PROCEDURE
4.1 IS 875 (Part 3): 1987
Design Wind Speed
The basic wind speed shall be modified to include risk level, terrain roughness, height of the structure and local topography to get the design wind velocity Vz and is given as:
Where,
VZ= Design wind speed in m/s at any height 'z' m
Vb = Basic wind speed for various zones
k1= Probability factor (risk coefficient)
Design Wind Pressure
[image:2.595.78.221.608.721.2]© 2018, IRJET | Impact Factor value: 6.171 | ISO 9001:2008 Certified Journal
| Page 2018
Where,
Pz= Design wind pressure in N/m2 at Height z,
Vz= Design wind velocity in m/s at height z.
Wind Load
Along wind load on a structure on a strip area ( Ae ) at any height (z) is given by:
Where,
Fz = along wind load on the structure at any height z
corresponding to strip area
Cf = force coefficient for the building,
Ae = effective frontal area considered for the structure at
height z,
Pz = design pressure at height z due to hourly mean wind
obtained as 0.6 Vz2 ( N/m2 ),
G = Gust factor = ’ And is given by:
gf = peak factor defined as the ratio of expected peak value to
root mean value of a fluctuating load, and
r = roughness factor which is dependent on the size of the structure in relation to ground roughness
B = Background factor indicating a measure of slowly varying component of fluctuating wind load and is obtained by,
= measure of resonant component of fluctuating wind load, S = Size reduction factor
Peak Acceleration
The peak acceleration along the wind direction at the top of structure is given by,
Where,
x = mean deflection at the position where acceleration is required.
4.2 IS 875 (Part 3): 2015
Design Wind Speed (Vz)
Where,
Vz = design wind speed at height z, in m/s,
k1 = probability factor (risk coefficient)
k2 = terrain roughness and height factor (Refer Table 2, IS
875(Part 3) 2015)
k3 = topography factor; and
k4 = importance factor for the cyclonic region
Design Wind Pressure
The design wind pressure at any height above mean ground level shall be obtained by the following relationship between wind pressure and wind velocity:
Where,
Pz= Design wind pressure in N/m2 at Height z,
Vz= Design wind velocity in m/s at height z.
Along Wind Response
The design peak along wind base bending moment, (Ma) shall
be obtained by summing the moments resulting from design peak along wind loads acting at different heights, z, along the height of the building/ structure and can be obtained from,
where
Fz = design peak along wind load on the building/ structure
at any height z
Az = the effective frontal area of the building/ structure at
any height z, in m2
pd = design hourly mean wind pressure
corresponding to Vz,d and obtained as 0.6 Vz,d2 (N/m2)
Vz,d = design hourly wind speed at height z, in m/s
Cf,z = the drag force coefficient of the building/structure
corresponding to area Az G = Gust factor is given by
G = Where,
r = roughness factor which is twice the longitudinal turbulence intensity, Ih,i.
gv= peak factor for upwind velocity fluctuation,
= 3.0 for category 1 and 2 terrains, and = 4.0 for category 3 and 4 terrains,
Bs= background factor indicating the measure of slowly
varying component of fluctuating wind load caused by lower frequency wind speed variation
B =
Where,
bsh = average breadth of the building/structure between
© 2018, IRJET | Impact Factor value: 6.171 | ISO 9001:2008 Certified Journal
| Page 2019
Lh = measure of effective turbulence length scale at the
height, h, in m
= 85 for terrain category 1 to 3
= 70 for terrain category 4
= factor to account for the second order turbulence intensity
= Where,
Ih,i= turbulence intensity at height h in terrain category i
Hs= height factor for resonance response
=
S = size reduction factor given by:
=
Where,
bo,h= average breadth of the building/structure between 0
and h.
E = spectrum of turbulence in the approaching wind stream
=
Where,
N= effective reduced frequency
=
fa= first mode natural frequency of building/structure in along wind direction, in Hz.
Vh,d= design hourly mean wind speed at height, h in m/s
= damping coefficient of building/structure gR= peak factor for resonant response
=
Peak Acceleration
The peak acceleration at the top of the building/structure in along wind direction is given by,
Where,
x = mean deflection at the position where the acceleration is required.
Across Wind Response
This gives method for determining equivalent static wind load and base overturning moment in the across wind direction for tall enclosed buildings and towers of rectangular cross-section. Calculation of across wind response is not required for lattice towers.
The across wind design peak base bending moment Mc for enclosed buildings and towers shall be determined as follows:
Where,
gh= apeak factor in cross wind direction;
ph= hourly mean wind pressure at height h, in Pa;
b = the breadth of structure normal to the wind, in m; h = the height of the structure, in m;
k = a mode shape power exponent for representation of fundamental mode shape
Peak Acceleration in Across Wind Direction
The peak acceleration at top of building in across-wind direction (y in m/s2) with approximately constant mass per unit height shall be,
Where,
Cfs = across wind force spectrum coefficient generalized for a
linear mode.
β = damping coefficient of the building/structure
m0 = the average mass per unit height of the structure in, kg/m.
Combination of Along Wind and Across Wind Load Effects The along wind and across wind loads have to be applied simultaneously on the building/structure during design.
4.3 REVISION DETAILS
1. Individual terrain aerodynamic roughness heights for categories have been included, and are used to derive turbulence intensity and mean hourly wind speed profiles.
2. The structures previous classifications into B & C Classes have been deleted and accordingly the modification factor, K2 is renamed as terrain roughness and height factor.
3. The values of K2 factor corresponding to previous class A type structures, are kept in structure.
4. An additional modification factor, termed as importance factor has been included for cyclonic regions. So the static pressures in the coastal regions of the country calculated by the new code IS 875(Part 3):2015 are more compared to the IS 875(Part 3):1987. This is because of the effect of the importance factor, but the basis of this factor is not mentioned in the new code.
© 2018, IRJET | Impact Factor value: 6.171 | ISO 9001:2008 Certified Journal
| Page 2020
5. Simple empirical expressions have been suggested for height variations of hourly mean wind speed and also turbulence intensity in different terrains.
6. Peak acceleration limits have been mentioned in new code IS 16700:2017, which was not defined in earlier codes.
5
. ANALYSIS AND RESULTS
Lateral Forces
Comparison of Lateral Forces for Dynamic Analysis for Wind code of 1987 and 2015 for 27floors.
Along Wind Wind Response.
Chart -1: Levels Vs Lateral force Along graph
Across Wind Response
Chart -2: Levels Vs Lateral force Across graph
Similar results are seen in Y-Direction for 27 Floors and 39Floors.
Displacement
Displacement for Dynamic Analysis for Wind code of 1987 and 2015 for 27 floors.
Table 2- Comparison of displacement for 27 floors
Displacement for Dynamic Analysis for Wind code of 1987 and 2015 for 39 floors.
Codes X-Direction (m) Y-Direction (m)
IS:875 (Part3) 1987 0.1401 0.2046
[image:5.595.44.279.259.417.2]IS:875 (Part3) 2015 0.1131 0.1580
Table 3- Comparison of displacement for 39 floors
Time Period
Floors X-Direction (Hz) Y-Direction (Hz)
27 Floors 5.96 5.53
[image:5.595.321.546.418.520.2]39 Floors 7.33 6.49
Table 4- Comparison of time period
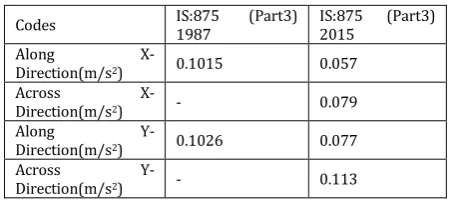
Acceleration
Acceleration for Dynamic Analysis for Wind code of 1987 and 2015 for 27 floors.
Table 5- Comparison of acceleration for 27floors
Acceleration for Dynamic Analysis for Wind code of 1987 and 2015 for 39 floors.
Table 6- Comparison of acceleration for 39floors
Base Reactions
Base Reactions for Dynamic Analysis for Wind code of 1987 and 2015 for 27 floors.
Codes X-Direction (m) Y-Direction (m)
IS:875 (Part3) 1987 0.0641 0.0732
IS:875 (Part3) 2015 0.0477 0.0650
Codes IS:875 1987 (Part3) IS:875 2015 (Part3)
Along
X-Direction(m/s2) 0.1015 0.057
Across
X-Direction(m/s2) - 0.079
Along
Y-Direction(m/s2) 0.1026 0.077
Across
Y-Direction(m/s2) - 0.113
Codes IS:875 1987 (Part3) IS:875 2015 (Part3)
Along
X-Direction(m/s2) 0.1302 0.088
Across
X-Direction(m/s2) - 0.0876
Along
Y-Direction(m/s2) 0.2213 0.133
Across
[image:5.595.43.279.443.611.2]© 2018, IRJET | Impact Factor value: 6.171 | ISO 9001:2008 Certified Journal
| Page 2021
Load Pattern Codes Fx (kN) Fy (kN)
XWINDX
IS:875 (Part3)
1987 6711.7 -
IS:875 (Part3)
2015 5013.4 1291.58
XWINDY
IS:875 (Part3)
1987 - 8955.6
IS:875 (Part3)
[image:6.595.34.294.250.339.2]2015 1845.71 7669.06
Table 7- Comparison of base reaction for 27floors
Base Reactions for Dynamic Analysis for Wind code of 1987 and 2015 for 39 floors.
Load Pattern Codes Fx (kN) Fy (kN)
XWINDX
IS:875 (Part3)
1987 9584.5 -
IS:875 (Part3)
2015 7497.86 1924.98
XWINDY
IS:875 (Part3)
1987 - 15299.3
IS:875 (Part3)
2015 2762.14 11399.23
Table 8- Comparison of base reaction for 39floors
6. CONCLUSION
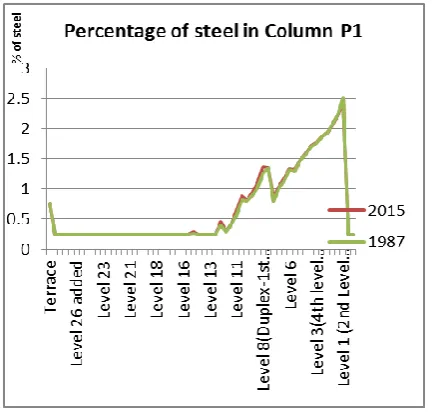
1. Lateral Forces- Comparison of Lateral Forces for Dynamic Analysis for Wind code of 1987 and 2015 for 27floors and 39floors shows that the lateral forces in the along direction has reduced in code IS:875(Part 3)2015 when compared to earlier code, but when we inspect the steel required in the columns under consideration, it is observed that steel requirement in IS:875(Part 3)2015 is higher compared to IS:875(Part 3)1987 as shown,
Chart -3: Comparison of Steel in Pier P1
So it can be concluded that the combined effect of lateral forces acting along and across the wind direction is higher, hence giving a higher requirement of steel.
2. Displacement is reduced in both models of IS:875(Part 3)2015 when compared to IS:875(Part 3)1987, as the lateral forces have reduced in the IS:875(Part 3)2015.Lesser lateral forces less will be the displacement, increasing the stiffness of the structure.
3. Time period increases as there is increase in height of the structure for 27 floors and 39 floors.
4.Acceleration is dependent on the displacement which is again dependent on the lateral forces that are reflecting onto the system. In the code of IS:875(Part 3)1987, lateral forces are higher making the system more flexible increasing the acceleration of the building under consideration. Attracting less forces to the columns. But these acceleration has to be limited to certain value such as the human is perceptible to that certain limit at that height of the building. Earlier codes had no clear definition and limit regarding this peak acceleration whereas IS:16700 2017 code “Criteria for Tall Buildings” limits the value of this peak acceleration to 0.15m/s2 for residential buildings. Hence here on the
buildings that are to be constructed, should have a peak acceleration limited to 0.15m/s2.
5. Base Reaction study in the code IS:875(Part 3)1987 should be less than that of code IS:875(Part 3)2015, because higher lateral forces attract higher displacement and acceleration which in turn reduces forces attracted to the columns reducing the base shear. But because the new code IS:875(Part 3)2015 gives forces in two directions, and base reaction in two directions the reduction in base reaction is seen in the results.
In conclusion, IS:875(Part 3)2015 gives a realistic approach to the analysis of lateral forces as it considers both the directions for the calculations.
ACKNOWLEDGEMENT
We would like to thank Shibanee and Kamal Architects for continuous support and guidance in completing the research and project.
REFERENCES
[1] Bodhisattva H. and P. N. Godbole “An explanatory hand
book on proposed IS-875(part3) wind loads on buildings and structures”.
[2] Dr. B. Dean Kumar and Dr. B.L.P Swami (2012) “Critical
[image:6.595.54.275.502.708.2]© 2018, IRJET | Impact Factor value: 6.171 | ISO 9001:2008 Certified Journal
| Page 2022
[3] Dr. B. Dean Kumar and Dr. B.L.P. Swami (2010) “Wind
effects on tall building frames-influence of dynamic parameters” Indian Journal of Science and Technology, Vol. 3 No. 5, ISSN: 0974- 6846
[4] Finley A. Charney(1990) “Wind Drift Serviceability Limit State Design Of Multistory Buildings” Journal of Wind Engineering and Industrial Aerodynamics, Elseveir Science Publishers B.V, 36, 203-212
[5] IS 456:2000, Indian Standard Code of Practice for Plain and Reinforced Concrete, Bureau of Indian Standards, New Delhi.
[6] IS 875 (Part 3) :1987 Indian Standard Code of Practice
for Design loads (Other than Earthquake) For Buildings and Structures, Bureau of Indian Standards, New Delhi.
[7] IS 875 (Part 3) :2015 Indian Standard Code of Practice
for Design loads (Other than Earthquake) For Buildings and Structures, Bureau of Indian Standards, New Delhi.
[8] IS 16700 :2017, Indian Standard Criteria for Structural Safety of Tall Concrete Buildings, Bureau of Indian Standards, New Delhi.
[9] IS 875 (Part 3): 1987, A Commentary on Indian Standard
Code of practice for Design loads (other than earthquake) For buildings and structures Part 3 Wind Loads (Second Revision).
[10] J. Zhou & G.B. Bu and K.N. Li (2012) “Calculation Methods for Inter-Story Drifts of Building Structures” 15th World Conference on Earthquake Engineering, Lisbon, 2012
[11] Morteza A. M. Torkamani(1985) “Dynamic Response Of
Tall Building To Wind Excitation” Journal of Structural Engineering, 111:805-825.
[12] Narla Mohan and A.Mounika Vardhan (2017) “Analysis
Of G+20 Rc Building In Different Zones Using Etabs” International journal of Professinal Engineering Studies,Vol.-8 Issue-3, 179-192.
[13] Prof. M. R. Wakchaure, Sayali Gawali (2015) “Effects of Shape on Wind Forces of High Rise Buildings Using Gust Factor Approach” International Journal of Science, Engineering and Technology Research , Vol.- 4, Issue 8, ISSN: 2278 – 7798.
[14] Ranjitha K. P, Khalid Nayaz Khan, Dr. N.S. Kumar and
Syed Ahamed Raza (2014) “Effect of Wind Pressure on R.C Tall Buildings using Gust Factor Method” International Journal of Engineering Research & Technology, Vol. 3 Issue 7, ISSN: 2278-0181
[15] Suraj Nayak U and Dr. Ananthayya M.B (2016) “Effect of Static and Dynamic Wind Forces on RC Tall Structures at different Height, in different Zones and in different
Terrain Category using Gust Factor Method As Per Is: 875 (Part 3) 1987”, International Journal Of Modern Engineering Research, Vol.-6 Issue-3, ISSN: 2249-6645.