Munich Personal RePEc Archive
Production Efficiency in Peasant
Agriculture: An Application of LISREL
Model
Mariam, Yohannes and Eisemon, Thomas and Coffin, Garth
12 April 1993
Production Efficiency in Peasant Agriculture: An Application of LISREL Model
Yohannes Kebede (also known Yohannes Mariam) 1/, Thomas O. Eisemon2/, Garth Coffin3/
1/
Washington Utilities and Transportation Commission, Olympia, WA, 2/, Formerly with the World Bank, Washington, D.C., 3/ Formerly Associate Professor and Associate Dean, Faculty of
Agricultural and Environmental Sciences, McGill University
Abstract
The study examined a simplified conceptual model which incorporates variables that influence the processes and consequences of household decision-making in the Ada and Selale districts of the Ethiopian highlands. Linear structural relations (LISREL) analysis was performed on three conceptual models.
1
Production Efficiency in Peasant Agriculture: An Application of LISREL Model
Introduction
African, Asian and Latin American countries have been striving to produce adequate food for
the poor. Several strategies, spanning from agri-led development, export-led growth to induced
innovation have been implemented since the 1950's. Recently, "sustainable development", was
adopted by policy makers as a feasible paradigm. Whether this paradigm is attainable is to be
seen. In the mean time, agriculture had to develop to produce adequate food and generate
income that would be channeled to other sectors of the economy.1
Agricultural development in major LDCs is constrained by scarcity of resources.
Introduction of "appropriate" agricultural technologies that would not alter skills and
management styles of peasants, and keep income differentials among farmers to the minimum is
viewed as viable strategy. Examples of such kind of technologies include cross-bred cows that
are intended to increase the productivity of local livestock breed.
The objectives of increasing food production, in light of limited financial and physical
resources, can be attained by focusing on regions that can produce greater output with little
investment. Furthermore, intervention strategies should identify geographic regions where the
majority of the poor live.
Several studies have argued that if Ethiopia is to use its agricultural potential for
development, the focal geographic or altitude zones should be the highlands (Getahun, 1978,
1 This statement should not be interpreted to imply unbalanced growth as a feasible strategy.
1980; Sisay, 1980; Belay, 1977). The highlands offer diverse production techniques and
opportunities for development (Getahun, 1978; Sisay, 1980). Possible methods of increasing
food production include increases in area cultivated, productivity of land and other resources.
The first possibility is difficult to achieve in the highlands because of high density of livestock
and human population, and landscape that requires huge investment to be harnessed. Thus, if
development is to benefit the majority of the Ethiopian poor, emphasis should be given to
increasing the productivity of land and other resources while conserving those which are
over-utilized.
Three crop and one livestock production technologies were introduced in two regions of
the Central highlands of Ethiopia. The present study examines the feasibility of these
intervention strategies by focusing on selected factors that impinge on the processes of
decision-making and their consequences or outcomes.
The Problem
Households make decisions to achieve various goals including production, consumption,
and reproduction, among others.2 Various micro and macro variables influence household
decision-making and the consequences thereof. Similar set of micro and macro variables
influence the design of development policies. Examination of the processes and consequences of
household decision-making that include all macro and micro variables is a complex task.
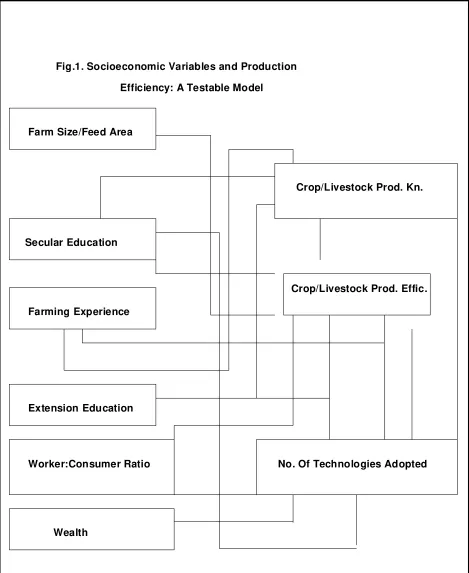
A simple, yet realistic, framework for the conceptual definition of the problem
investigated in this study is given in Figure 1 (see also Kebede, 1993). The conceptual
2 Caution should be exercised against taking a dogmatic definition of goals because, for
3
framework is broadly divided into two parts. The first part deals with variables shaping the
processes that lead to actual decision-making. The second part examines the quantitative
outcome of decisions. Previous studies of decision-making at the household level have
concentrated either on the first (e.g., Webb, 1988), or the second part (e.g., Ellis, 1988). The
factors involved in the linkages between the two parts have not been examined in detail.
The conceptual model indicates that there are three types of variables. The first set
includes exogenous variables such as crop and grazing area, education, experience, labour, oxen,
feed, number of cows, seed and wealth. The second set includes endogenous variables such as
the number of technologies adopted and production knowledge.3 The third type of variable, an
outcome of the first and the second sets of variables, measures production efficiency. Models
that incorporate these three types of variables to study household decision-making in agriculture
are few.
The present study hypothesizes that the impact of inputs on the efficiency with which
output is produced would be greater among farmers who have adopted technologies which rank
high in their list of strategies (e.g., fertilizer and pesticides) to secure subsistence requirement
regardless of the conditions for technological optimality. Furthermore, this study investigates the
impact of a single or selected combinations of technologies on production efficiency. Evidence
3 In this context, exogenous variables refer to factors that, given the structure of the model,
Secular Education
Farming Experience
Extension Education
Worker:Consumer Ratio
Wealth
Crop/Livestock Prod. Kn.
No. Of Technologies Adopted Farm Size/Feed Area
[image:7.612.73.542.86.659.2]Crop/Livestock Prod. Effic. Fig.1. Socioeconomic Variables and Production
5
on these and related questions help to formulate "appropriate" agricultural policies and research
programs in crop and livestock production that may help to attain increases in food production.
The Study Sites
The research was carried out over a period of 17 months in 1990-1991. The research sites
are Selale and Ada districts of the central Ethiopian highlands. These two sites have similar
farming systems and belong to the high potential cereal-livestock zone ( Kebede, 1993;
FINNIDA,1989).
Selale is representative of the high altitude zone (more than 2000 meters above sea level)
of the country. The major crops grown in Selale include oats, teff, barley, wheat, horse beans
and field peas. The average farm size is 3.1 hectares, 30% of which is used as permanent pasture
or grazing land with the rest cultivated. The average livestock holding is 3.5 cows, 1.8 oxen, 0.55
bulls, 1.8 young animals and 2.96 calves (FINNIDA, 1989). Farmers have extensive experience
in livestock production and the region has greater potential for increasing productivity of this
enterprise than the Ada region.
Ada is characterized by mild weather and represents the country's large middle-altitude
cropping zone (1500 to 2000 meters). The major crops grown include teff, wheat, barley, horse
beans, chickpeas and field peas. The average farm size is 2.6 hectares. There is virtually no
fallow land. The average livestock holding is 1.28 cows, 1.98 oxen, 0.50 bulls, 0.53 young
animals and 0.84 calves (Gryseels and Anderson, 1983). Compared with the Selale region, Ada
farmers specialize more in crop than in livestock production. Farmers in this region have
extensive experience in crop production. Selected socio-economic characteristics of farmers in
Test for significant differences between socioeconomic profiles suggest that the two
regions exhibit statistically significant differences with respect to the: I) number of household
members who are independent, ii) number of years of education, iii) number of years of
farming experience an independent farmer, iv) number of livestock owned, vi) average income
received from the sale of grain, livestock and fuel wood, vii) crop and grazing area, viii) amount
of milk produced per household, and ix) amount of grain produced (Table 1). 4
Ada farmers had more years of schooling and more years of farming experience. They
gain most of their income from the sale of grain while that of Selale farmers from livestock and
livestock products. The productivity of dairy cows (litres/month) is higher among Selale farmers
while Ada farmers produce greater crop yields per hectare.
Design of the Study
Several crop production technologies are introduced in the study sites since the 1960's.
However, introduction of cross-bred cows took place not only recently but also implemented by
different agencies with relatively different approaches to technological introduction.
Furthermore, this research was conducted to provide information on the socioeconomic
feasibility of cross-bred cows. Therefore, it was felt appropriate to compare farmers who have
adopted cross-bred cows (test) and those who did not (Control). These farmers may have adopted
any combination of crop-production augmenting technologies.
4 Household members who are capable of working without supervision are categorized as
7
Table 1: Selected Characteristics of Selale and AdaFarmers
Selale Ada
N Average N Average F-Value Prob>F1/
No. of Household Members who are: Dependent 173 4.47 41 4.29 0.412 0.469
Independent 207 1.75 48 1.5 4.52 0.03*
Education of Household Head (yrs) 55 2.5 23 3.6 5.671 0.001*
Experience (years): Dependent 176 11.24 50 13.44 0.044 0.83
Independent 176 24.58 50 27.88 4.173 0.04**
Income (Ethiopian birr) from Sale of: Grain 203 230.27 49 828.6 65.46 0.006*
Livestock &
Livestock Products 194 451.4 22 203.11 1.09 0.058**
Fuel wood 169 343.58 31 63.97 13.84 0.004*
Expenses (Ethiopian birr) for Purchase of food 214 268.2 50 228.14 2.366 0.125
Clothing 205 114.49 39 106.09 0.309 0.579
Milk production (in liters) per
Month: Local cows 193 56.9 35 42.6 6.79 0.05**
Cross-bred cows 66 320.35 14 186.29 5.76 0.011*
Area under (hectares) Crop 217 2.5 52 2.3 19.56 0.001*
Grazing 208 0.8 37 0.2 26.29 0.006*
Livestock Number 165 10.89 16 5.18 0.69 0.016*
Crop Production ('00kg) 217 14.88 52 21.41 2.98 0.05**
Households which received cross-bred cows and were selected for this study in the Ada
and Selale areas numbered 26 and 89 respectively.5 A confidence level of 95%, coefficient of
variation of crop and milk yields of 96 percent and precision level of ± 20% resulted in a sample
size of 89 farmers for the Selale region. For the Ada region, however, time and financial
resources limit the number of test farmers to only 26. Comparison of average values of
socioeconomic variables derived from a district-wide survey by the Ministry of Agriculture and
average values of similar socioeconomic characteristics calculated from test farmers showed that
the two data set are approximately the same. Therefore, the small sample size for the Ada region
will not bias the foregoing analysis.
After determining the sample size, the need to use farmers who joined various programs
as test groups necessitated the use of systematic selection of the control group.6 A method was
designed such that all test farmers were compared with farmers who exhibit similar
socioeconomic characteristics (control farmers) but were different in ownership of cows (for
details see Kebede,1993).
The control farmers were to have a comparable number of oxen, cows, sheep/goat, family
size, age (farming experience), education, annual farm income and farm size (crop and grazing)
5
Prior to selection of the control group, the sample size was determined according to the following procedure. The sample size (N) is given as: N= (KV)2/D2 , where D is the largest acceptable difference (in percent) between the estimated sample and the true population
parameters. K is a measure of confidence ( in terms of the number of deviations from mean) with which it can stated that the result lies within the range represented by plus or minus D and V is the coefficient of variation of yields.
6
9
with the test farmers. Moreover, the two groups had to exhibit similar ethnic, climatic and
geographical characteristics. To accomplish this task, a three-step procedure was followed.
Firstly, a group of farmers involving political leaders and elders in each peasant association were
asked questions such as, "With whom do you think farmer "A" compares with respect to income,
livestock holdings, living standard, etc., except that he does not own cross-bred cows?".7
Secondly, each test farmer was asked questions such as, "To whom do you think you are
comparable with respect to income, livestock holding, family size, etc., except that you own
cross-bred cows and the other farmer does not?". This method of identify a control farmer is
difficult and socially controversial.8 Nevertheless, it would provide a clue to identifying control
farmers.
Thirdly, 150 farmers who did not receive cross bred cows were interviewed with respect
to the above socioeconomic characteristics. The results were compared with background
socioeconomic data obtained from test farmers. Combination of the above three steps enabled
identification of control farmers that were used in the present study.
Selale farmers were instructed that inputs necessary for the management of cross-bred
cows were available in their locality, and that they should take full responsibility for the
management of such cows. Farmers in the Ada area, however, joined the ILCA technology
diffusion program voluntarily because it provided a relatively risk-free environment (e.g.,
7
A peasant association is a geopolitically delimited association of peasants covering an area of about 400 hectares. Political leaders are farmers who, through democratic election processes, were elected to take administrative positions within a peasant association.
8
subsidized cost of feed). The approach to diffusion of technologies in the Selale region,
therefore, is different from that implemented in Ada area. Comparative analysis of the two sites
is hypothesized to reveal significant differences in the impact of socioeconomic variables on
adoption of agricultural technologies and the resulting efficiency of production.
The Theoretical Model
Structural equation models have been used in several areas of the social and behaviourial
sciences (Joreskog and Sorbom, 1989). A structural equation model can be used to examine a
phenomenon in terms of cause-effect variables and their indicators. Equations in this model
represent a causal link and estimates of structural parameters may not coincide with the
coefficients obtained from ordinary regression analysis. Structural parameters represent a
relatively "accurate" features of the mechanism that generates the observed variables (Joreskog
and Sorbom, 1989). Moreover, the linear structural relations model is designed to overcome
problems associated with measurement errors and causal relationships.
The LISREL model chosen in this study is used to examine linear causal relationship
(path analysis) between independent (exogenous) and dependent (endogenous) variables.
Consider random vectors η = (η1, ...ηm) and ζ = (ζ1,...ζn) of latent dependent and independent
variables, respectively. The linear structural equation can be specified as :
η = βη + Γζ + έ ... (1)
where η and ζ are vectors of latent dependent and independent variables, β (mxm) and Γ (mxn)
are coefficient matrices and έ (έ1, ....έm) is a random vector of residuals. The elements of β
11
direct effects of ζ variables on η-variables.
Vectors η and ζ are not observed, but instead vectors Y' (y1, ....Yp) and X' (x1, ... xn) are
observed, such that
Y = Ωyη + u ... (2)
X = Ωxζ + δ ... (3)
where u and δ are vectors of uncorrelated error terms (errors of measurement between sets but
may be correlated within sets). These equations represent the multivariate regressions of y on η
and of x on ζ, respectively.
The full LISREL model is defined by the following three equations:
Structural Equation Model: η=βη +Γζ + έ ... (4) Measurement Model for Y : Y=Ωyη + u ... (5)
Measurement Model for X : X=Ωxζ + δ ... (6)
These equations assumes that ζ and έ,η and u, ζ and δ are uncorrelated, έ, u and δ are mutually
uncorrelated and that β has zeros is the diagonal and I-β is non-singular ( Joreskog and Sorbom,
1989).
Identification and estimation of parameters of structural equation models depends on
forms of β and Γ. Three forms of ϐ can be distinguished: diagonal matrix, triangular and
unrestricted elements above and below the diagonal (Joreskog and Sorbom, 1989).
The data set from Ada and Selale regions in Ethiopia contains only observed variables
and assumed zero measurement error. Thus, the LISREL model can be formulated as:
Y= βy + Γx + έ ... (7)
This is a structural equation model or a path analysis for directly observed variables. The y's are
accounted for by the x-variables. The x-variables may be random variables or a set of fixed
values. The parameter matrices involved in this model are β, Γ and Φ =cov(έ). A special case of
this model is that when β is sub-diagonal and Φ is diagonal, the structural equation for observed
variables model is called a recursive system or path analysis. Path analysis involves two kinds of
variables: independent or cause variables x1,x2,... xn, and dependent or effect variables y1,y2,..yp.
Models of this type and estimation techniques in econometrics can be found in Theil (1971) and
Goldberger (1971).
Estimation of path analysis for directly observed variables using LISREL can be carried
out using a system of equations to estimate all structural parameters directly. The structural
equations include: specification of the data type (raw, covariance, correlation), the model (the
number of x and y variables, and the form of the matrices of data) and an output statement (for
the details see, Joreskog, et al. 1989).
Specification of all kinds of relationships between x's, x's and y's, and between y's for all
conceivable variables may result in a lack of convergence even with increases in the number of
iterations (Joreskog, et al. 1989; Saris, et al. 1984; Hayduk, 1987). In the study of Ada and
Selale farmers, based on regression analysis and prior results from group discussions, x-variables
whose effect on the y's are relatively low are excluded from the analysis. Two types of models
are estimated. One with five and three, and another with six and three exogenous and
13
Description of Variables
The exogenous variables include wealth (in Ethiopian birr), worker:consumer ratio,
farming experience (years), number of days a farmer receive training or information from
extension agents, number of years of secular education and farm or feed area (hectares). The
endogenous variables include livestock or crop production knowledge, number of technologies
adopted and relative production efficiency. Analysis is performed by region, and within a region
by control and test groups.
Wealth is defined as the market value of grain, milk and its byproducts, and live animals.
The worker:consumer ratio is taken as the ratio of the number of household members capable of
working without supervision ( age 15-60) to members who require supervision ( age <15 and
>60). Measures of production efficiency scores were computed from stochastic frontier
production function analysis (Kebede, 1993).
There is no hard and fast rule to measure or quantify production knowledge. Studies in
cognitive psychology have demonstrated the usefulness of measuring knowledge using problem
solving tests or comprehension ability (see Eisemon, 1988;Bransford and McCarrel, 1983).
Problem solving tests were constructed to measure agricultural knowledge and skills
related to current production technologies and practices. The tests were intended to examine the
kinds of solutions households provide to crop and livestock production problems. Answers from
problem solving tests were scored to compare variations in knowledge of farmers within and
between regions. The basis for scoring were answers obtained from group discussions with
farmers of different age-groups. The premise behind this basis for scoring was that experience
solutions to actual problems of farming in the study regions. A score of 1 to 10 was prepared and
individual farmers responses were ranked relative to the answers given by the group ( see
Kebede, 1993).
Empirical Results
The LISREL model was formulated for a large number of variables. However, it was not
possible to attain statistical convergence. The estimates were not statistically acceptable, as
indicated by large values of standard errors and beta coefficients, negative degrees of freedom
and very high chi-square values (see Joreskog and Sorbom, 1989).
The influence of social networks and macro-integrating forces (e.g., markets, schools and
institutions) is reflected in differential access to physical resources and knowledge, changes in
economic and social status. It appears reasonable to include these and other socio-economic
variables in the LISREL model. The difficulty of testing the LISREL model with all variables
that influence the processes and consequences of household decision-making necessitated
choosing variables that satisfy specific criteria. Variables included in the LISREL model are
those that: I) are essential to the production of both grain and livestock (e.g., land, feed area and
worker:consumer ratio); ii) influence management style or human capital; and iii) reflect
influences from differential access to resources and institutions (e.g., wealth).
Three LISREL models are analyzed. Model I includes exogenous variables such as farm
size, secular education, farming experience, extension education and worker:consumer ratios,
and endogenous variables such as crop production knowledge, number of technologies adopted
15
and control farmers. Model II is specified similarly to Model I except that wealth (as a proxy that
reflect the influence of factors that determine access to resources such as grazing and crop area)
is added to the analysis. Model III presents results from LISREL analysis with variables similar
to those in Model II but for Ada and Selale regions without categorizing farmers into test and
control groups.
Results from Model I
The results of the analysis of causal relationships between exogenous and endogenous
variables for test and control farmers of the Ada region are presented in Figures 2a and b. The
results indicate that endogenous variables (e.g., production knowledge, number of technologies
adopted and crop production efficiency) are positively influenced by most exogenous variables.9
Production knowledge, farming experience and extension education exert relatively larger
impacts on the number of technologies adopted and crop production efficiency of test compared
to control farmers. The chi-square values of the model is smaller, that is the probability of
obtaining a higher chi-square value is very low. It means that this is the best model to represent
the conceptual framework depicted by Figure 1.
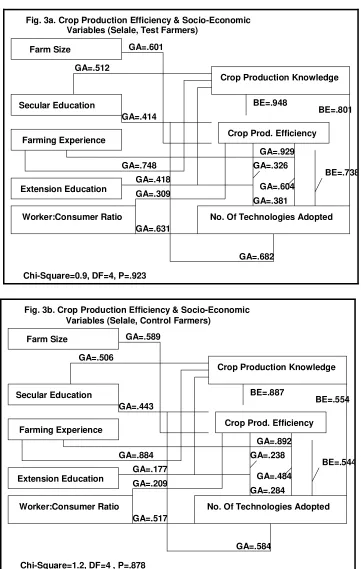
LISREL analysis similar to that of Figures 2a and b for the Selale region is presented in
Figures 3a and b. The results show that the number of technologies adopted, farm size,
9
Secular Education
Farming Experience
Extension Education
Worker:Consumer Ratio
Crop Production Knowledge
No. Of Technologies Adopted Farm Size
[image:19.612.73.435.83.646.2]Crop Prod. Efficiency Fig. 2a. Crop Production Efficiency & Socio-Economic
BE=.924 BE=.651 BE=.981 GA=.794 GA=.603 GA=.812 GA=.801 GA=.907 GA=.224 GA=.269 GA=.406 GA=.751 GA=.579 GA=.717 GA=.569
Chi-Square=1.0, DF=4 , P=.909
Variables (Ada, Test Farmers) Variables (Ada, Test Farmers)
Secular Education
Farming Experience
Extension Education
Worker:Labour Ratio
Crop Production Knowledge
No. Of Technologies Adopted Farm Size
Crop Prod. Efficiency Fig. 2b. Crop Production Efficiency & Socio-Economic
Variables (Ada, Control Farmers)
BE=.724 BE=.591 BE=.992 GA=.784 GA=.521 GA=.892 GA=.633 GA=.807 GA=.171 GA=.149 GA=.244 GA=.728 GA=.581 GA=.617 GA=.561
17
Secular Education
Farming Experience
Extension Education
Worker:Consumer Ratio
Crop Production Knowledge
No. Of Technologies Adopted Farm Size
[image:20.612.72.433.77.646.2]Crop Prod. Efficiency Fig. 3a. Crop Production Efficiency & Socio-Economic
Variables (Selale, Test Farmers)
BE=.801 BE=.738 BE=.948 GA=.682 GA=.414 GA=.748 GA=.604 GA=.929 GA=.418 GA=.381 GA=.326 GA=.601 GA=.309 GA=.631 GA=.512
Chi-Square=0.9, DF=4, P=.923
Secular Education
Farming Experience
Extension Education
Worker:Consumer Ratio
Crop Production Knowledge
No. Of Technologies Adopted Farm Size
Crop Prod. Efficiency Fig. 3b. Crop Production Efficiency & Socio-Economic
Variables (Selale, Control Farmers)
BE=.554 BE=.544 BE=.887 GA=.584 GA=.443 GA=.884 GA=.484 GA=.892 GA=.177 GA=.284 GA=.238 GA=.589 GA=.209 GA=.517 GA=.506
production knowledge, experience, extension education, and worker:consumer ratio exert larger
and positive influences on crop production efficiency of test compared to control farmers.
Worker:consumer ratio, extension education, production knowledge, and experience greatly
influence the number of technologies adopted by test compared to control farmers of the Selale
region. Comparison of Figures 2a and b, and 3a and b indicates that relatively more variables
exert greater influences on adoption decisions and production efficiency of test compared to
control farmers. Moreover, comparison of test and control farmers indicate that differences in the
impact of crop production knowledge and number of technologies adopted on production
efficiency are minimal among farmers in the Ada than Selale region.
Farm size is the most important single input for both crop and livestock production. The
average farm size is fixed according to family size. Households are given user rights to land
(Kebede, 1993). The absence of ownership right has reduced the incentive of households to
invest in land. In spite of this uncertainty, the contribution of land to crop production efficiency
is high. The impacts of land and worker:consumer ratio are relatively higher among test
compared to control farmers in both study sites.
One of the most important factors shaping the structure, function and decision-making
processes of households is experiential knowledge. This knowledge is both a social and an
individual product (see Kebede, 1993). The statistical result suggest that secular education and
experience contribute significantly to crop production knowledge compared to extension
19
The contributions of secular education and experience to decisions regarding adoption of
innovations and on crop production efficiency are consistently larger than other variables.
Human capital, comprised of components such as vocational training, experience and skills from
secular or sacred education, influences the capacity of economic agents to adjust to changes in
the environment. Land-specific experience is an important factor affecting efficiency, where
physical differences between parcels of plots are substantial. Location-specific experience
influences the choice of farm adjustment mechanisms. If the contents of educational curricula is
held constant, farmers with land, enterprise, and location-specific experience will have an extra
advantage in adjusting to changes facing agriculture (Ekanayake and Jayasuriya, 1989). As the
results of this study suggest, crop production knowledge exerts significantly larger influences on
crop production efficiency in the Ada compared to Selale region. In a similar vein, the effect of
livestock production knowledge on milk production efficiency is higher among Selale producers
than those in Ada.
The effect of extension education is not as great as that of secular education or
production knowledge. Becker (1990) argues that because weak adoption of yield-increasing
technologies is explained by different opportunity costs for the labour-time spent by family
members, special extension programmes for family members with low off-farm employment
opportunities are required to increase adoption of innovations. In the Ada and Selale regions,
households have limited off-farm activities for self-employment. Thus, strengthening extension
education to help producers understand innovations and to encourage investment in
income-generating activities such as gardening and craft production may contribute to greater success in
Several studies have demonstrated that, with increases in the number of consuming units
within a household (low worker:consumer ratio), not only does production decline but also the
probability of adoption of innovations may decrease (Feder, et al., 1985; Molnar and Clonts,
1983; Barlett, 1980). Conversely, with increases in the worker:consumer ratio, not only does the
probability of adoption of innovations but also the efficiency with which they are used may
increase. The results from Ada and Selale regions suggest that there may be a relatively
moderate effect of the worker:consumer ratio on the number of technologies adopted and
efficiency scores. If all the variables are grouped into physical (land and labour), skill (extension
education, secular education, production knowledge and experience), and technologies, the
combined effect of physical factors on production efficiency is less than skill or knowledge
variables and technologies. The impact of variables on production efficiency, in ascending order,
can be summarized as: physical factors, technologies and knowledge variables.
The conceptual framework for milk production efficiency for the test and control farmers
of the Ada region are presented in Figures 4a and b respectively. The results indicate that feed
area and worker:consumer ratio exert larger influences on milk production efficiency. Secular
education and the worker:consumer ratio greatly influence decisions to adopt cross-bred cows
among test compared to control farmers of the Ada region.
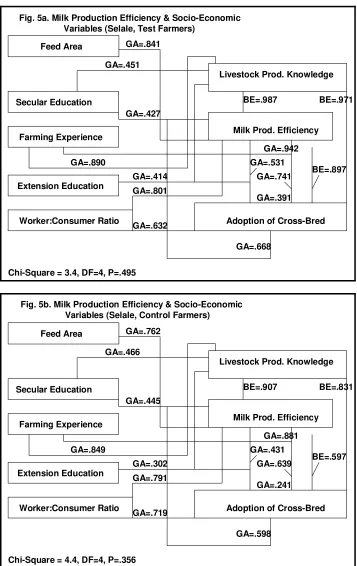
The results of LISREL analysis for causal relationship shown in Figures 4a and b for the
Selale region are presented in Figures 5a and b. The results indicate that adoption of cross-bred
21
Secular Education
Farming Experience
[image:24.612.72.430.79.644.2]Extension Education
Fig. 4a. Milk Production Efficiency & Socio-Economic Variables (Ada, Test Farmers)
Feed Area
Worker:Consumer Ratio
Livestock Prod. Knowledge
Milk Prod. Efficiency
Adoption of Cross-Bred GA=.623 GA=.482 GA=.425 GA=.731 GA=.691 GA=.908 GA=.391 GA=.461 GA=.304 GA=.621 GA=.237 GA=.615 BE=.681 BE=.637 BE=.776
Chi-Square = 0.8, DF=4, P=.939
Secular Education
Farming Experience
Extension Education
Fig. 4b. Milk Production Efficiency & Socio-Economic Variables (Ada, Control Farmers)
Feed Area
Worker:Consumer Ratio
Livestock Prod. Knowledge
Milk Prod. Efficiency
Adoption of Cross-Bred GA=.504 GA=.401 GA=.477 GA=.571 GA=.551 GA=.901 GA=.374 GA=.466 GA=.291 GA=.501 GA=.363 GA=.538 BE=.521 BE=.487 BE=.773
Secular Education
Farming Experience
[image:25.612.72.429.80.646.2]Extension Education
Fig. 5a. Milk Production Efficiency & Socio-Economic Variables (Selale, Test Farmers)
Feed Area
Worker:Consumer Ratio
Livestock Prod. Knowledge
Milk Prod. Efficiency
Adoption of Cross-Bred GA=.841 GA=.451 GA=.427 GA=.890 GA=.741 GA=.942 GA=.414 GA=.391 GA=.531 GA=.632 GA=.801 GA=.668 BE=.971 BE=.897 BE=.987
Chi-Square = 3.4, DF=4, P=.495
Secular Education
Farming Experience
Extension Education
Fig. 5b. Milk Production Efficiency & Socio-Economic Variables (Selale, Control Farmers)
Feed Area
Worker:Consumer Ratio
Livestock Prod. Knowledge
Milk Prod. Efficiency
Adoption of Cross-Bred GA=.762 GA=.466 GA=.445 GA=.849 GA=.639 GA=.881 GA=.302 GA=.241 GA=.431 GA=.719 GA=.791 GA=.598 BE=.831 BE=.597 BE=.907
23
control farmers. Extension education, secular education and production knowledge exert larger
influences on decisions regarding adoption of cross-bred cows.
Differences in the models of crop and livestock production efficiency can be seen with
respect to pre-conditions or "modernization" conditions and the resource potentials of the two
study sites. Technology transfer with the help of extension agents can produce positive results
(Feder, et al. 1985). This study argues that in fact it is only when modernization conditions (for
example milk collection centres, access to high demand centres, veterinary and artificial
insemination or bull services for milk production technology) are combined with adequate
resource base (e.g., abundant source of feed) that extension services contribute to increases in
milk production efficiency. For example, Ada is located near urban centres and marketing
services. However, there is neither adequate grazing area nor cheaper ways of obtaining feed for
milking cows. Selale, on the other hand, is located close to milk collection centres, has adequate
sources of feed supply and is lcoated relatively close to high milk demand centres. Thus, the
impact of extension education on adoption of cross-bred cows and milk production efficiency is
small in the Ada compared to Selale region.
Feed area exerts a larger influence on the milk production efficiency of Selale compared
to Ada farmers. On the other hand, the contribution of farm size on crop production efficiency is
larger among Ada compared to Selale farmers.
Previous findings in the study of household decision-making argued that households try
to avoid drudgery associated with activities which do not remunerate labour (Durrenberger,
1984; Barlett, 1980). For example, rearing cross-bred cows may not be a profitable venture for
service and processing of milk into butter. The price of fresh milk is low. The amount of butter
produced per litre of fresh milk from cross-bred cows is small compared to milk obtained from
local cows. Thus, labour used in feeding, caring and processing milk of cross-bred cows may not
be remunerated adequately. This factor, ceteris paribus, may also be the reason for smaller
contribution of labour to milk production efficiency. The results from Figures 4a & b, and
Figures 5a & b show that the worker:consumer ratio contributes less than skill variables, such as
experience and production knowledge, and physical factors, such as grazing area, to milk
production efficiency.
Results from Model II
The second model involves the same set of exogenous and endogenous variables as the
first model except that wealth is included (Kebede, 1993). The magnitude and direction of the
contribution of knowledge variables (secular education, farming experience, production
knowledge and extension education) for model II closely approximate results obtained from
model I. With the exception of the impact of production knowledge, the effect of most
exogenous variables is less than the values of the estimates obtained in the first model.
The magnitude of the impact of wealth on decisions to adopt technologies is consistently
larger than the effect of other variables. This finding confirms the hypothesis that households
which are wealthy will adopt innovations more readily than those who are not. Wealthy farmers
25
and marketing knowledge. Thus, they tend to be early adopters (Mason and Halter, 1980;
Becker, 1990).10 Regarding milk production model, the results compared to those presented in
model I.
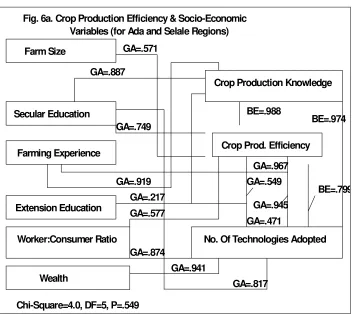
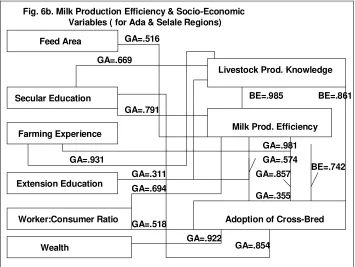
Results from Model III
LISREL analyses for crop and livestock enterprises by region are presented in Figures 6a
and b. The results of the crop production model suggest that production knowledge, experience,
wealth and secular education exert larger influences on adoption decisions. Experience and
secular education strongly influence production knowledge. Crop production efficiency is
largely determined by production knowledge, experience and secular education. The outcomes
from the milk production model indicate that wealth, experience, and production knowledge
greatly influence decisions to adopt cross-bred cows. The impacts of production knowledge,
secular education and experience on milk production efficiency are greater than that of other
variables.
The results of model III consolidate the findings from models I and II. The impacts of
farm and feed size are lesser, while those of education, experience, production knowledge and
walth are greater in model III compared to those obtained in models I and II. The probability of
obtaining a chi-square value larger than what is found from this model is very low. The signs and
magnitude of impacts of the estimates are acceptable. Thus, model III has performed quite well
compared to models I and II.
10
Secular Education
Farming Experience
Extension Education
Worker:Consumer Ratio
Wealth
Crop Production Knowledge
No. Of Technologies Adopted Farm Size
[image:29.612.73.426.79.393.2]Crop Prod. Efficiency Fig. 6a. Crop Production Efficiency & Socio-Economic
Variables (for Ada and Selale Regions)
BE=.974
BE=.799 BE=.988
GA=.817 GA=.749
GA=.919
GA=.945 GA=.967
GA=.217
GA=.471 GA=.549
GA=.941 GA=.571
GA=.577
GA=.874 GA=.887
Chi-Square=4.0, DF=5, P=.549
27
Secular Education
Farming Experience
Extension Education
[image:30.612.72.427.85.352.2]Wealth
Fig. 6b. Milk Production Efficiency & Socio-Economic Variables ( for Ada & Selale Regions)
Feed Area
Worker:Consumer Ratio
Livestock Prod. Knowledge
Milk Prod. Efficiency
Adoption of Cross-Bred GA=.516
GA=.669
GA=.791
GA=.931
GA=.857 GA=.981
GA=.311
GA=.355 GA=.574
GA=.518 GA=.694
GA=.922
GA=.854
BE=.861
BE=.742 BE=.985
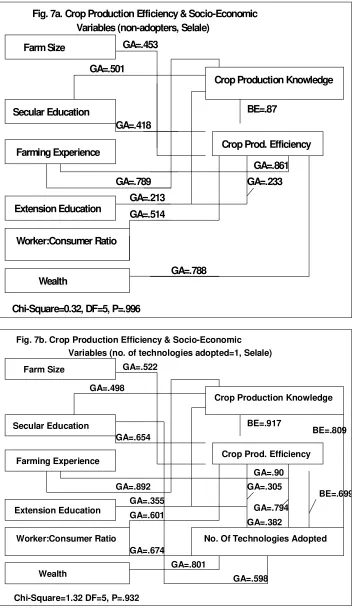
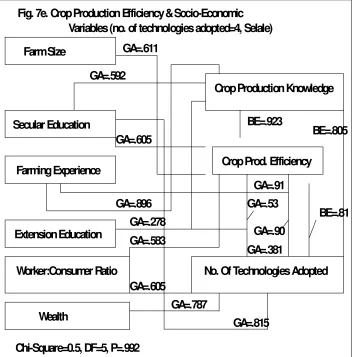
Adoption of Mixes of Technologies and Production Efficiency
Households make strategic decisions in the adoption of selected mixes of new
technologies. The manner in which they combine different innovations influences the efficiency
of production see Kebede, 1993).
A comprehensive examination of the effect of inputs on production efficiency among
households who have adopted various mixes of innovation can be obtained from LISREL
analysis. LISREL analysis was conducted for crop and milk production efficiency in both study
sites. Specifically, analysis was performed for farmers who have not adopted new technologies,
for those who have adopted one, two, three and four technologies. For the purpose of exposition
only findings from crop production models for the Selale region are presented ( see Figures
7a,7b,7c,7d and 7e). The results for crop and milk production model of Ada and milk production
model for the Selale region can be found in Kebede (1993).
The findings of LISREL analysis indicated that the impact of inputs on the efficiency
with which crops or milk are produced is higher when producers adopt at least two technologies.
That is, producer who have adopted two or more innovations exhibit higher production
efficiency compared to those who adopted none or a single technology. This corresponds to the
gradient approach to technological innovation (see also Kebede, 1993).
Summary
The conceptual framework examined in this study incorporates variables that influence
the processes and consequences of household decision-making. It includes the most important
29 Secular Education Farming Experience Extension Education Worker:Consumer Ratio Wealth
Crop Production Knowledge Farm Size
[image:32.612.74.430.84.692.2]Crop Prod. Efficiency Fig. 7a. Crop Production Efficiency & Socio-Economic
Variables (non-adopters, Selale)
BE=.87 GA=.418 GA=.789 GA=.861 GA=.213 GA=.233 GA=.788 GA=.453 GA=.514 GA=.501
Chi-Square=0.32, DF=5, P=.996
Secular Education
Farming Experience
Extension Education
Worker:Consumer Ratio
Wealth
Crop Production Knowledge
No. Of Technologies Adopted Farm Size
Crop Prod. Efficiency Fig. 7b. Crop Production Efficiency & Socio-Economic
Variables (no. of technologies adopted=1, Selale)
BE=.809 BE=.699 BE=.917 GA=.598 GA=.654 GA=.892 GA=.794 GA=.90 GA=.355 GA=.382 GA=.305 GA=.801 GA=.522 GA=.601 GA=.674 GA=.498
Secular Education
Farming Experience
Extension Education
Worker:Consumer Ratio
Wealth
Crop Production Knowledge
No. Of Technologies Adopted Farm Size
[image:33.612.72.430.101.667.2]Crop Prod. Efficiency Fig. 7c. Crop Production Efficiency & Socio-Economic
Variables (no. of technologies adopted=2, Selale)
BE=.821 BE=.736 BE=.896 GA=.693 GA=.585 GA=.941 GA=.794 GA=.909 GA=.197 GA=.278 GA=.355 GA=.892 GA=.673 GA=.577 GA=.624 GA=.594
Chi-Square=3.15 DF=5, P=.689
Secular Education
Farming Experience
Extension Education
Worker:Consumer Ratio
Wealth
Crop Production Knowledge
No. Of Technologies Adopted Farm Size
Crop Prod. Efficiency Fig. 7d. Crop Production Efficiency & Socio-Economic
Variables (no. of technologies adopted=3, Selale)
BE=.817 BE=.793 BE=.881 GA=.699 GA=.522 GA=.894 GA=.725 GA=.858 GA=.196 GA=.472 GA=.483 GA=.831 GA=.653 GA=.453 GA=.566 GA=.691
31
Secular Education
Farming Experience
Extension Education
Worker:Consumer Ratio
Wealth
Crop Production Knowledge
No. Of Technologies Adopted Farm Size
[image:34.612.74.427.193.550.2]Crop Prod. Efficiency Fig. 7e. Crop Production Efficiency & Socio-Economic
Variables (no. of technologies adopted=4, Selale)
BE=.805
BE=.81 BE=.923
GA=.815 GA=.605
GA=.896
GA=.90 GA=.91
GA=.278
GA=.381 GA=.53
GA=.787 GA=.611
GA=.583
GA=.605 GA=.592
between physical and non-physical resources such as institutions and markets (e.g. wealth and
technology adoption), and measures of production efficiency.
The conceptual framework investigated by this study is found to be satisfactory in
explaining the causal linkages between socioeconomic variables in the production efficiency
models. The results from the LISREL analysis suggest that variables that are related to cognitive
ability or skills of households make the largest contribution to crop and milk production
efficiency compared to physical factors such as land. The contribution of variables to production
efficiency can be summarized in the following descending order: skill variables (experience,
production knowledge and secular education), technologies adopted, physical factors, and
extension education. Furthermore, the analysis indicated that the impact of inputs on production
efficiency is higher when producers adopt one or two technologies in the Selale region and two
or more technologies in Ada region. This implies that, as opposed to the recommendation of
package approach to technological introduction, selective mixes of technologies contribute to
increases in production efficiency.
One of the problem faced by development projects in LDCs is to identify, given the
scarcity financial and skill resources, aspects of households that should be targeted to ensure
increases in food production. The findings of this study indicate that the processes and
consequences of production decision-making can be greatly influenced if intervention strategies
33
References
Barlett, P.F. (1980). Cost benefit Analysis: A test of Alternative Methodologies, P.F.Barlett (ed), Agricultural Decision Making: Anthropological Contribution to Rural Development. New York: Academic Press,137-160.
Becker, H. (1990). Labour Input Decision of Subsistence Farm Households in Southern Malawi. J. of Agricultural Economics. 40:162-171.
Belay, H.S. (1977). Problems, Practices and Strategies for Rural Development in Ethiopia. Debrezeit Agricultural Experiment Station. Addis Ababa University.
Bransford, J.D. and McCarrel, N.S. (1983). A Sketch of a Cognitive Approach to
Comprehension: Some thoughts about understanding what it means to comprehend. In P.N. Johnson-Laird and P.C. Wason (ed). 1983. Thinking: Readings in Cognitive Science.New York:Cambridge University Press, 377-399.
Durrenberger, E.P. (1984). Chayanov, Peasants and Economic Anthropology (ed). New York:Academic Press, Inc.
Ekanayake, S.A.B., and Jayasuriya, S.K. Change (1989). Adjustment and the Role of Specific Experience: Evidence From Sri Lankan Rice Farming. Australian J. of Agricultural Econmics. 33(2): 123-135.
Ellis, F. (1988). Peasant Economics: Farm Households and Agrarian Development. Cambridge: Cambridge University Press.
Feder, G.R., Just, R.E. and Zilberman, D. (1985). Adoption of agricultural innovations in developing countries: A survey. Econ. Dev. and Cult. Change. 33:255-98.
FINNIDA (1989). Base Line Survey: Selale Dairy Development Pilot Project. Unpublished Report.
Getahun, A. (1978) Agricultural Systems in Ethiopia. Agricultural Systems. 3:281-293.
Getahun, A. (1980). Agro-Climates and Agricultural Systems in Ethiopia. Agricultural Systems. 5:39-50.
Goldberger, A.S. and Duncan, O.D. (1973). Structural Equation Models in the Social Sciences (eds). New York: Seminar Press.
Hayduk, L.A. (1987). Structural Equation Modelling with LISREL: Essentials and Advances. Baltimore: John Hopkins University Press.
Joreskog, K.G. (1981). Analysis of Covariance Structures. Scandinavian J. of Statistics. 8:65-92.
Joreskog, K.G. and Sorbom, D. (1979). Advances in Factor Analysis and Structural Equation Models. Cambridge: Abt Books.
Joreskog, K.G. and Sorbom, D. (1989). LISREL 7. A Guide to the Program and Applications. Chicago:SPSS Inc..
Kebede, Y. (1993). The Micro-Economics of Household Decision-making; The case of Adoption of Agricultural Technologies in Ethiopia. Unpublished Ph.D. Dissertation, Departments of Agricultural Economics and Anthropology, McGill University, Montreal, Canada.
Kebede, Y., Gunjal, K. and Coffin, G. (1990). Risk and Adoption of Agricultural Technologies in Ethiopia. Agricultural Economics 4:27-43.
Longo, R.M.Juliano (1990). Information Transfer and the Adoption of Agricultural innovations. J. of the American Society for Information Science. 41(1):1-9.
Mason, R. and Halter, A.N. (1980). Risk Attitude and the Forced Discontinuance of Agricultural Practices. Rural Sociology. 45(3):435-447.
Molnar, J.J., and Clonts, H.A. (1983). Transferring Food Production Technology to Developing Nations: Economic and Social Dimensions, (eds). Colorado: West View Press.
Sarris, W.E. (1984). Causal Modelling in Non-Experimental Research: An Introduction to the LISREL Approach. Amsterdam: Sociometrics Research Foundation.
Sisay, S. (1980). Agricultural Systems in Ethiopia: A Review Article. Agricultural Systems. 5(1):29-30.
Theil, H. (1971). Principles of Econometrics. New York: Wiley.