Impact of BO and SO on Beacon-Enabled IEEE 802.15.4
Gaurav Sharma
M.Tech Student, SHIATS, Allahabad
Rajeev Paulus
Assistant. Prof., ECE Deptt. SSET, SHIATS,
Allahabad
A K Jaiswal
Prof. & Head (ECE) SSET, SHIATS
Vaishali Sahu
M.Tech Student, MNNIT, Allahabad
ABSTRACT
Today in every field wireless technology is used, for as Medical, Factory Automation, Search, Rescue, etc,. IEEE 802.11 is an option but infrastructure cost is too high, so the option is IEEE 802.15.4, especially Low-Rate Wireless Personal Area Network (LR-WPAN). The low rate WPANs is intended to serve a set of industrial, residential and medical applications with very low power consumption and cost and with relaxed needs for data rate and QoS. The low data rate enables the LR-WPAN to consume very little power. The applications are Integrated Medical Systems, Automatic Traffic Control, Energy Conservation, and many more. In this paper, the impact of Beacon order (BO) and Superframe order (SO) on beacon-enabled IEEE 802.15.4 is analyzed. The QoS parameters which are of concern are throughput, packet loss rate, average end-to-end delay and energy consumption.
Keywords
WPAN, Beacon Order, Superframe Order, QoS, LR-WPAN, and Beacon-enabled IEEE 802.15.4.
1.
INTRODUCTION
Nowadays, in each and every field, wireless networks are being deployed very fast. IEEE 802.11 comes to the mind for the first instance, but this architecture is too costly for a small enterprises. The option is IEEE 802.15 that is Wireless Personal Network (WPAN). The focus of WPAN was low-cost, low power, short range and very small size. IEEE 802.15 working group was formed to make WPAN standards. The concern group has currently standardized three classes of WPAN that are differentiated on the basis of data rate, energy consumption and QoS. The three defined classes of IEEE 802.15 are Bluetooth (IEEE 802.15.1), WPAN (IEEE 802.15.3) and LR-WPAN (IEEE 802.15.4). The IEEE 802.15.3 supports high data rate and is suitable for multimedia applications that requires very high QoS. Bluetooth supports medium data rate and is intended to serve applications like voice communication. It can allow a network to be formed at instant. The last is LR-WPAN which supports low data rate and is intended to serve a set of industrial, residential and medical applications with very low power consumption and relaxed needs for data rate and QoS. The low data rate enables the LR-WPAN to consume very little power. The applications for IEEE 802.15.4 or LR-WPAN are Assisted Living, Integrated Medical System, Safe & efficient transportation, Automated traffic control, Advance automotive system, Autonomous search & rescue, Energy Conservation, Factory automation, Environmental control, Home automation, and so many. The LR-WPAN or IEEE 802.15.4 is described in detail in next sections. In this paper, Beacon Order (BO) and Superframe Order (SO) are varied to analyze the effect on QoS parameters. These parameters are throughput, delay,
packet loss rate, and energy consumption. The paper is divided into six sections. Section 1 includes introduction, LR-WPAN is discussed in Section 2. Section 3 discuses the related works in the concern field. Simulation setup is included in Section 4. Results and discussion is specified in Section 4, section 5 gives the acknowledgement and section 6 is all about conclusion.
2.
OVERVIEW OF LR-WPAN
Table 1
PHY (MH
z)
Freque ncy Band (MHz)
Spreading Parameters
Data Parameters
Chip Rate (kchi p/s)
Modula tion
Bit Rat e (kb ps)
Symbol Rate (ksymb ol/s)
Symbo ls
868/9 15
868-868.6
300 BPSK 20 20 Binary
902-928
600 BPSK 40 40 Binary
2450 2400-2483.5
2000 O-QPSK
250 62.5 16-ary orthog
onal
IEEE 802.15.4 MAC layer protocol is CSMA/CA [2, 3]. Other specific features for the MAC layer are generating network beacons (in beacon enabled mode), association & disassociation of devices, and handling & maintaining GTS mechanism. For LR-WPAN its mechanism is divided into Slotted CSMA and Unslotted CSMA [4, 6]. Slotted CSMA is for beacon enabled mode and Unslotted CSMA if for beaconless mode [5]. In nonbeacon-enabled mode all nodes can send their data by using an unslotted CSMA/CA mechanism, which does not provide any time guarantees to deliver data frames [7]. In a beacon-enabled mode, a PAN coordinator periodically generates beacon frames and slots are provided for data transmission. Non beacon-enable mode is achieved by setting the value of BO to 15. Beacon enabled IEEE 802.15.4 is completely defined by a structure called Superframe Structure [1, 7]. This structure consists of two periods, one is active and other is inactive period. The active period consists of three parts, a beacon, a Contention access period (CAP), and a Contention free period (CFP). The superframe structure is depicted in Fig. 1 [7]. The beacon is transmitted by the PAN coordinator at slot 0. After the completion of beacon CAP will start using CSMA/CA algorithm [2, 3]. In this period sources can contend for the medium. At the end CFP start, which does not use CSMA/CA, rather it includes Guaranteed Time Slots for the sources to transmit. PAN coordinator assigns the time slots to specific sources or senders for specific applications such as low latency or application requires specific data rate [7]. Inactive period is assigned for power conservation. When RFDs and FFDs do not have transmission, these devices can go to sleep mode to preserve energy. Superframe structure is defined by two parameters SO and BO. Both parameters range between 0 and 14. BO is used to calculate the length of superframe duration or Beacon Interval (BI), and SO is used for calculating Active duration (Superframe duration-SD). BO and SO are also used to define Duty Cycle [7]. Mathematically it is written as;
[image:2.595.48.290.75.280.2]
More details for IEEE 802.15.4 or Slotted CSMA/CA can be found in [1, 7].
Fig. 1 Superframe Structure [7]
3.
RELATED WORK
IEEE 802.15.4 was emerged in 2003, and since then there have been many researches to analyze the performance of the concern WPAN. Some of these researches focused on beacon-enabled mode and some other focused on beaconless mode. Latre et al. [6] analyzed throughput, delay and BW efficiency for a number of Scenarios in LR-WPAN under beaconless mode. Liang et al. [8] analyzed the performance of IEEE 802.15.4 for ECG monitoring system. In [8] number of nodes were varied from 10 to 20 along with payload size and observed the parameters as PDR, Delay. Salles et al. [9] analyzed contention schemes as, GTS and CSMA/CA with polling cycle duration was taken as observation, and it was remarked that it increases with number of data bytes sent and maximum for GTS and minimum for CSMA/CA unslotted. Rohm et al. [10] analyzed the Star topology for MAC layer in beaconless mode with different packet sizes, apart from that, they changed the BE. Wang et al. [3] investigated the performance of slotted and unslotted CSMA/CA for MAC layer using OPNET tool. Jung et al. [11] proposed a Markov Chain Model for slotted CSMA/CA and designed their own simulator and shown some fruitful results when compared to normal slotted CSMA/CA. Burrati et al. [2] proposed a mathematical model for beacon-enable mode MAC protocol, validated through simulation results and summarized that model is a useful tool for the design of MAC parameters and to select the better topology. In [12], Chen et al. analyzed the performance of beacon-enabled IEEE 802.15.4 for industrial applications in a star network in OMNeT++. In [13] Li et al. analyzed the applicability of IEEE 802.15.4 over a wireless body area network by measuring its performance. In [15], Liu et al. studied the feasibility of adapting IEEE 802.15.4 protocol for aerospace wireless sensor networks. Chen et al. [15] modified IEEE 802.15.4 protocol for real-time applications in industrial automation, after analyzing the IEEE 802.15.4 standard in a simulation environment. Mehta et al. [16] proposed an analytical model to understand and characterize the performance of GTS traffic in IEEE 802.15.4 networks for emergency response. In [17], Zen et al. analyzed the performance of IEEE 802.15.4 to evaluate the suitability of the protocol in mobile sensor networking. In [7], Xia et al. analyzed the performance of IEEE802.15.4 for both beaconless and beacon-enabled CSMA/CA by making variation in MAC parameters using OMNeT ++ tool.
4.
SIMULATION SETUP
parameters which are varied are BO and SO. Apart from these variations, packet generation rate is also varied. The network routing protocol used is AODV. Simulation time is set to be 500 seconds. The energy model is taken as Mica Z and the battery model which is used is Duracell AA. Other MAC parameters are taken as default values. The simulation set up description is shown in Table 2.
After obtaining the simulation results QoS parameters as Packet loss rate, Average end-to-end delay, throughput, and energy consumption are analyzed.
4.1 Packet loss rate
It is the fraction of number of packets dropped by the network to the total number of packets generated by all the devices in the network. It is the measure of reliability for a particular protocol and network used.
4.2 Throughput
It is defined as the information in bits which is received successfully by the destination in an average time. Its unit is bps.
4.3 End-to-End delay
Itis the time elapsed when a packet is sent from the source node and is successfully received by the destination node. It includes delays as delay for route discovery, propagation time, data transfer time, and intermediate queuing delays.
4.4 Energy Consumption
In the scenario, energy consumption is measure in mWh for three modes, as transmit, receive and idle.
TABLE
2
Parameter Value
Simulation time 500 seconds Channel frequency 2.4 GHz
MAC protocol MAC802.15.4
Physical layer Radio-type PHY802.15.4
Packet size 70 bytes
Transport layer protocol UDP BO (variation) 1, 2, 3, 4, 5 SO (variation) 1, 2, 3, 4, 5
Application CBR
BO (default) 5
SO (default) 1
Packet generation interval (PGI) in seconds
1, 0.5, 0.1, 0.05, 0.01
Energy Model Mica Z
Battery Model Duracell AA
5.
RESULTS AND DISCUSSION
5.1 Beacon Order is varied and Superframe Order is fixed.
[image:3.595.326.538.83.214.2]In fig. 2, throughput is shown against Beacon order (BO), for this case SO is set to 1. As BO is decreased throughput is observed to be increased. This is due to the fact that the lower value of BO results in higher duty cycle, and can achieve higher bandwidth, which makes the throughput better. Higher Packet Generation Interval (PGI) means lesser number of packets per second is sent in to the network, here for lesser PGI, higher throughput is observed and as PGI is increased throughput gets low. This is due to the fact that when larger number of packets is sent, higher throughput is obtained since more bits per second are transferred.
Fig. 2 Throughput vs BO
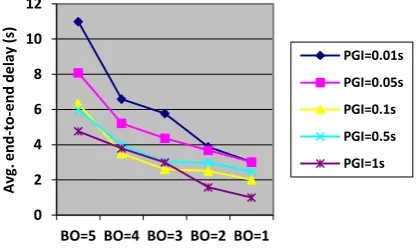
[image:3.595.329.538.365.490.2]In fig. 3, Average end-to-end delay is shown against BO; higher delays are observed for larger values of BO with the same packet generation interval. The reason is that a larger BO causes a longer inactive period, which may cause the buffered packets to experience a longer sleeping delay. As BO decreases delay gets lower, due to larger duty cycle. Smaller value of PGI, involves lesser number of sent packets and obviously lesser delay will encountered then. Smaller PGI means increased number of packets sent per second and this cause more collision and retransmission and higher delays will be seen.
Fig. 3 Avg. End-to-end delay vs BO
[image:3.595.328.538.613.743.2]In fig. 4, Packet loss rate is shown against BO; it is shown that a lesser BO leads to a smaller packet loss rate. This is because of the fact that, the smaller BO resulting in high duty cycle and make the network to transmit more packets successful. When the PGI increases, the packet loss rate decreases. The reason for the result is defined as a smaller packet generation interval means a higher number of packets to be transmitted and as a result of collisions, packets loss ratio increases.
Fig. 4 PLR vs BO
0 20000 40000 60000 80000 100000 120000 140000
Throug
hput
(bps
) PGI=0.01s
PGI=0.05s PGI=0.1s PGI=0.5s PGI=1s
0 2 4 6 8 10 12
BO=5 BO=4 BO=3 BO=2 BO=1
A
vg
. e
nd
-to
-e
nd
de
lay
(s
)
PGI=0.01s PGI=0.05s PGI=0.1s PGI=0.5s PGI=1s
0 0.2 0.4 0.6 0.8 1 1.2
BO=5 BO=4 BO=3 BO=2 BO=1
P
ack
e
t
Los
s
R
at
e PGI=0.01s
In fig. 5 Energy in three modes (transmit, receive and idle) is plotted against BO. As BO is decreased, energy consumption in transmit and receive mode is increasing while in idle mode energy consumption is decreasing with decrease in BO. The fact can be defined as with decrease in BO, duty cycle increases and reduces the idle period, due to which more time is devoted for transmission and reception while idle time is decreased, that is why energy consumed is more for lesser BO in active cases and it is less for lower BO in idle case.
Fig. 5 Energy vs BO
5.2 Superframe Order is varied and Beacon Order is fixed.
[image:4.595.60.280.174.338.2]In fig. 6, throughput is shown against Superframe order (SO), for this case BO is set to 5. As SO is increased throughput is observed to be increased. This is due to the fact that the higher value of SO results in higher duty cycle, and can achieve higher bandwidth, which makes the throughput better. Higher Packet Generation Interval (PGI) means lesser number of packets per second is sent in to the network, here for lesser PGI, higher throughput is observed and as PGI is increased throughput gets low. This is due to the fact that when larger number of packets is sent, higher throughput is obtained since more bits per second are transferred.
Fig. 6 Throughput vs SO
In fig. 7, Average end-to-end delay is shown against SO; higher delays are observed for smaller values of SO with the same packet generation interval. The reason is that a smaller SO causes a longer inactive period, which may cause the buffered packets to experience a longer sleeping delay. As SO increases delay gets lower, due to larger duty cycle. Smaller value of PGI, involves lesser number of sent packets and obviously lesser delay will encountered then. Smaller PGI means increased number of packets sent per second and this cause more collision and retransmission and higher delays will be seen.
Fig. 7 Average End-to-end delay vs SO
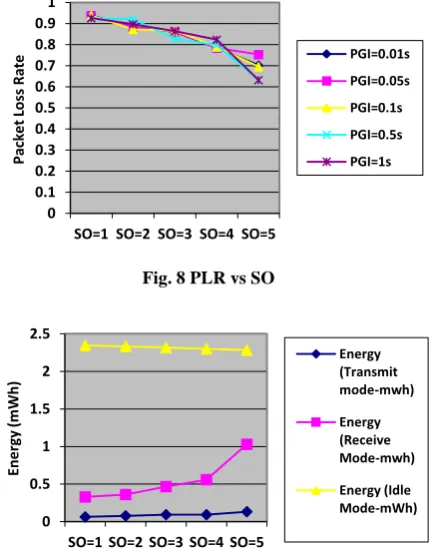
In fig. 8, Packet loss rate is shown against SO; it is shown that a higher SO leads to a smaller packet loss rate. This is because of the fact that, the higher SO resulting in high duty cycle and make the network to transmit more packets successful. When the PGI increases, the packet loss rate decreases. The reason for the result is defined as a smaller packet generation interval means a higher number of packets to be transmitted and as a result of collisions, packets loss ratio increases.
[image:4.595.324.540.437.714.2]In fig. 9, Energy in three modes (transmit, receive and idle) is plotted against SO. As SO is increased, energy consumption in transmit and receive mode is increasing while in idle mode energy consumption is decreasing with increase in SO. The fact can be defined as with increase in SO, duty cycle increases and reduces the idle period, due to which more time is devoted for transmission and reception while idle time is decreased, that is why, energy consumed is more for higher SO in active cases and it is less for higher SO in idle case.
Fig. 8 PLR vs SO
Fig. 9 Energy vs SO
0 0.5 1 1.5 2 2.5
Ene
rg
y
(mW
h)
Energy (Transmit mode-mWh)
Energy (Receive Mode-mWh)
Energy (Idle Mode-mWh)
0 50000 100000 150000 200000 250000 300000 350000 400000
Throug
hput
(bps
) PGI=0.01s
PGI=0.05s PGI=0.1s PGI=0.5s PGI=1s
0 1 2 3 4 5 6 7 8 9 10
SO=1 SO=2 SO=3 SO=4 SO=5
A
vg
. E
nd
-t
o
e
nd
de
lay
(s
)
PGI=0.01s PGI=0.05s PGI=0.1s PGI=0.5s PGI=1s
0 0.1 0.2 0.3 0.4 0.5 0.6 0.7 0.8 0.9 1
SO=1 SO=2 SO=3 SO=4 SO=5
P
ack
e
t
Los
s
R
at
e PGI=0.01s
PGI=0.05s PGI=0.1s PGI=0.5s PGI=1s
0 0.5 1 1.5 2 2.5
SO=1 SO=2 SO=3 SO=4 SO=5
Ene
rg
y
(m
W
h)
Energy (Transmit mode-mwh)
Energy (Receive Mode-mwh)
[image:4.595.66.277.495.622.2]6.
ACKNOWLEDGEMENT
Sincere thanks to Prof. A K Jaiswal and Er. Rajeev Paulus, for their motivation and contribution towards the preparation of the paper. Thanks to friends and colleagues for their all-time support.
7.
CONCLUSION
This paper presented a performance evaluation of Beacon-enabled IEEE 802.15.4 standard. Several network QoS metrics including throughput, packet loss rate, end-to-end delay and energy consumed are examined. These metrics are analyzed with respect to some important and variable protocol parameters as beacon order and superframe order. The analysis of simulation results provides the fact that whether we increase BO or SO, the effected parameter is Duty Cycle and when it is increased performance of IEEE 802.15.4 gets better.
8.
REFERENCES
[1] “IEEE 802.15.4-2006. Part 15.4: Wireless Medium Access Control (MAC) and Physical Layer (PHY) Specifications for Low-RateWireless Personal Area Networks (WPANs),” 2006.
[2] C. Buratti, “Performance analysis of IEEE 802.15.4 beacon enabled mode,” IEEE Transactions on Vehicular Technology, vol. 59, no. 4, pp. 2031–2045, 2010. [3] W. Feng, L. Dou, and Z. Yuping, “Analysis and compare
of slotted and unslotted CSMA in IEEE 802.15.4,” in Proceedings of the 5th International Conference on Wireless Communications, Networking and Mobile Computing (WiCOM ’09), pp. 3659–3663, September 2009.
[4] C. Buratti and R. Verdone, “A mathematical model for performance analysis of IEEE 802.15.4 non-beacon enabled mode,” in Proceedings of the 14th EuropeanWireless Conference (EW ’08), pp. 1–7, June 2008.
[5] D. Rohm, M. Goyal, H. Hosseini, A. Divjak, and Y. Bashir, “A simulation based analysis of the impact of IEEE 802.15.4MAC parameters on the performance under different traffic loads,” Mobile Information Systems, vol. 5, no. 1, pp. 81–99, 2009.
[6] B. Latr´e, P. De Mil, I. Moerman, B. Dhoedt, P. Demeester, and N. van Dierdonck, “Throughput and delay analysis of unslotted IEEE 802.15.4,” Journal of Networks, vol. 1, no. 1, pp. 20–28, 2006.
[7] F. Xia, A. Vinel, R. Gao, L. Wang, and T. Qiu, “Evaluating IEEE 802.15.4 for Cyber Physical Systems,” EURASIP Journal onWireless Communications and Networking, 2011.
[8] X. Liang and I. Balasingham, “Performance analysis of the IEEE 802.15.4 based ECGmonitoring network,” in Proceedings of the 7th IASTED International Conferences on Wireless and Optical Communications, pp. 99–104,Montreal, Canada, May- June 2007.
[9] N. Salles, N. Krommenacker, and V. Lecuire, “Performance study of IEEE 802.15.4 for industrial maintenance applications,” in Proceedings of the IEEE International Conference on Industrial Technology (ICIT ’08), pp. 1–6, Chengdu, China, April 2008.
[10]D. Rohm, M. Goyal, H. Hosseini, A. Divjak, and Y. Bashir, “Configuring beaconless IEEE 802.15.4 networks under different traffic loads,” in Proceedings of the IEEE 23rd International Conference on Advanced Information Networking and Applications (AINA ’09), pp. 921–928, University of Bradford, Bradford, UK, May 2009.
[11]C. Y. Jung, H. Y. Hwang, D. K. Sung, and G. U. Hwang, “Enhanced Markov chain model and throughput analysis of the slotted CSMA/CA for IEEE 802.15.4 under unsaturated traffic conditions,” IEEE Transactions on Vehicular Technology, vol. 58, no. 1, pp. 473–478, 2009. [12] F. Chen, N. Wang, R. German, and F. Dressler,
“Simulation study of IEEE 802.15.4 LR-WPAN for industrial applications,” Wireless Communications and Mobile Computing, vol. 10, no. 5, pp. 609–621, 2010. [13]C. Li, H. B. Li, and R. Kohno, “Performance evaluation
of IEEE 802.15.4 for wireless body area network (WBAN),” in Proceedings of the IEEE International Conference on Communications Workshops (ICC ’09), pp. 1–5, June 2009.
[14]J. Liu, I. Demirkiran, T. Yang, and A. Helfrick, “Feasibility study of IEEE 802.15.4 for aerospace wireless sensor networks,” in Proceedings of the 28th Digital Avionics Systems Conference: Modernization of Avionics and ATM-Perspectives from the Air and Ground (DASC ’09), pp. 1.B.31–1.B.310, Orlando, Fla, USA, October 2009.
[15]F. Chen, T. Talanis, R. German, and F. Dressler, “Real-time enabled IEEE 802.15.4 sensor networks in industrial automation,” in Proceedings of the IEEE International Symposium on Industrial Embedded Systems (SIES ’09), pp. 136–139, Lausanne, Switzerland, July 2009.
[16] A. Mehta, G. Bhatti, Z. Sahinoglu, R. Viswanathan, and J. Zhang, “Performance analysis of beacon-enabled IEEE 802.15.4 MAC for emergency response applications,” in Proceedings of the 3rd International Conference on Advanced Networks and Telecommunication Systems, pp. 151–153, New Delhi, India, December 2009
![Fig. 1 Superframe Structure [7] RELATED WORK](https://thumb-us.123doks.com/thumbv2/123dok_us/8083430.782963/2.595.48.290.75.280/fig-superframe-structure-related-work.webp)