Dependency Detection for Regression Testing using
Test Case Prioritization Techniques
A. Mohamed Shameem
PG Scholar
ME Software Engineering, Final Semester Saveetha Engineering College, Chennai.
N. Kanagavalli
Assistant Professor,
Department of Information Technology, Saveetha Engineering College, Chennai.
ABSTRACT
Regression testing is one of the important activities of software development. When a older version of the software is modified into a newer version a set of test cases needs to be run and the both the versions of the test cases are compared. If both the outputs are matched then the modifications does not affect the remaining part of the software. Rerunning the entire test suite of the previous version increases the cost and time of regression testing. In order to overcome test case prioritization is used. Test case prioritization schedules the test cases for the regression testing. Test cases with highest priority are scheduled to be executed first. There are several number of prioritization techniques are available with their own limitations. This paper presents a metric for assessing the rate of fault dependency detection. This proposed algorithm identifies the faults in earlier stages and the effectiveness of the prioritized test cases are compared with the non prioritized ones by APFDD.
Keywords
Software Engineering; Software Testing; Regression Testing; Test Cases; Test Case Prioritization; Average Percentage of Faults Dependency Detection(APFDD).
1.
INTRODUCTION
Regression testing is any type of software testing that seeks to uncover new software bugs in existing functional and non-functional areas of a system after changes, such as patches or configuration changes, have been made to them. The intent of regression testing is to ensure that a change such as those mentioned above has not introduced new faults.[1] One of the main reasons for regression testing is to determine whether a change in one part of the software affects other parts of the software.[2]
Common methods of regression testing include rerunning previously-completed tests and checking whether program behavior has changed and whether previously-fixed faults have re-emerged. Regression testing can be used to test a system efficiently by systematically selecting the appropriate minimum set of tests needed to adequately cover a particular change.
Prioritizing test cases offer the possibility to exploit some execution goals or strength. One of the execution goals may be appraise of dependency detection among faults. During software testing practical experiences convey that individual faults can be directly perceived and removed, but mutually interdependent faults can be removed if and only if the superior faults have been removed. That is, dependent faults may not be straightaway removed and the fault removal activity lags the fault detection process [3]. For example, if software takes specific amount of inputs and after operative
generates various types of outputs then a unique fault in input ability may make a wide amount of faults in output ability if they are not mutually independent. So, in regression testing if the test cases that discover the faults of output ability execute first and test cases reveals faults of input ability executes after then it will be deferred and in numerous cases will abide long time to observe the original effort of output faults. If the dependencies can be detected originally in regression testing then debugging can be started originally and fault removal time will improve. In this article I present a metric APFDD which measures fault dependency detection cost and I also present an algorithm to alter APFDD.A likeness between prioritized and non-prioritized test cases is also shown with the assist of APFDD.
2.
PROBLEM STATEMENT
Rothermel at el. [4, 5] defines the test case prioritization problem as follows:
Given: T, a test suite; PT, the set of permutations of T; f, a function from PT to the real numbers.
Problem: Find T’ belongs to PT such that (for all T”) (T” belongs to PT) (T” � T’) [f (T’) � f (T”)]. Here, PT represents the set of all possible prioritizations (orderings) of T and f is a function that, applied to any such ordering, yields an award value for that ordering [4, 5].
The goal of this research is to find a metric to quantify the rate of dependency detection among faults and provide an algorithm that prioritizes the test cases in an order that has improved dependency detection rate compare to non prioritized test cases.
3.
RELATED WORK
Pavan Kumar Chittimalli et. el [6] used Regression Test Selection technique which allows for selecting the subset of Test cases from the original Test Suite of the original program version. A safe Regression-Test-Selection technique selects every Test case from the original Test Suite that can expose fault in the modified program version. Gregg Rothermel et. el [7] prioritized Test cases based on the rate of Fault detection which is the number of faults covered by that Test case.
Krishnamoorthi [9] et. el proposed a technique which prioritizes subsequences of the original Test Suite so that the new Test Suite, which is run within a time-constrained execution environment, will have a superior rate of fault detection when compared to rates of randomly prioritized Test Suites . The approach based on the faults is theoretical as it is not possible to have prior knowledge of all faults present in a program.
Lee J. White et.al [10] presented methodology which involves Regression testing of modules where dependencies due to both control-flow and data-flow are taken into account [20]. The Control-flow dependency is modeled as a Control Flow Graph, and a firewall defined to include all affected modules which must be retested.
Mary Jean Harrold [11] prioritized Test cases based on the Statement Coverage but the method needs to prioritize all the Test cases in the Test Suite of the Original version. The method prioritizes all the Test cases from the Test Suite of the Original version which increases the cost and time of Regression testing.
Guoqing Xu presented a technique [12] that safely selects tests from the old Test Suite for testing the new aspect-oriented features. It pre-selects a set of Test cases based on the differences of Control Flow paths of two program versions. It does not suit for object oriented programs.
To improve the software testing activity in regression testing, researchers have proposed many metrics as well as techniques for test case prioritization in recent years. In [13], [5], a metric APFD is proposed for measuring rate of fault detection as a means of objective function and prioritization techniques such as total statement coverage and additional statement coverage are discussed to improve the rate of fault detection. This metric and these techniques, however, assume that all test case and fault costs are uniform. Later to overcome this problem, in [4], a new metric APFDc was proposed which incorporates varying test case and fault costs. The paper also describes adjustments to previous prioritization techniques that allow them, too, to be “cognizant” of these varying costs [4]. Jeffrey and Gupta prioritize test cases using relevant slices [14]. In [15] Qu et al propose an approach to prioritize test cases in black box environment. In [16, 17], Korel et al propose a model based test case prioritization technique, which uses the different information about the system model and its behavior to prioritize the test suite for regression testing. Zhang et al prioritizes test cases based on varying testing requirement priorities and test case costs [18].
4.
REGRESSION TESTING METHOD
In particular, researchers have considered four methodologies related to regression testing and test reuse: retest all, regression test selection, test suite reduction, and test case prioritization. This section provides additional background on the various methodologies of regression testing.
4.1
Retest-all
When P is modified, creating P’, test engineers may simply reuse all non-obsolete test cases in T to test P’, this is known as the retest-all technique [19].
4.2
Regression Test Selection
The retest-all technique can be expensive: Regression test selection (RTS) techniques (e.g., [20, 21]) use information about P, P’, and T to select a subset of T with which to test P’. One cost-benefit tradeoff among RTS techniques involves
safety and efficiency. Safe RTS techniques guarantee that, under certain conditions, test cases not selected could not have exposed faults in P’ [20].
4.3
Test Suite Reduction
Test suite reduction techniques remove redundant test cases from T by using information about P and T..
4.4
Test Case Prioritization
Test case prioritization techniques [7,21], schedule test cases so that those with the highest priority, according to some criterion, are executed earlier in the regression testing process than lower priority test cases.
A potential advantage of these techniques is that unlike test case reduction and non-safe regression test selection techniques, they do not discard tests. Many different prioritization techniques have been proposed [21], but the techniques utilize simple code coverage information like statement and method coverage.
5.
PROPOSED WORK ON TEST CASE
PRIORITIZATION
The prioritization techniques most prevalent in literature and practice involve those that utilize simple (statement and method) code coverage information. We have performed test case prioritization based on all types of coverage’s like Statement coverage, branch coverage, loop coverage and condition coverage including varying cost. We have developed a test case prioritization framework that prioritizes the various test cases.
5.1
Test Case Generation
Test case is a combination of inputs, executing function, expected outputs. We have used the JUnit framework [13] for executing unit tests. JUnit test cases are Java classes that contain one or more test methods that are grouped into test suites. A test case tests the response of a single method to a particular set of inputs.
5.2
Estimating the Cost of Test Case
The value of a test case is affiliated to the resources required to fulfill and authorize it. Different measures are affirmable like ,when the basic required imagination is machine or earthborn test expenditure can be measured in terms of the effective time required to execute a test case.
Added measure considers the monetary costs of test case execution and validation this may reverberate component expenditure, payoff, expenditure of materials required for testing, earnings unsaved due to delays in unsuccessful to agree target accomplishment dates, and so on.
5.3
Fault Generation
Regression faults vary in two ways: by locating naturally occurring faults and by seeding faults. Naturally occurring faults offer external validity, but they are costly to locate and often cannot be found in numbers sufficient to support controlled work. But seeded faults, mutation faults can be provided in larger numbers, allowing more data to be gathered.
5.4
Measuring Effectiveness
Detected" during the enforcement of the test suite. APFDD values array from 0 to 100; higher appraise implies faster fault dependency detection.
Consider an example of a package with five faults (F1, F2, F3, F4, F5), and test suite with five test cases (T1, T2, T3, T4, T5).
[image:3.595.317.556.235.433.2]Fault dependencies can be represented with a directed graph G (V, E). The vertex set V represents the faults, V= {V1, V2, V3, V4, V5}. The edge set E represents fault dependencies where an edge (F1, F2) represents fault F1 is dependent on fault F2. Let in our package we have the following six dependencies E= {(F2, F4), (F2, F5), (F4, F3), (F5, F1), (F5, F3), (F5, F4))}. “Fig. 1” shows the dependency graph.
Fig. 1: Dependency graph
[image:3.595.75.230.246.360.2]We can represent the graph by the dependency matrix of Table 1, M, where M (i, j)=1 if fault Fi is dependent on fault Fj and M (i, j)=0 if Fi is not dependent on fault Fj.
Table 1. Dependency Matrix
F1 F2 F3 F4 F5
F1 0 0 0 0 0
F2 0 0 0 1 1
F3 0 0 0 0 0
F4 0 0 1 0 0
F5 1 0 1 1 0
[image:3.595.54.280.438.543.2]Let NFD (F) = Number of faults dependent on fault F. So, NFD (F1) =1, NFD (F2) =0, NFD (F3) =2, NFD (F4) =2, NFD (F5) =1.
Table 2. Exposure of Fault and Test Case
F1 F2 F3 F4 F5
T1 *
T2 *
T3 * *
T4 *
T5 * * *
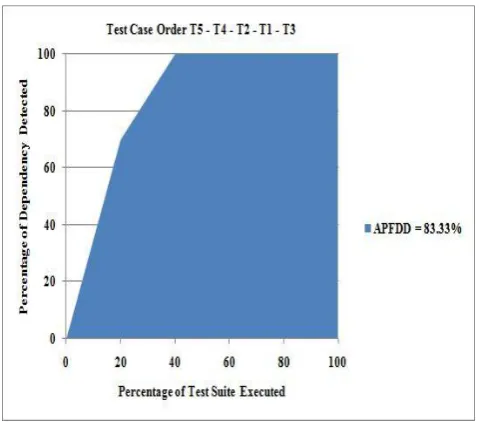
Speculate the test cases are situated in order T1-T2-T3-T4- T5 to comprise a prioritized test suite T'. "Fig. 2" shows the percentage of fault dependencies detected versus the fraction of T' utilized. After running T1 one dependency is detected as just one fault F1 is unprotected and NFD (F1) =1, that mean
[image:3.595.316.556.476.687.2]after executing 20% of T' 16.67% dependencies are detected. Correspondent way after 40%, 60%, 80% and 100% execution of T' 16.67%, 50%, 83.33% and 100% fault dependencies are detected respectively. The region low the curve represents the weighted average of the percentage of the fault dependency detected metric (APFDD) over the spirit of the test suite; the APFDD is 43.33% in this case. APFDD is measured by dividing the region low this curve by the region low the curve if all the dependencies are detected after enforcement of the first test case. The division outcome multiplied by hundred has been taken as a measure of APFDD. "Fig. 3" reflects what encounter when arrangement of the test suite changes to T5-T4-T2-T1-T3. This prioritized test suite has faster dependency detection rate with APFDD reckon of 83.33%.
Fig. 2: APFDD Graph for Non-Prioritized Test Suite
Fig. 3: APFDD Graph for Prioritized Test Suite
5.5
New Prioritization Technique
[image:3.595.54.281.601.705.2]dependency detection during regression testing can let software engineers commence their debugging activities earlier on those faults that make fault proliferation later, hurrying the accomplishment of the software. An reinforced rate of fault dependency detection can also furnish faster feedback on the software, and provide early grounds when quality goals have not been met, allowing strategic decisions about accomplishment schedules to be made early.
The model presented in this article implements a new regression test suite prioritization rule that prioritizes the test cases with the end of increasing the amount of faults dependency detection that are promising to be saved during the enforcement of the prioritized test suite. Fault dependency associated aggregation which misused in the model can be obtained from early enforcement of test suite.
5.5.1 The Algorithm:
Input: Test suite T, Fault dependency matrix M, fault F
Output: Prioritized test suite T’
1: begin
2: set T’ empty
3: set NFD empty
4: set TDC empty
4: for each fault f’ F do 5: for each fault f’’ F do 6: if M [f’, f’’] =1 then
7: NFD [f’’] =NFD [f’’] +1
8: end if
9: end for
10: end for
11: for each test case t T do 12: for each fault f F do
13: if f first exposes in T then
14: TDC[t] =TDC[t] +NFD[f]
15: end if
16: end for
17: end for
18: sort T descending order based on the TDC value of each test case
19: let T’ be T
20: end
The algorithm explains the NFD of each faults based on the fault dependency matrix M. It then calculated total dependency count (TDC) of each test case. TDC of a test case is simply the summation of NFD of faults that first expose in the test case. Using the value of TDC the algorithm then sorts the test cases in descending order of TDC value.
6.
EXPERIMENTATION AND ANALYSIS
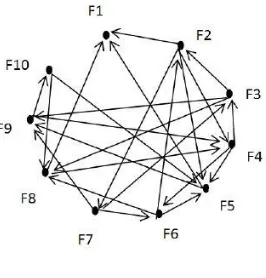
[image:4.595.362.495.77.216.2]“Fig. 4” shows a dependency graph where dependencies among ten faults are shown after an execution of test suite T.
Fig. 1: Dependency graph
Dependency graph represents the fault dependencies between the nodes and test cases are prioritized based on the fault dependencies using Average Percentage of Faults Dependency Detected algorithm which improves efficiency over other.
Table 3 shows the corresponding dependency matrix.
Table 3. Dependency Matrix
F1 F2 F3 F4 F5 F6 F7 F8 F9 F10
F1 0 0 0 0 0 0 0 0 0 0
F2 1 0 0 1 1 0 1 0 0 0
F3 0 1 0 0 0 0 0 1 1 0
F4 0 0 1 0 1 1 0 0 0 0
F5 1 0 0 0 0 0 0 0 1 0
F6 0 1 0 0 1 0 0 1 0 0
F7 0 0 1 0 0 1 0 0 1 0
F8 1 0 0 1 0 0 0 0 0 0
F9 0 0 0 1 0 0 0 0 0 1
F10 0 0 0 0 1 0 0 1 0 0
Table 4 shows the faults detected by a test case in the test suite.
Table 4. Exposure of Fault and Test Case
F1 F2 F3 F4 F5 F6 F7 F8 F9 F10
F1 *
F2 *
F3 *
F4 * *
F5 * *
F6 * *
F7 *
F8 * * *
F9 *
F10 *
With the use of the algorithm from dependency matrix we can calculate NFD of each fault.
NFD (F2) = 2 NFD (F7) = 1
NFD (F3) = 2 NFD (F8) = 3
NFD (F4) = 3 NFD (F9) = 3
NFD(F5) = 4 NFD (F10) = 1
After calculating TDC of each test case we get,
TDC (T1) = NFD (F10) =1
TDC (T2) = NFD (F9) =3
TDC (T3) =NFD (F7) =1
TDC (T4) =NFD (F2) +NFD (F8) =5
TDC (T5) =NFD (F4) +NFD (F5) =7
TDC (T6) =NFD (F1) +NFD (F6) =5
TDC (T7) =0
TDC (T8) =NFD (F3) =2
TDC (T9) =0
TDC (T10) =0
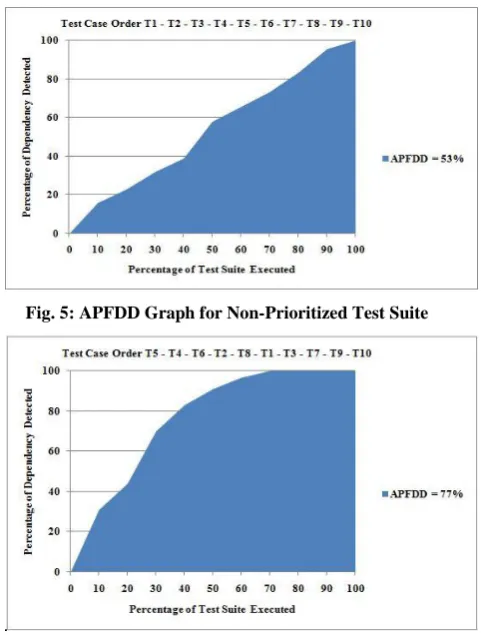
So, sorting test cases descending order of TDC we get the following test cases ordering- T5, T4, T6, T2, T8, T1, T3, T7, T9, T10.This is new prioritized test suite T’.
[image:5.595.53.296.388.706.2]Plotting graph of percentage of fault dependencies detected versus the fraction of test cases used we get the “Fig. 5” for non-prioritized and “Fig. 6” for prioritized test cases.
Fig. 5: APFDD Graph for Non-Prioritized Test Suite
Fig. 6: APFDD Graph for Prioritized Test Suite
7.
CONCLUSION AND FUTURE WORK
We have performed the prioritization and examined the effectiveness of prioritization techniques with APFDD.
Analysis is done for both the prioritized and non prioritized test suite with the help of APFDD. Prioritized test suites are more effective than non prioritized test suite which is proven in graph. APFDD does not explain about Fault severity and Test case execution time. However, in practical world this assumption may vary. Test cases with more severe faults with relatively low fault dependencies on them may be sometimes executed first depending upon business need, test cases with higher execution time but revealing faults with relatively higher fault dependencies on them may be executed later.
In future I will improve the other factors and incorporate fault severity and test case execution time and also by applying other prioritization techniques which considers cost factors and other improved performances.
8.
REFERENCES
[1] Myers, Glenford. The Art of Software Testing. Wiley. ISBN 978-0-471-46912-4, 2004.
[2] Savenkov, Roman, How to Become a Software Tester. Roman Savenkov Consulting. ISBN 978-0-615-23372-7, 2008.
[3] Huang,Chin-Yu, Lin,Chu-Ti, Software reliability analysis by considering fault dependency and debugging time lag. IEEE Transactions, vol. 55(3),pp. 436-450,2006.
[4] Alexey G. Malishevsky, Joseph R. Ruthruff, Gregg Rothermel, Sebastian Elbaum, “Cost-cognizant Test Case Prioritization,” Technical Report TR-UNL-CSE-2006-004, Department of Computer Science and Engineering, University of Nebraska–Lincoln, Lincoln, Nebraska, U.S.A., March 2006.
[5] S. Elbaum, A. Malishevsky, and G. Rothermel, “Prioritizing test cases for regression testing,” Proc. The 2000 ACM SIGSOFT International Symposium on Software Testing and Analysis, Portland, Oregon, U.S.A., August, 102–112,2000.
[6] Pavan Kumar Chittimalli and Mary Jean Harrold” Recomputing Coverage Information to Assist Regression Testing” IEEE on Software engineering, Vol. 35, No. 4,2009.
[7] Gregg Rothermel, Roland H. Untch, Chengyun Chu and Mary Jean Harrold, “Test case Prioritization: An Empirical Study‟, Proceedings of the IEEE International Conference on Software Maintenance, Vol. 10, pp.77-109,1999.
[8] Hyuncheol Park, Hoyeon Ryu and Jongmoon Baik, ‟Historical Value Based Approach for Cost-cognizant Test case Prioritization to Improve the Effectiveness of Regression testing‟, Proc. IEEE International Conference on Secure System Integration and Reliability Improvement, pp. 170-179,2008.
[9] Krishnamoorthi.R and Sahaaya Arul Mary.S.A, ‟ Regression Test Suite Prioritization using Genetic Algorithms‟, International Journal of Hybrid Information Technology,Vol.2, No.3,2009
[10] Lee J. White and Hareton K.N. bung ‟ A Firewall Concept for both Control- Flow and Data-Flow in Regression Integration Testing”, Bell-Northern Research,Ltd,2000.
IEEE Transactions on Software Engineering, Vol. 27, No.10,2001.
[12] Guoqing Xu‟ A Regression Tests Selection Technique for Aspect-Oriented Programs‟ Proc. of the ACM Conf. on Software Engineering, ACM Copyright, pp.120-130,2006.
[13] S. Elbaum, A. Malishevsky, and G. Rothermel,“Test case prioritization: A family of empirical studies,” IEEE Transactions on Software Engineering, vol. 28(2), pp. 159–182,2002.
[14] D. Jeffrey and N. Gupta, “Test case prioritization using relevant slices,” Proc. Computer Software and Applications Conference, 411–420,2006.
[15] B. Qu, C. Nie, B. Xu, and X. Zhang, “Test case prioritization for black box testing,” Proc. Computer Software and Applications Conference, July 465– 474,2007.
[16] B. Korel, G. Koutsogiannakis, and L. H. Tahat, “Model-based test prioritization heuristic methods and their
evaluation,” Proc. International Conference on Software Maintenance, 34–43,2007.
[17] B. Korel, L. Tahat, and B. Vaysburg, “Model based regression test reduction using dependence analysis,” Proc. International Conf. on Software Maintenance, 214– 223,2002.
[18] X. Zhang, C. Nie, B. Xu, and B. Qu, “Test case prioritization based on varying testing requirement priorities and test case costs,” Proc. International Conference on Quality Software, 15–24,2007.
19] K. Onoma, W-T. Tsai, M. Poonawala, and H. Suganuma,Regression Testing in an Industrial Environment, Comm.ACM, vol. 41, no. 5, pp. 81-86, May 1988.