7
Chapter 2
Correlation Network Analysis in Currency
Exchange Rates
S. Y. Lim1, M. S. Rohayu2
1 Faculty of Science, Technology and Human Development,Universiti Tun
Hussein Onn Malaysia, 86400 Batu Pahat, Johor, Malaysia, [email protected]
2 Faculty of Science, Technology and Human Development, Universiti Tun
Hussein Onn Malaysia, 86400 Batu Pahat, Johor, Malaysia, [email protected]
Abstract.This paper focused about the application of correlation network analysis on currency exchange rate in order to examine the interrelationship and behaviours of 151 world currencies. Correlation structure is used to measure the relationships among currencies. In spite of that, minimum spanning tree is used to analyse the network of currency exchange rate and filter the essence information which contained in the network. Centrality measures such as degree centrality, closeness centrality and betweenness centrality are being used to interpret the network in more details. Topology showed in the network will give a useful and helpful guide to understand the behaviours among the world currencies. It also helps to determine the most important currency in the network. The results show that HKD-Hong Kong Dollar and SGD-Singapore Dollar are the most important currencies, followed by in order of importance; French Franc, Cypriot Pound, Sudanese Old Pound, UAE Dirham, Bolivian Boliviano and US Dollar.
8
1
Introduction
Exchange rate is the rate of which regional currencies can be exchanged for other currency at any given point in time. Ratio for major currencies is temporary due to the ratio is determined by the financial market which measured by the value of daily transactions [1]. Currency exchange rate is floated and fluctuated endlessly might due to some causes such as economic blocs, interest rates, and etc. or may be pegged to another country currency. The exchange rate has direct effects on all other markets and currency is expected to reflect the entire economic status of a currency. Value of currency is tremendously important because currency exchange rate is a measure of economic balance between two countries [2, 3, 4].
A currency exchange rate constitutes a complex system whereby their complicated interrelationships are in terms of price fluctuations and their number of currencies. Interaction between currencies can be determined by implementing correlation network analysis among the logarithmic of currencies price returns [3, 5]. Correlation network analysis is a mathematical method which use correlation matrices and minimum spanning tree to determine the complicated interrelationship and interdependencies among the global currencies. Moreover, correlation network analysis examines the similarities among the currency exchange rate markets and determined the significant implications for portfolio optimization [6].
The recent fall in the value of the dollar against other major currencies is quite mysterious and has attracted numerous economic „explanations‟ to reason away its dramatic decline [7]. There are numerous uncertainties about how this currency affects the other currencies‟ behaviours and how are the interrelationships among the currencies. Besides, currency which dominant the other currencies keep changing from time to time. This causes the traders confused about which particular currency pegged to other currency or appear to be assuming a dominant or dependent role within the network.
9
2
Methodology
Generally, network topology begins with correlation matrix followed by transforming the correlation matrix into distance matrix. Minimum spanning tree is constructed by using the distance matrix. Kruskal‟s algorithm is used as suggested in [8] in order to solve the minimum spanning tree problem. After that, adjacent matrix which obtained from the outputs of Kruskal‟s algorithm will then be used to construct the network topology of currencies. To interpret the network topology in more details, centrality measures is implemented.
First, to quantify synchronization between the currencies, logarithmic return of exchange rate, P ti( ), is being calculated with the formula of
( ) ln ( 1) ln ( )
i i i
P t P t P t (1)
for all i = 1, 2, …, n where is the i-th currencies under study where i = 1, 2, …, n. By using the logarithmic return of exchange rate, correlation coefficient between a pair of the rates can be calculated by cross-correlation function as
2 2 2 2
( )(
i j i j
ij
i i j j
PP P P
P P P P
(2)
where Pi represents the statistical average of P ti( )for a given time. The correlation matrix is a symmetric matrix of size n x n and by definition, for
1 ii
all i and
ijcould differ from -1 to 1 for alli j.Correlation matrix obtained has to transform into a distance matrix which defined as
2(1 )
ij ij
d (3)
in order to analyse the network. This
d
ij is the distance between each pair of rate i and rate j since it satisfies the following three properties;i.
d
ij
0
if and only if i j ,ii.
d
ij
d
ji,iii.
d
ij
d
ik
d
kj.10 centrality, closeness centrality and betweenness centrality are being applied. Centrality measures help in finding the most central node in the network structure and understanding the importance of each node relative to the others [3, 9].
3
Results and Discussion
3.1 Currency Exchange Rate Data Description
[image:4.595.138.455.413.574.2]A time series of daily data for 151 currencies are being analysed and the currencies are denoted according to ISO 4217 standard. The currencies can be divided into seven groups according to the geographical regions and all 151 currencies can be considered as complex systems. The sampling period of the data collection is taken in daily basis from January 1, 2010 to December 31, 2015 from OANDA (2016). In this research, Gold Ounces (XAU) is used as the base currency since the changes in gold values are very small.
Table 1.List of currencies‟ colours according to the geographic region.
Region Colour
African countries Wild Strawberry
American countries Dandelion
Asian countries Blue
Europe countries Maroon
European Union countries Dark Orchid
Middle East countries Green
Pacific Ocean countries Corn Flower Blue
3.2 Minimum Spanning Tree
11 adjacent matrix is a matrix with element of aij=1 if the i-th and j-th nodes are linked and 0 otherwise. Based on the adjacent matrix, there are only 151-1 =150 links to visualize the global currencies interrelationship. In Fig. 1, the currencies (nodes) are coloured to relate the geographic region to which as shown in Table 1.
12 Fig. 1 shows the currencies are clustered into eight main groups which French Franc, Singapore Dollar, Hong Kong Dollar, Cypriot Pound, Sudanese Old Pound, UAE Dirham, US Dollar and Bolivian Boliviano are the key currencies. Meanwhile, Hong Kong Dollar and Singapore Dollar are the predominant world currencies and the hub of a cluster respectively since both currencies display the star like structures.
In this analysis, there are 12 currencies influenced by Singapore Dollar and the nearest currency to Singapore Dollar is Hong Kong Dollar (0.3405) whereas the furthest currency is Russian Rouble. This indicates that the rise or fall of Singapore Dollar will affect the nodes which nearby to Singapore Dollar. The main surprise from the MST shown above is the Malaysia Ringgit is not close to Singapore Dollar, but it is reasonably close to Egyptian Pound.
On the other hand, there are 12 currencies influenced by Hong Kong Dollar too. Slovak Koruna is the nearest currencies to Hong Kong Dollar where the distance between both currencies is only 0.02933. Nonetheless, the furthest currencies to Hong Kong Dollar is Venezuelan Bolivar which the distance of HKD-VEB is 1.0646.
The second predominant world currencies are French Franc and Cypriot Pound where both currencies dominate 10 currencies each. Regarding to the MST, the nearest currencies to French Franc is Finnish Markka (0.000115) whereas Greek Drachma is the nearest currencies to Cypriot Pound where the distance of Cypriot Pound-Greek Drachma is 0.000154. The other six currencies are influenced by US Dollar which are and among these six of them, the nearest currencies to US Dollar is Panamanian (8.09E-05) while Greek Drachma is the second nearest currencies to US Dollar with the distance value of 0.0004.
13 Fig. 2.Large distance currencies.
14 (1.0792), Malawi Kwacha- Honduran Lempira (1.0706), Venezuelan Bolivarr-Hong Kong Dollar (1.0646) and Comoros Franc-Danish Krone (1.0018) show them to be largely isolated from the others, which means they have poor interrelationships with the others. Among these seven large distance currencies, five of them are represented African countries.
15 3.3 Centrality Measures
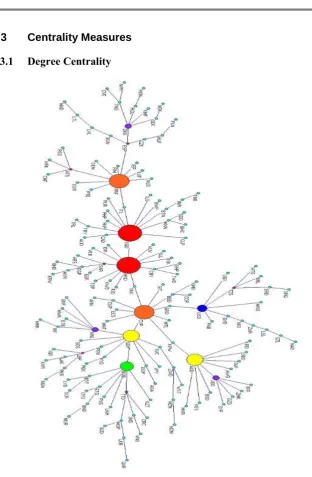
[image:9.595.139.452.116.594.2]3.3.1 Degree Centrality
Fig. 3.Degree centrality.
16 Dirham have 9 links (yellow points). Apart from that, Bolivian Boliviano consists of 7 links (green points) while US Dollar has 6 links (blue points) in this network. Each of the following has 5 and 4 links: Honduran Lempira, Danish Krone and Jordanian Dinar (purple points) and Tanzanian Shilling, Trinidad & Tobago Dollar, Austrian Schilling, Spanish Peseta, Lebanese Pound and Saudi Riyal (rubine red) respectively. The rests of the nodes are only 3, 2 and 1 links. As a result, Hong Kong Dollar and Singapore Dollar are the most influential currencies to the greater number of other currencies in this analysis whereas Cypriot Pound and French Franc are the second most influential currencies in the network.
[image:10.595.169.413.327.651.2]3.3.2 Closeness Centrality
17 According to the closeness centrality, Cypriot Pound (red points) has the highest score (0.2373) in the network and this indicates that Cypriot Pound plays the most important role in the network. In addition, the second most important in the network is Slovak Koruna with a score of 0.2311 (yellow points) followed by Hong Kong Dollar with a score of 0.2246 (orange points or the third most important). The most fourth and fifth important nodes in the network are Sudanese Old Pound with score of 0.2158 (green point) and Singapore Dollar with score of 0.2069 (blue point) respectively. The rest of the nodes have the closeness centrality score which smaller than 0.2.
[image:11.595.158.443.308.673.2]3.3.3 Betweenness Centrality
18 Cypriot Pound (red point) is the highest-scoring currency in terms of betweenness centrality in the network. This indicates that the influences of most currencies to the others are passing through Cypriot Pound. Hence, Cypriot Pound plays a crucial role in the network as a liaison that can flow and pass the information among the currencies especially from the cluster dominate by the other seven key currencies. The other seven highest-scoring currencies are Hong Kong Dollar (0.5817), Slovak Koruna (0.4961), Singapore Dollar (0.4811), Sudanese Old Pound (0.4729), French Franc (0.3268), Italian Lira (0.3140), and Bolivian Boliviano (0.2230).
4 Conclusions
In a conclusion, the currencies are not clearly clustered from each other except for European Union countries due to the interrelationships among European Union countries are more congregated and assembled. Nevertheless, African countries are greatly isolated from the others since most of them have the large distances from the hubs. The behaviours of clusters are not only formed according to geographical factors, but economical factors as well [2]. Moreover, Hong Kong Dollar and Singapore Dollar are the hub of the cluster respectively due to both of them display the star-liked structures and dominate the highest number of links in the network structure. The results obtained from the analysis are quite surprising as US Dollar is not the predominance currency among the global currencies. Besides, the findings about any changes on Malaysian Ringgit is not affected by Singapore Dollar but Hong Kong Dollar, is quite surprising too.
19
Acknowledgement. Thank you UTHM for giving me an opportunity and
useful resources to conduct the research.
References
1. Evans R G (2014) Exchange Rates - First Edition. Retrieved on March 17, 2016 from http://pages.hmc.edu/evans/ExchangeRates.pdf
2. Keskin M, Deviren B, Kocakaplan Y (2010) Topology of the correlation networks among major currencies. Physica A: Statistical Mechanics and its Application, 390(4):719-730.
3. Sharif S, Yusoff N S, Djauhari M A (2016) Network topology of foreign exchange rate. Modern Applied Science, 6(11):35–43.
4. Mizuno T, Takayasu H, Takayasu M (2005) Correlation Networks Among Currencies.Physica A:Statistical Mechanics and Its Applications, 364:336-342.
5. Kwapien J, Gworek S, Drozdz S, Gorski A (2009) Analysis of a network structure of the foreign currency exchange market. Journal of Economic Interaction and Coordination, 4(1):55–72.
6. Wang G, Xie C, Han F, Sun B (2012) Similarity measure and topology evolution of foreign exchange markets using dynamic time warping method: Evidence from minimal spanning tree. Physica A: Statistical Mechanics and Its Applications, 391(16):4136–4146.
7. McDonald M, Suleman O, Williams S, Howison S, Johnson N F (2005) Detecting a currency‟s dominance or dependence using foreign exchange network trees. Physical Review E - Statistical, Nonlinear, and Soft Matter Physics, 72(4):1–10.
8. Mantegna R N, Stanley H E (2000) An Introduction to Econophysics: Correlations and Complexity in Finance. Physics Today, 53(12):70.