Analysis of Surface Roughness and Material Removal
Rate for Metal Matrix Composite AlSi/10%ALN in EDM
Die Sinking Operation
S. Sulaiman
*, M.S. Sany, M.S. Said
Manufacturing Section, Malaysian Spanish Institute, University of Kuala Lumpur, Malaysia
Copyright © 2015 by authors, all rights reserved. Authors agree that this article remains permanently open access under the terms of the Creative Commons Attribution License 4.0 International License
Abstract
The development of new materials show the immense growth but the major problem, it is very difficult to machine the newly developed materials. So it is necessary to adopt some new machining methods. Electrical Discharge Machining (EDM) is a non-traditional and most popular machining method to manufacture dies, punches and press tools because of its capability to produce complicated, intricate shapes and to machine hard materials. From the industrial point of view, metal matrix composite is one of the main topics studied in the last 15 years. Having studied so long, this material is very suitable for use in several engineering applications, particularly in the automotive and aerospace [1]. The particle reinforced aluminium nitric MMC 10% is getting the attention of researchers because it has good properties in terms of high strength to weight ratio, high strength, high impact strength. During experimentation, current and pulse duration were taken as variables for the study of surface roughness and material removal rate. Cooper electrode is used with kerosene as a dielectric fluid in the experiment. Using Taguchi method, L9 orthogonal array has been chosen and three levels corresponding to each of the variables are taken. Experiments have been performed as per the set of experiments designed in the orthogonal array. Results of experimentation were analyzed analytically as well as graphically. Signal to Noise ratio was calculated to analyze the effect of input parameter more accurately. The optimal value of Surface Roughness (SR) and Material Removal Rate (MRR) were also calculated using their signal to noise ratio value. From the experimental results, it is clear that the cooper electrode with lowest current value (2amp) and pulse duration (4μs) has better surface finish while highest current value (7amp) and pulse duration (8μs) possess highest MRR.Keywords
AlSi/AlN Metal Matrix Composite, EDMDie Sinking, Surface Roughness, Material Removal Rate
1. Introduction
A composite material is a material consisting of two or
more physically and/or chemically distinct phases [2]. The composite generally has superior characteristics than those of each of the individual components. Usually the reinforcing component is distributed in the continuous or matrix component. When the matrix is a metal, the composite is termed a metal-matrix composite (MMC). In MMCs, the reinforcement usually takes the form of particles, whiskers, short fibers, or continuous fibers. Metal-matrix composites are generally distinguished by characteristics of the reinforcement: particle reinforced MMCs, short fiber-or whisker-reinforced MMCs, and continuous fiber- or layered MMCs. These are categorized by the diameter and aspect ratio (length/diameter) of the reinforcement. The aspect ratio of the reinforcement is an important quantity, because the degree of load transfer from the matrix to the reinforcement is directly proportional to the reinforcement aspect ratio. Thus, continuous fibers typically provide the highest degree of load transfer, because of their very high aspect ratio, which results in a significant amount of strengthening along the fiber direction. Particle or short fiber reinforced metals have a much lower aspect ratio, so they exhibit lower strengths than their continuous fiber counterparts, although the properties of these composites are much more isotropic. Figure 1(a) and (b) shows typical microstructures of a continuous alumina fiber/Mg composite and silicon carbide particle/ Al composite, respectively.
[image:2.595.142.469.81.194.2]
(a) (b)
[image:2.595.132.479.237.272.2]Figure 1. Typical microstructures of some metal-matrix composites: (a) continuous alumina fiber/Mg composite and (b) silicon carbide particle/Al composite.
Table 1. Chemical Composition of Materials
Element Fe Si Zn Mg Cu Sn Co Ti Cr Al wt % 0.42 11.1 0.02 0.0107 0.02 0.016 0.004 0.0085 0.008 Equilibrium
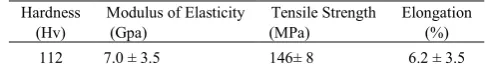
Table 2. Mechanical Properties AlSi/10wt%AlN Hardness
(Hv) (Gpa) Modulus of Elasticity (MPa) Tensile Strength Elongation (%) 112 7.0 ± 3.5 146± 8 6.2 ± 3.5
2. Literature Review
2.1. Electrical Discharge Machining (EDM)
Electrical Discharge Machining is a nontraditional concept of machining. It has been widely used for making dies, punches and molds. It is also used in manufacturing of finished parts for automotive and aerospace industries and surgical components. It is also called spark erosion machining method because in this method material of work piece is removed by erosion effect by the electric spark. This process can be successfully employed to machine electrically conductive parts irrespective of their hardness, shape and toughness [3]. The EDM machine has a tool and a work piece which is to be machined. In die-sinking EDM, the shape of tool used for spark generation is a replica of the shape of which is to be produced. The tool electrode and the work are held at an accurately controlled distance from one another, which are dependent on the operating conditions and referred to as spark gap. Both the tool and the work piece are dipped in a dielectric medium like kerosene, EDM oil, etc [4].
2.2. Historical Background
The origin of electrical discharge machining goes far back to 1770, when English scientist Joseph Priestly discovered the erosive effect of electrical discharges on metals but after that the full advantage of this concept had not been taken till 1943. The Lazarenko, used resistance capacitance type of power supply, which is widely used in 1950s. This idea gave a new born to the EDM process but during the 1948-1950 this idea started to spread in the industrial world area. In 1980s the advancement of Computer Numerical Control
(CNC) in EDM has brought a great turn in improving the efficiency of machining operations, pulse recognition, real time analysis, A.C tool wear analysis, controls and expert systems [5]. Wire EDM machine (WEDM) touched the new heights of performance. The phase 1990-95 brought the new parametric approach, Neutral networks and Fuzzy controllers. Modern era from 1995 till date brought in various new aspects in EDM machining such as micromachining by EDM and machining without liquid dielectric. Now EDM is more accepted technique for material removal next to CNC Milling [6].
2.3. Past Work
[image:2.595.54.297.300.335.2]3. Methodology
3.1. Experimental Set-Up
[image:3.595.346.520.111.343.2]The experiments have been conducted on Electrical Discharge Machine model Agie Charmille FO 23P available at UniKL MSI workshop shown in Figure 2. Many input parameters like discharge voltage, pulse on time, pulse off time, polarity, peak current, electrode gap and dielectric pressure can be varied in EDM process. Each factor has its own effect on the output parameters such as tool wear rate (TWR), material removal rate (MRR), surface roughness (SR), hardness of the machined surface, overcut size and profile/geometry accuracy. The range of the input parameters is constrained by this model of EDM machine.
[image:3.595.59.296.270.432.2]Figure 2. EDM Die Sinking model Agie Charmille FO 23P The input parameters, which were kept constant during the experimentation, are stated below in the Table 3.
Table 3. Constant input parameter
No Parameter Fixed value/ set up 1 Surface roughness value 18µm
2 Depth of cut 0.5mm
3 Dielectric Pressure 0.2 Kg/cm² 4 Electrode specification Copper - 12mm (Ø), 95mm (L) 5 specification Workpiece MMC materials - 105mm(h) x 62mm(w) x 10mm(t)
6 Dielectric Kerosene
7 Selection of machine priorities Surface finish Speed Tool wear
Surface roughness was measured by using Mitutoyo model Surfest SJ-310 as seen in Figure 3. The equipment uses the stylus method of measurement and measure roughness up to 10μm. Surface roughness of each sample was measured at three different positions of each machined sample. For the weight balancer was measured using the AND model GR-200. The weighing machine shown below in Figure 4 was used to take the weight of the work material and the electrode before and after the machining process.
[image:3.595.348.518.366.604.2]This machine is very sensitive to the dust or any contaminated environment.
Figure 3. Portable surface roughness tester
Figure 4. Portable weight balancer
3.2. Design of Experiment and Data Analysis
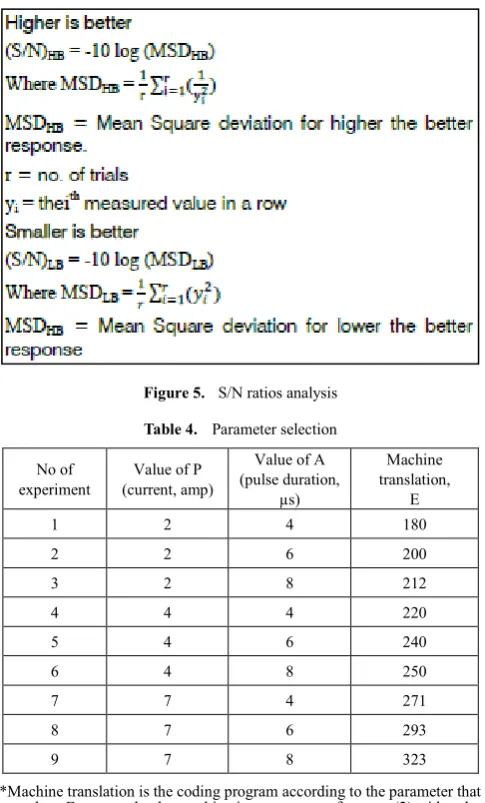
[image:3.595.60.295.495.648.2]Figure 5. S/N ratios analysis
Table 4. Parameter selection
No of
experiment (current, amp) Value of P
Value of A (pulse duration,
µs)
Machine translation,
E
1 2 4 180
2 2 6 200
3 2 8 212
4 4 4 220
5 4 6 240
6 4 8 250
7 7 4 271
8 7 6 293
9 7 8 323
*Machine translation is the coding program according to the parameter that we select. For example, the combination parameter of current (2) with pulse duration (4) is 180. The machine itself has its own programming, so we just simply follow the machine setup.
4. Result and Analysis
4.1. Analysis of Variance (ANOVA)
The knowledge of the contribution of individual factors is critically important for the control the final response. The analysis of variance (ANOVA) is a common statistical technique to determine the percent contribution of each factor for results of the experiment. It calculates parameters known as sum of squares SS(tr), degree of freedom (DOF), variance and percentage of each factor.
Table 5. Data Collection Of Experiment According To Surface Roughness No of
experiment Ra, test 1 (µm) Ra, test 2 (µm) Ra, test 3 (µm) Average (µm)
1 1.90 1.84 1.61 1.78
2 2.57 2.44 2.66 2.56
3 1.87 2.24 1.98 2.03
4 2.72 2.65 2.57 2.65
5 2.54 2.59 2.50 2.54
6 3.03 3.16 2.80 3.00
7 4.22 3.94 4.04 4.07
8 6.12 4.81 5.28 5.40
9 7.68 8.13 8.14 7.99
Table 6. Average effect response table of S/N ratio for SR
Level Current Pulse
1 -6.441 -8.555
2 -8.701 -10.303
3 -14.964 -11.248
Delta 8.523 2.693
Rank 1 2
Table 7. Average effect response table of raw data for SR
Level Current Pulse
1 2.123 2.833
2 2.730 3.500
3 5.820 4.340
Delta 3.697 1.507
7 4
2 -6 -7 -8 -9 -10 -11 -12 -13 -14 -15
8 6
4 Current
M
e
a
n
o
f
S
N
r
a
ti
o
s
Pulse
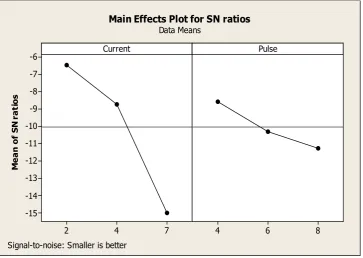
Main Effects Plot for SN ratios
Data Means
[image:5.595.124.488.79.337.2]Signal-to-noise: Smaller is better
Figure 6. Main effects plot of S/N ratio for SR
7 4
2 6
5
4
3
2
8 6
4 Current
M
ea
n
of
M
ea
ns
Pulse
Main Effects Plot for Means
[image:5.595.123.488.362.606.2]Data Means
7 4
2 -20
-30
-40
-50
-60
8 6
4 Current
M
ea
n
of
S
N
ra
ti
os
Pulse
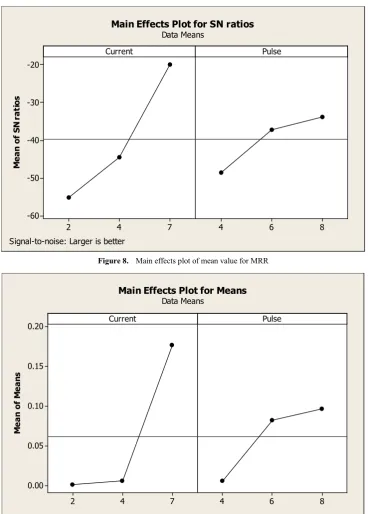
Main Effects Plot for SN ratios
Data Means
[image:6.595.121.490.73.588.2]Signal-to-noise: Larger is better
Figure 8. Main effects plot of mean value for MRR
7 4
2 0.20
0.15
0.10
0.05
0.00
8 6
4 Current
M
ea
n
of
M
ea
ns
Pulse
Main Effects Plot for Means
Data Means
Figure 9. Main effects plot of mean value for MRR
4.2. Summary
[image:6.595.123.486.80.328.2]Table 8. Analysis of Variance for SR
Source DF Seq SS Adj SS Adj MS F value P value PD (%) Current 2 116.96 116.96 58.479 18.94 0.009 83.24
Pulse 2 11.20 11.20 5.599 1.81 0.275 7.97
Error 4 12.35 12.35 3.088 8.79
Total 8 140.51 100
[image:7.595.135.477.202.360.2]*DF : Degree of Freedom, SS: Sum of Square, MS: Mean of Square, PD: Percentage of Distribution
Table 9. Data Collection Of Experiment According To Material Removal Rate No of
experiment Workpiece Removal Rate (g) Machining times (min) Material removal rate (g/min)
1 0.1006 84.53 0.00119
2 0.1087 72.02 0.00150
3 0.2790 90.97 0.00307
4 0.1335 45.27 0.00295
5 0.1583 21.38 0.00740
6 0.1204 11.97 0.01006
7 0.1325 8.80 0.01506
8 0.5460 2.28 0.23940
[image:7.595.130.477.348.682.2]9 0.5830 2.10 0.27762
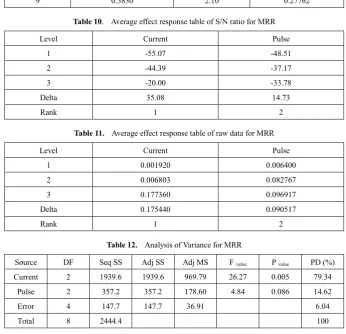
Table 10. Average effect response table of S/N ratio for MRR
Level Current Pulse
1 -55.07 -48.51
2 -44.39 -37.17
3 -20.00 -33.78
Delta 35.08 14.73
Rank 1 2
Table 11. Average effect response table of raw data for MRR
Level Current Pulse
1 0.001920 0.006400
2 0.006803 0.082767
3 0.177360 0.096917
Delta 0.175440 0.090517
Rank 1 2
Table 12. Analysis of Variance for MRR
Source DF Seq SS Adj SS Adj MS F value P value PD (%) Current 2 1939.6 1939.6 969.79 26.27 0.005 79.34
Pulse 2 357.2 357.2 178.60 4.84 0.086 14.62
Error 4 147.7 147.7 36.91 6.04
Total 8 2444.4 100
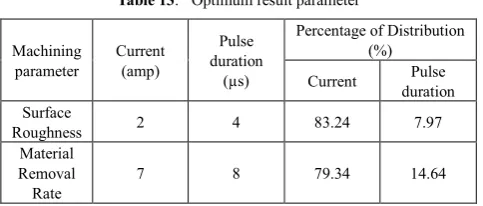
5. Conclusions
[image:8.595.58.300.272.375.2]In the present study, for EDM process the effect of current and pulse duration has been investigated. The effect of input parameters such as current and pulse duration were found to have significant effect on surface roughness and material removal rate. All the experiments were performed on metal matrix composite (MMC) of 10% AISi/AIN. The Taguchi method was applied in experimental design to optimize multi response parameters of EDM Die Sinking machining by using copper electrode. L9 orthogonal array based on Taguchi design and ANOVA was performed for analyzing the results. The optimum parameters obtained will help industry to have a competitive machining operation from economical and manufacturing perspective.
Table 13. Optimum result parameter
Machining
parameter Current (amp)
Pulse duration
(µs)
Percentage of Distribution (%)
Current duration Pulse Surface
Roughness 2 4 83.24 7.97
Material Removal
Rate 7 8 79.34 14.64
Therefore, from the final result as shown at the Table 13, we can conclude that:
1. For the SR, current with 83.24% distribution is most influencing factor follow by pulse duration with 7.97%. SR decreases with the lower value of current and pulse duration. It is clear that cooper electrode with lower current value (2amp) and pulse duration time (4μs) value has better surface finish.
2. For the MMR, current with 79.34% distribution is most influencing factor follow by pulse duration time with 14.64%. MRR increases with the higher value of current and pulse duration. It is clear that cooper electrode with higher current value (7amp) and pulse duration time value (8μs) possess highest MRR.
REFERENCES
[1] Srinivasan, A. R.M. Arunachalam, S. Ramesh and J.S. Senthilkumaar, (2012). Machining Performance Study on Metal Matrix Composites - A Response Surface Methodology Approach.
[2] Karl Ulrich Kainer, (2006) Basics of Metal Matrix Composites [3] Haron, C.H., Deros, B.M., Ginting, A. and Fauziah, M. (2001), “Investigation on influence of machining parameters when machining tool steel using EDM”, Journal of Materials Processing Technology, Vol. 116, pp. 84-87.
[4] Kojima, H., Kunieda, M. and Nishiwaki, N. (1992), “Understanding discharge location movement during EDM”, Proceedings International Symposium Electro machining, Vol. 10, pp. 144.
[5] Dewangan, S.K. (2010), “Experimental Investigation of Machining Parameters for EDM using U- shaped Electrode of AISI P20 Tool Steel”, NIT Rourkela, pp. 4-6.
[6] Jianxin, D. and Taichiu, L. (2002), “Effect of ultrasonic surface finishing on the strength and thermal shock behavior of the EDM ceramic composite”, International Journal of Machine Tools & Manufacture, Vol.42, pp. 245-250.