Journal of Chemical and Pharmaceutical Research, 2015, 7(8):241-245
Research Article
CODEN(USA) : JCPRC5
ISSN : 0975-7384
Delignification
reaction kinetics
for rice straw in basic ionic liquid
[NH-(C2H4OH)3]
+Zongyu Liu
1, Wei Song*
2and Yu Deng
31College of Environmental Science and Safety Engineering, Tianjin University of Technology, Tianjin, China 2Tianjin Key Laboratory for Control Theory & Applications in Complicated Systems, Tianjin University of
Technology, Tianjin, China
3School of Materials Science and Chemical Engineering, Tianjin University of Science &Technology, Tianjin, China
_____________________________________________________________________________________________
ABSTRACT
In this paper, basic ionic liquid [NH-(C2H4OH)3]+ is synthesized. The effects of cooking temperature and time on pulping process are analyzed based on the changes of lignin quality. Kinetics experiments are carried out under the temperature 80℃, 90℃, 100℃, 110℃, 120℃, respectively. The results indicate that delignification reaction kinetics
of basic ionic liquid [NH-(C2H4OH)3]+ cooking rice straw pulping process belongs to first order. The linear regression equation is lnk=10.327-6174.2/T, and its fitting coefficient R2=0.9901. Delignification reaction activation energy is 51.344kJ·mol-1.
Key words: delignification; kinetics; ionic liquids; rice straw; pulping
_____________________________________________________________________________________________
INTRODUCTION
For organic solvent pulping process, it generally uses the flammable solvents with low boiling point as cooking agent. In the pulping process, low boiling point solvent generally needs a higher pressure, which the corresponding temperature arrives at 180-220℃[1-3]. This method is not only waste of drug resources, large energy consumption,
high cost, serious pollution, and the reaction time is long, the pulp yield is low. So it makes the pulp and paper industry development seriously hindered. In recent years, ionic liquids as a new type of environmentally friendly solvents, more and more get the attention of people [4]. Ionic liquid pulping process not only can improve the selectivity of cooking reagent, make it easier for lignin dissolution, shorten the cooking time, reduce the consumption of chemicals, also reduces the pollution load of black liquor [5-8]. This paper makes the kinetics experiments, confirming the delignification reaction order and reaction activation energy, and gives the linear regression equation through the determination of lignin quality in black liquor.
EXPERIMENTAL SECTION
2.1 Materials
Triethanolamine, analytical grade, Tianjin North Tianyi Chemical Reagent Factory; glacial acetic acid , analytical grade, from Tianjin Fuchen Chemical Reagent Factory; anhydrous ethanol, analytically pure, Tianjin shibei fine chemicals development co., LTD; rice straw, from pulping and papermaking laboratory of Tianjin University of Science and Technology.
2.2. Synthesis ionic liquid
react under normal temperature, the reaction equation is as follows:
N(CH2-CH2-OH)3+CH3COOH → [NH-(CH2-CH2-OH)3]++[CH3COO]-
2.3 Rice straw cooking pulping
Cut rice straw to 1.5 cm pieces before cooking. Every time take 20 g oven dry straw. Then add them and ionic liquid into digester according to the solid-liquid ratio of 1:5, and mix evenly. Cooking experiments are carried out in different temperature & time at atmospheric pressure [11].
2.4 Lignin separation
After cooking, put the rice straw pulp into 200 mesh filter bag, rinse repeatedly it with distilled water and squeeze out cooking liquor in the end. Transfer liquid phase to a beaker, remain still for a period of time. Make centrifugal separation after a large amount of precipitate being separated out. The filtrate pH is adjusted neutral after the precipitate separated out undergoing alkali soluble and acid soluble. Lignin is separated out again in neutral solution. It is rinsed repeatedly with distilled water, dried and weighed [12].
RESULTS AND DISCUSSION
3.1 Changes of lignin content in cooking process
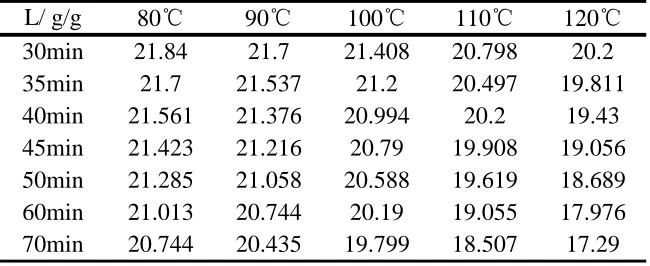
Kinetics experiments are carried out respectively at 80℃, 90℃, 100℃, 110℃ and 120℃ for basic ionic liquid
[NH-(C2H4OH)3]+ cooking rice straw pulping. The percentage changes of lignin quality relatively to dry raw
[image:2.595.145.470.354.487.2]material over time are shown in table 1.
Table 1 Lignin content of cooking process (relatively dry raw material %)
L/ g/g
80
℃
90
℃
100
℃
110
℃
120
℃
30min
21.84
21.7
21.408
20.798
20.2
35min
21.7
21.537
21.2
20.497
19.811
40min
21.561
21.376
20.994
20.2
19.43
45min
21.423
21.216
20.79
19.908
19.056
50min
21.285
21.058
20.588
19.619
18.689
60min
21.013
20.744
20.19
19.055
17.976
70min
20.744
20.435
19.799
18.507
17.29
3.2 Determination of reaction order
Powell method is used to determine the reaction order. According to the theory of reaction kinetics [13-15], the kinetics equation of chemical reaction can be expressed as:
n
kL
dt
dL
=
−
n
≠
1
,t
kL
L
L
n
n n
n
1 0
-1 0 1
1
1
1
− −=
−
−
n=1,
kt
L
L
=
−
0
ln
(1)
where, L—residual lignin content g/g (to dry raw material); t—cooking time, min; k—reaction rate constant;
t
kL
n 10−=
τ
(2)therefore:
α
1
(
1
)
τ
1−
−
=
−
n
n
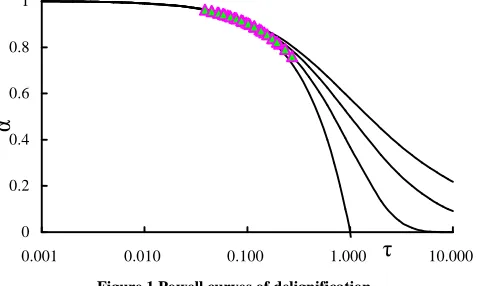
For different reaction orders n, α is calculated corresponding to different τ. α—τ curves are drawn, namely Powell curve as shown in figure 1.
Taking logarithm to equation (2), we have:
t
L
n
k
(
1
)
lg
lg
lg
lg
τ
=
+
−
0+
(3)k, n, L0 are fixed value for a specific chemical reaction, and only time t is variable. Therefore, to determine a
reaction order, just need to measure α and τ under different time. Drawing α—τ curves and making this curve lateral movement a distance. Let the experimental curve overlap Powell curves in the same reaction order, and decide reaction order directly according to Powell curves.
[image:3.595.73.542.320.466.2]Lignin content L and reaction time t, which have been measured in pulping process of wheat straw, are substituted into the above formula (1) and (3). Values of α and τ can be obtained during the process of cooking (see table 2).
Table 2 The value of α&τ of cooking process
τ
α
τ
α
τ
α
τ
α
30
0.039
0.962
0.045
0.956
0.059
0.943
0.088
0.916
35
0.045
0.956
0.053
0.949
0.068
0.934
0.102
0.903
40
0.051
0.95
0.06
0.942
0.078
0.925
0.117
0.89
45
0.058
0.944
0.068
0.935
0.088
0.916
0.131
0.877
50
0.064
0.938
0.075
0.928
0.098
0.907
0.146
0.864
60
0.077
0.926
0.09
0.914
0.117
0.889
0.175
0.839
70
0.09
0.914
0.105
0.9
0.137
0.872
0.204
0.815
110
℃
t/min
80
℃
90
℃
100
℃
After these data are made a drawing, this drawing is translated to figure 1. It is found from figure 1 that the curve from experimental data points is identical perfectly with the Powell curve when n = 1. That explains that this reaction is first order.
0 0.2 0.4 0.6 0.8 1
0.001 0.010 0.100 1.000
τ
10.000 [image:3.595.189.430.521.664.2]α
Figure 1 Powell curves of delignification
3.3 The determination of the reaction rate constant
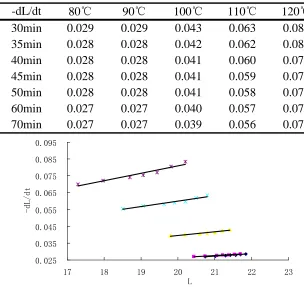
Table 3 The relationship between dL/dt and t during cooking process
-dL/dt
80
℃
90
℃
100
℃
110
℃
120
℃
30min
0.029
0.029
0.043
0.063
0.083
35min
0.028
0.028
0.042
0.062
0.081
40min
0.028
0.028
0.041
0.060
0.077
45min
0.028
0.028
0.041
0.059
0.076
50min
0.028
0.028
0.041
0.058
0.074
60min
0.027
0.027
0.040
0.057
0.072
70min
0.027
0.027
0.039
0.056
0.070
0.025 0.035 0.045 0.055 0.065 0.075 0.085 0.095
17 18 19 20 21 22 23
L
-d
L
/
d
t
Figure 2 The relationship of -dL/dt - L in pulp
The relations of -dL/dt - L can be seen in figure 2, from down to up in turn to 80℃, 90℃, 100℃, 110℃ and 120℃.
[image:4.595.143.468.91.373.2]The linear fitting equations between -dL/dt and lignin content L at different temperatures are obtained by differential processing data in table 4. The fitting coefficients are very close to 1. This proves again that the reaction is first order. When cooking temperature rises, the lignin removal rate constants increase. That is to say high temperature is more conducive to delignification.
Table 4 Regression equations of delignification Reaction Kinetics
T/
℃
Regression equations
R
2
80
-dL/dt=0.0014L-0.0023
0.9425
90
-dL/dt=0.0012L+0.002
0.943
100
-dL/dt=0.0021L-0.0034
0.9408
110
-dL/dt=0.0032L-0.0051
0.94
120
-dL/dt=0.0044L-0.0069
0.9393
3.4 The determination of the activation energy [16]
Relationship between the reaction rate constant k and reaction temperature is consistent with Arrhenius formula,
namely
RT
E
k
k
=
ln
0−
aln
where k—reaction rate constant, min-1; k0—frequency factor, min -1; Ea—reaction
activation energy, kJ/mol; T—reaction temperature, K; R—universal gas constant, 8.314J/(mol﹒K).
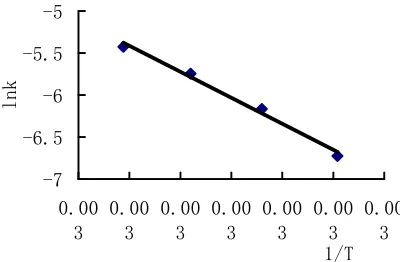
Give up the numerical value of 80 ℃ because of the error. Make lnk linear fitting about 1/T in order to calculate
[image:4.595.172.442.485.588.2]-7 -6.5 -6 -5.5 -5
0.00
3 0.00
3 0.00
3 0.00
3 0.00
3 0.00
3 0.00
3
1/T
l
n
[image:5.595.204.404.78.209.2]k
Figure 3 Relationship of lignin removal rate constant and temperature
CONCLUSION
The percentage changes of lignin quality relatively to dry raw material over time are analyzed by kinetics experiments respectively at 80℃,90℃, 100℃, 110℃ and 120℃ for basic ionic liquid [NH-(C2H4OH)3]
+
cooking rice straw pulping.
The delignification reaction order and activation energy are determined. The results indicate that delignification reaction kinetics of basic ionic liquid [NH-(C2H4OH)3]+ pulping process belongs to first order and its reaction
activation energy is 51.344kJ· mol-1. The linear regression equation is lnk=10.327-6174.2/T, and its fitting coefficientR2=0.9901.
Acknowledgment
This work is supported by the National Natural Science Foundation of China for providing financial support (21176195).
REFERENCES
[1] Y Uraki; Y Sano. Holzforschung, 1999, 53(4): 411-416.
[2] J Kajimoto; Y Sano; WE Widodo; et al. Kami Pa Gikyoshi/Japan Tappi Journal, 2000, 54(9): 88-93. [3] T Kishimoto; A Ueki; H Takamori; et al. Holzforschung, 2004, 58(4): 355-361.
[4] JS Wilkes. Green Chem, 2002, 4(2): 73-80.
[5] B Li; I Filpponen; DS Argyropoulos. Industrial & Engineering Chemistry Research, 2010, 49(7): 3126-3136.
[6] YJ Xu; J Wang. China Pulp & Paper, 2011, 29(06): 46-48.
[7] RX Li; JJ Wang. Chemical Industry and Engineering Progress, 2002, 21(1): 43-48.
[8] N Shun. Shandong Chemical Industry, 2008, 37(2): 26-29.
[9] T Welton. Chemical Review, 1999, (99): 2071-2083.
[10] XH Li; DB Zhao; ZF Fei; LF Wang. Science in China(Series B:Chemistry), 2006, 36(3): 181-196.
[11] SL Shi; FW He. Analysis and Detection of Pulp and Paper, 1st Edition, China Light Industry Press, Beijing,
2003, 28-45.
[12] LG Tong; Q Lu; YQ Yang. Journal of Cellulose Science and Technology, 2008, 16(2): 18-28.
[13] J He; Z Liu. China Pulp & Paper, 2011, 30(6): 41-46.
[14] GQ Huang; YW Shi. China Pulp & Paper, 1986, 5(3): 35-40.
[15] SV Singh; AR Raiak. IPPTA, 1998, 10(3): 75-80.