warwick.ac.uk/lib-publications
Original citation:
Harvey, Carlo, Bashford-Rogers, Thomas, Debattista, Kurt, Doukakis, Efstratios and Chalmers,
Alan. (2017) Olfaction and selective-rendering. Computer Graphics Forum
Permanent WRAP URL:
http://wrap.warwick.ac.uk/92200
Copyright and reuse:
The Warwick Research Archive Portal (WRAP) makes this work by researchers of the
University of Warwick available open access under the following conditions. Copyright ©
and all moral rights to the version of the paper presented here belong to the individual
author(s) and/or other copyright owners. To the extent reasonable and practicable the
material made available in WRAP has been checked for eligibility before being made
available.
Copies of full items can be used for personal research or study, educational, or not-for profit
purposes without prior permission or charge. Provided that the authors, title and full
bibliographic details are credited, a hyperlink and/or URL is given for the original metadata
page and the content is not changed in any way.
Publisher’s statement:
"This is the peer reviewed version of the following Harvey, Carlo, Bashford-Rogers, Thomas,
Debattista, Kurt, Doukakis, Efstratios and Chalmers, Alan. (2017) Olfaction and
selective-rendering. Computer Graphics Forum which has been published in final form at
http://doi.org/10.1111/cgf.13295
. This article may be used for non-commercial purposes
in accordance with
Wiley Terms and Conditions for Self-Archiving
."
A note on versions:
The version presented here may differ from the published version or, version of record, if
you wish to cite this item you are advised to consult the publisher’s version. Please see the
‘permanent WRAP URL’ above for details on accessing the published version and note that
access may require a subscription.
Volume 0(1981),Number 0 pp. 1–12 COMPUTER GRAPHICSforum
Olfaction and Selective-Rendering
Carlo Harvey1, Thomas Bashford-Rogers2, Kurt Debattista3, Efstratios Doukakis3and Alan Chalmers3
1Birmingham City University, School of Computing and Digital Technology, UK. 2UWE Bristol, Computer Science and Creative Technologies, UK.
3
University of Warwick, Warwick Manufacturing Group, UK.
Abstract
Accurate simulation of all the senses in virtual environments is a computationally expensive task. Visual saliency models have been used to improve computational performance for rendered content, but this is insufficient for multi-modal environments. This paper considers cross-modal perception and, in particular, if and how olfaction affects visual attention. Two experiments are presented in this paper. Firstly, eye tracking is gathered from a number of participants to gain an impression about where and how they view virtual objects when smell is introduced compared to an odourless condition. Based on the results of this experiment a new type of saliency map in a selective-rendering pipeline is presented. A second experiment validates this ap-proach, and demonstrates that participants rank images as better quality, when compared to a reference, for the same rendering budget.
Categories and Subject Descriptors(according to ACM CCS): I.3.3 [Computer Graphics]: Picture/Image Generation—Viewing
Algorithms I.4.8 [Computer Graphics]: Image Processing and Computer Vision—Scene Analysis - Object Recognition I.4.8 [Computer Graphics]: Image Processing and Computer Vision—Scene Analysis - Tracking
Keywords:Multi-Modal, Cross-Modal, Saliency, Olfaction, Graphics, Selective-Rendering
1. Introduction
A major research challenge of Virtual Environments (VEs) is to accurately simulate real world environments. This is motivated by the increasing use of VEs in a wide range of applications
such as concert hall and architectural design [Dal,Nay93],
simula-tion and training, and immersive video games [MBT∗07,RLC∗07,
GBW∗09]. Multisensory VEs aim to deliver more sensory
informa-tion and yield an increased sense of immersion and accuracy over
single modality environments [DM95], but multisensory VEs have
inherent perceptual affects that have to be understood [AMMG16].
Furthermore, such multisensory VEs can aid object recognition and placement; identification and localisation; and generating
conclu-sions pertaining to the scale and shape of the environment [Bla97].
Multisensory VEs can be very computationally complex due to
having to simulate all senses [GTLG14], however, limitations of
the human sensory system can be used in order to improve the performance of rendering systems by computing certain senses at lesser quality. Examples of this being used to decrease the
au-ditory [TGD04,MBT∗07] or visual [RCHR07,CCL02,RFWB07,
RBF08] rendering complexity with little or no perceivable quality difference to a user have been implemented and verified. More-over, it has been shown that it is possible to increase the perceptual quality of a stimulus in one modality by directing gaze due to the
introduction of another modality [MDCT05]. This can be used for
improving the perception of a material’s quality [BSVDD10] or for
Level-of-Detail (LOD) selection [BCB∗09b,GBW∗09,RKH∗13].
1.1. Smell and Attention
The sense of smell, olfaction, is a major sense of humans. Smell has been linked with influencing mood, emotion, memory, social
behaviour and even partner choice [Jac07]. Despite this, smell has
largely been omitted from VEs, waiving the role it plays in human behaviour.
It has been well established that visual cues have a marked
ef-fect on improving olfactory performance. Zellner [ZBE91]
demon-strated that odours matched appropriately with a colour were
rated more pleasant than inappropriately matched odours. Sakaiet
al.[SIS∗05] showed that watching congruent pictures had the
ef-fect of increasing the pleasantness and also odour intensity as
op-posed to incongruent picture matching. Seignuricet al.[SDJ∗10]
explored the influence of prior learned associations between an odour and a visual stimulus naturally associated with that odour on eye saccades and fixations. They showed that the odour-related visual cue was explored faster and for a shorter time in the
pres-ence of a congruent odour. Harveyet al.[HBRDC11] introduced an
saliency maps for vision in the spatial domain no longer can be
re-lied upon in the same way. Chenet al.[CZC∗13] later performed a
similar study to further corroborate this effect stating, “Our discov-eries provide robust empirical evidence for a multimodal saliency map that weighs not only visual but also olfactory inputs.”
Some research has investigated the influence of olfactory cues on visual attention. For a recent overview of bottom-up and top-down
attention, see the work by Katsuki and Constantinidis [KC14]. One
study presented by Millotet al.has shown smell can impact
partic-ipant behaviour towards visuals [MBM02], in that ambient smell
produced a faster response to a visual stimuli in a sensory-motor
task than a condition with no ambient smell. Knasko [Kna95]
showed participants looked longer at slides in the presence of a pleasant odour such as baby powder and chocolate than with no
odour present. Seoet al. [SRMN10] extended this by showing a
distinct effect of congruency upon viewing time and in addition ex-plored where eyes fixated, given congruent and incongruent images as a visual stimulus.
While prior research investigates perceptual effects, in every in-stance this ignores the effect of visual saliency on the study and does not consider the application to the field of computer graphics. Whilst the work implies a conditioning to smell congruencies it ignores the possibility results could be inspired by a biological
pre-disposition underbottom-upconditions to spend more time
attend-ing that particular congruent feature presented than another slide presented asynchronously. We investigate this possibility and em-ploy the findings into a rendering pipeline.
In this paper we propose a general algorithm to combine olfactory saliency with visual saliency in the spatio-visual domain. In particular, this paper considers the effect of introducing an olfactory stimulus to a VE, on a user’s visual attention towards imagery. Based on eye tracking data from an experiment, new saliency maps are derived. These are used to reduce render times while maintaining perceptual equality. This is validated in a fur-ther experiment. Specifically, we make the following contributions:
• Quantification of the area of influence and weighting strategies
to guide attention in images when a congruent smell is present.
• A general framework to generate olfactory saliency maps.
• Combination of the traditional visual saliency map with the
ol-factory saliency map into a multi-modal saliency map. This is used to reduce rendering time in this paper. The technique could be more broadly applied to any olfactory-visual interface.
• An experiment which validates the use of the multi-modal maps
to reduce rendering time, but maintaining similar perceptual quality to reference images computed at higher sampling rates.
2. Experiment 1: Data Capture
The effect of olfaction on saliency combined withbottom-upvisual
attention has not been investigated. In order to create a rendering framework; both need to be considered for VEs. The aim of this initial experiment is to investigate the effect of smell congruencies
on visual saliency in VEs; to identify and quantify thebottom-up
conditions that cause more time being spent attending that partic-ular congruent feature. This section describes the methodology of
the first experiment, designed to understand whether smell affects visual attention and if visually salient objects affect this process also. The data capture and results of the experiment are used to develop a novel selective-rendering approach which addresses the need for a framework and a more general heuristic for the work to be more readily applicable to image rendering.
2.1. Design
The experiment design required participants to view a series of vi-sual stimuli while being exposed to an odour condition. Since there
are results [SRMN10,SDJ∗10,ZBE91,Kna95,HBRDC11] that
sug-gest a link between visual attention and congruent smells, a
repli-cation of the result shown in [SDJ∗10] was considered and
aug-mented with a study of what role visual saliency plays in this ob-served effect. The work presented in this paper extends and further
builds upon this augmentation by Harveyet al.[HBRDC11] by
re-analysing the findings (Section3.2) and subsequently evaluating
the suggested approach (Section5).
The experiment presents four concurrent stimuli in a slide, one in each quadrant. Three of the four stimuli (apple, banana, or-ange), have a congruent smell associated with them while the fourth
(liquorice or strawberry termedvariable) does not.
Two independent variables were used in a 2 (saliency) × 3
(smell) design. The first,saliency, denotes whether one of the visual
stimuli was more salient than the others in the presented stimuli. To
achieve this the two sets of stimuli were created, one where
vari-ablewas set to liquorice, the non-salient condition, and, the salient
condition consisting of a strawberry replacing the liquorice. The images were specifically chosen to have similar saliency besides thevariablefactor between the two sets.saliencywas a between-participants variable in order to avoid between-participants having to repeat the experiment with only slight modifications.
The second independent variable was the odour conditionsmell
which was composed of three possible states no smell,
congru-ent smell and non-congrucongru-ent smell.smellwas a within-participants
variable in which all participants experienced three smells, one for each of the related stimuli, apple, banana, and orange and a non-smell case.
The dependent variable was the time the eye tracker detected that the participant spent in the quadrant corresponding to one of the visual stimuli.
A number of hypotheses were considered based on the literature.
Ha:the saliency and non-saliency conditions would produce
differ-ent results and the object which is more visually salidiffer-ent would have
an effect on visual attention.Hb:the stimuli associated with the
congruent smell would be the one most attended to.
2.2. Materials
2.2.1. Visual Saliency Choice
Predictors of visual attention are used throughout this work for
set-ting thesaliencyvariable in this experiment and, subsequently, used
in the design and evaluation of the selective renderer. The Itti and
been used as an accepted benchmark of visual prediction metrics in the field of VEs for a number of years. The implementation of this algorithm used throughout was that of the freely available open source code developed by the iLab Neuromorphic Vision
Labora-tory of University Southern California [iLa].
2.2.2. Stimuli
The experiment used two sets of images, for each of the two
con-ditions in thesaliencyvariables. One set had an image with higher
visual saliency and the other set had an image with a lower saliency; strawberry and liquorice respectively.
The other images for the remaining three quadrants were con-stant between sets: apple, banana and orange. The four images from each image set was displayed on the screen in random quadrants. Images for a slide were assigned a random quadrant until all images for the slide were assigned a unique quadrant. For a slide set (four slides), this process was repeated four times. One possible
combi-nation for a higher saliency image set slide is shown in Figure2.
The reason for the randomness was in an attempt to mitigate the experiment learning effect whereby participants start to be able to predict the slides to be delivered.
Besides thevariablefactor between the two sets, the images had
similar saliency. As one can see from the saliency map of the slide
in Figure2; the strawberry comes out on top in a winner-takes-all
combination of the local intensity, colour and orientation feature
maps. A basic quantitative measure,SV, was used to represent the
saliency of the images. This entailed a heuristic of summing the normalised saliency map pixel intensity values for the relevant slide quadrant and dividing this by the area of pixel space occupied in the quadrant by values greater than zero (i.e. non-white space), this is
shown by Equation1.
SV =
1 i
x=w,y=h
∑
x,y=0IV(x,y) where, i=
x=w,y=h
∑
x,y=01IV(x,y)>0 (1)
whereIV is the image matrix for the visual saliency operator,x,y
are pixel coordinates andw,hare the width and height of the image
respectively.
2.2.3. Equipment
An eye tracker was used to record the participants’ eye movements. The model used was a faceLAB 5 by Seeing Machines; a passive measuring device with no extraneous materials connected to the participant. This system provided real time blink, saccade and fix-ation estimates.
The smell delivery system used was a Vortex Activ produced
by Dale Air [Act10]. This device has four fan emission chambers
which are programmable via a micro controller to guide chamber impulse onset, duration and which chamber in the device to fire. Polytetrafluoroethylene (PTFE) tubes were used to minimise the effect of adsorption of smell molecules onto the surface of the in-ner tubing which could bias subsequent data collection as partici-pants went through the experiment. Tubes were blown clear before and after each participant for a period of 10 minutes, as well as an
empty chamber pumping air during the experiment when a smell chamber was not firing. In addition to this, during experiment down time, room fans and a room neutral deodorant were used in order to minimise discrepancies between subsequent datasets. The air con-ditioning in the room acted to ventilate the area so as not to start a subsequent experiment in a contaminated environment. A Neu-tradol room neutral deodoriser was left in the room overnight so any lingering molecules would bind with the substrate and not linger on surfaces that could be excited during new experiment setup. In ad-dition, this negated the minimal effect the passive air flow in the room could have on exciting the emission chambers. The monitor used for display was a 37" LCD display.
2.2.4. Setup
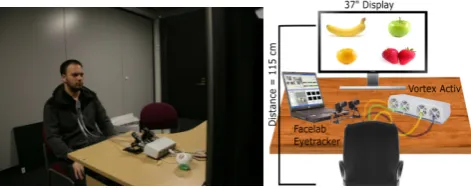
Experimental setup and placement is shown in Figure1. The
par-ticipant was sat on a chair, with the backrest of the chair 115cm from the display. One metre long PTFE tubes were drawn from the device chambers and clipped to the top of a participant’s collar. The
monitor was set at a 1280×1024 resolution (images displayed
cor-responded to this resolution). The distance between equipment was constant between participants and controlled as such.
Figure 1: (l): Experimental setup photograph. (r): Figurative ex-perimental setup schema.
2.3. Procedure
Participants were told the following, “You are asked to free-view the image presented on the screen in front of you. Your eye move-ments will be recorded during the period in which you are viewing the screen.”
[image:4.595.316.552.346.440.2]Figure 2: (l): A possible combination of images for a slide presented to a participant. Slide from the salient image set. (r): Saliency map for the slide shown.
2.4. Participants
A total of 30 participants took part in this experiment, 21 males and 9 females. 15 were assigned to the salient image set and 15 to the non-salient image set. Participants had an average age of 26.7. A participant selection criteria for progression to the study was un-dertaken, the participant had to indicate that they had normal or cor-rected to normal vision at the time of testing. In addition, the par-ticipants had to report no anosmia. Participation in this study was voluntary, recruitment to this study was facilitated through email and the sample was drawn from staff at students at a UK university.
3. Results
This section provides an overview of the timings and provides sta-tistical analysis of the results.
3.1. Timings
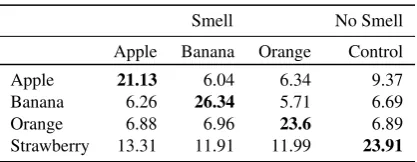
The average time spent in a quad region for each smell condition
is shown in Table1and Table2for saliency and no saliency
con-ditions respectively. Not every column total will sum to 60s, the duration of a slide, due to lost tracking data or time spent gaz-ing outside slide screen boundaries. However, time spent within the salient region decreases when the smell condition is presented asynchronously with a congruent object. In addition time spent viewing the congruent object with the smell conditions is in-creased drastically under both image sets. When no-smell condi-tion is present there is no smell congruency; as such standard vi-sual saliency predictive metrics prevail and the strawberry is most
viewed. As can be seen in the control column of Table2, the
aver-age time is balanced between quadrants.
Smell No Smell
Apple Banana Orange Control
Apple 21.13 6.04 6.34 9.37
Banana 6.26 26.34 5.71 6.69
Orange 6.88 6.96 23.6 6.89
[image:5.595.64.287.81.167.2]Strawberry 13.31 11.91 11.99 23.91
Table 1: Average gaze time (in s) within each quadrant for the salient image set under each odour condition. Largest values per smell condition emboldened.
Smell No Smell
Apple Banana Orange Control
Apple 20.38 9.29 11.9 10.22
Banana 11.45 23.2 9.11 14.18
Orange 11.24 9.24 20.81 12.10
[image:5.595.68.277.586.667.2]Liquorice 10.9 9.90 9.92 13.60
Table 2: Average gaze time (in s) within each quadrant for the non-salient image set under each odour condition. Largest values per smell condition emboldened.
3.2. Statistical Analysis
Analysis is conducted via a repeated measure ANOVA via a 2
(saliency)×3 (smell) factorial design. In order to analyse the data
the congruent and non-congruent smell conditions are collapsed to enable direct comparison with the no-smell condition.
3.2.1. Overall Results
The main effect ofsaliencywas significant F(1, 28) = 5.38, p<
0.05, indicating a difference in results across the two groups. The salient condition was attended to for an average of 18.62s compared to the non-salient at 15.48s across all other conditions, for the
vari-able quadrant. This indicates acceptance ofHa:that the saliency
and non-saliency conditions would produce different results with the salient object having an effect on visual attention.
The main effect of smell did not violate the assumption of
sphericity (via Maulchy’s test, p>0.05) and was found to be
sig-nificant F(2, 56) = 35.6 , p<0.01. The means of the three
condi-tions were: no smell = 18.99s, congruent = 22.94s, non-congruent
= 9.23s. This allows us to acceptHb:that the stimuli associated
with the congruent smell would be the one most attended to.
Pairwise comparisons, with Bonferroni correction, found signif-icant differences between the non-congruent case and both the no smell and congruent case. No differences were noted between the no smell and congruent conditions. For pairwise comparisons when there is a higher saliency object as the between participant vari-able there is no significant difference between Congruent Smell and No Smell control conditions; indicating that a highly salient object without an identifiable smell and a normal object with a related smell are equally attractive.
The interaction ofsaliency×smellwas also analysed. It did not
violate the assumption of sphericity (via Maulchy’s test, p>0.05)
and was considered significant F(2,56) = 6.41, p<0.05. Figure
3shows this interaction; it is clear that the no-smell condition is
strongly affected by the saliency and no saliency condition, which
produces the significant interaction. This also concurs withHa.
The results for the salient and non-salient conditions are anal-ysed separately in the following.
3.2.2. Results for non-salient condition
For the non-salient condition of thesaliencyvariable, the results are
No Saliency Saliency No Smell 14.0783 23.9129 Congruent 22.2858 23.5918 No Congruent 10.0807 8.3773
8 10 12 14 16 18 20 22 24
Esti
m
ate
d
M
ar
gi
n
al
M
e
an
[image:6.595.67.281.79.202.2]s
Figure 3: Interaction ofsaliency×smellshowing the effect the
salient image factor has on the no-smell condition across sets.
The assumption of sphericity was not violated (via Maulchy’s test,
p>0.05) and the main effect of smell was significant F(2, 28) =
17.38, p<0.01. The means of the three conditions were: no smell
= 14.08s, congruent = 22.29s, non-congruent = 10.08s.
Pairwise comparisons, using Bonferroni corrections, give signif-icant differences for congruent smell against both the other two conditions, while, there was no significant difference between the no smell and non-congruent smell conditions. This indicates that if none of the objects are strongly salient then the smell congruency dominates the visual field.
This correlates with the results reported by Seo et. al.
[SRMN10]. They found that when participants were exposed to an olfactory stimulus, they focused significantly more often and longer at the congruent object among the four different objects being dis-played, as compared to a non-odour condition.
3.2.3. Results for Salient condition
For the salient condition of thesaliencyvariable, results follow a
similar pattern for the non-salient condition but with a change in the pairwise comparisons discussed below. Analysis was performed via repeated-measures ANOVA for the smell variable. The assumption
of sphericity was again not violated (via Maulchy’s test, p>0.05)
and the main effect of smell was significant F(2, 28) = 23.46, p<
0.01. The means of the three conditions were: no smell = 23.91s, congruent = 23.59s, non-congruent = 8.38s.
Pairwise comparisons, with Bonferroni correction, demonstrated a significant difference between the non-congruent smell condition and the other two conditions; this is in contrast to the saliency case and further supports the results of the interaction seen in the overall results indicating that saliency and congruent smell do affect visual attention. The pairwise comparisons can be seen more clearly in
Table3.
3.3. Gaze Point Analysis
3.3.1. Density Estimation
Gaze points within the area of interest for the pertaining smell con-dition, after density estimation on the set of gaze points, appear to be modulated by a standard visual saliency model; as seen in
Fig-ure4. However, on top of being modulated by visual saliency it
Condition p, df=2
non-saliency <0.05 congruent no smell non-congruent
saliency <0.05 no smell congruent non-congruent
overall <0.05 congruent no smell non-congruent
Table 3: Pairwise comparisons for the various conditions. The sta-tistical groupings are discerned by the encircling - circled groups are not significantly different.
also overrides the standard visual saliency predictor that stipulated the strawberry would have been the region of most interest; which was the case under the control condition. In combination with the
results presented in Table3this shows a new model is needed for
saliency when there are olfactory stimuli present in VEs because both saliency and congruent smells do affect visual attention. Cur-rent models do not support this perceptual interaction.
Figure 4: Top Row: Saliency maps for smell emitting images used in the slides: (l) Apple, (m) Banana, (r) Orange. Bottom Row: The corresponding density estimation of the gaze points collected on the smell emitting visual congruency. Kernel density estimation was
used to perform this summation, a kernel window ofh=50 pixels
was used in this case.
4. Selective-Rendering for Visual Attention
One of the main themes in the field of Computer Graphics is the generation of images of VEs. The classic approach to this prob-lem is to model the VE using a selection of primitives with surface properties assigned to each primitive of the scene. In addition, it is necessary to specify the position and properties of any light sources which contribute to the radiometric quantities associated with the VE. Images of this virtual scene can then be generated by ray trac-ing onto the primitives of the VE through an image plane that takes into account a camera model and determining the colour of each image pixel in this plane using the assigned surface properties and the specified lighting for a given scene. This process is known as rendering.
[image:6.595.316.556.308.428.2]Selective-rendering strategies are varied and diverse and are de-signed to address a particular aspect of the rendering pipeline. There is a need to compute certain, more relevant areas of an im-age, at a higher level of fidelity. These areas may be due to per-ception or because geometry introduces extra rendering complex-ity. To achieve a converging approximation of the rendering
equa-tion [Kaj86] at a certain point requires many samples and
selective-rendering algorithms have been deployed successfully to this task. Many selective-rendering algorithms have been published in re-cent years (for a detailed overview of selective-rendering strategies
see [Deb06]). One of the methods of analysing their performance
for suitability, particular in the case of application to a perceptual artefact, is through psychophysical experiments to compare the al-gorithms against the real scenes they are purporting to depict. This section presents the method used to attenuate a conventional image
saliency map based upon the observed data shown in Section2.
4.1. Weighting Function
The recorded gaze points fit a normal distribution. Extracting a matte of a smell emitting object from the scene gives a binary pre-dictor of the visual focus for the smell emitter in the scene. This should be modulated by the variance in attention to the smell emit-ter in the scene. This is done to match the normal distribution in gaze pattern observed from the measured data. The standard
devia-tion from the measured eye track data points is used as theσin the
input to a gaussian kernel: 21
πσ2·e
−(x−µ2)
2σ2 . This gives a predictor of
the area of influence of the smell attention deviation. This area of influence corresponds, from the measured eye-tracking data, to 63 pixels. From the viewing distance of 115cm and the correspondent
screen space of 63 pixels the visual degrees for theσvalue of this
area of influence corresponds to4.7◦.
Convolving the binary predictor of the visual focus for the smell emitter in the scene with the data-driven Gaussian kernel yields an estimator for the visual focus for the smell emitting object. This is
represented as a smell matte gaussian blur,IS, in Equation2.
Mul-tiplying this with the original visual saliency map for the scene,IV,
and subsequently normalising gives a reattenuation factor for the original saliency for the scene. Added to the original map guided
via a weighting function (Equation2), yields a new model for
vi-sual saliency when a smell emitting object is present.
These spatial saliency maps which account for smell congru-encies, termed olfactory-visual saliency maps, can be used in selective-rendering pipelines to act as a predictor for the visual at-tention to a scene when a smell emitter is present. The model for
olfactory-visual saliency maps,IO, is one to attenuate conventional
saliency maps of a given scene,IV, via the modulated matte,IS.
IO= (1−w)norm((max((IV−IS),0)) + (w)norm((IV◦IS)) (2)
wheremax(·)andmin(·)are functions to determine the respective
maximum and minimum value of the image arrays,norm(·)is a
normalisation procedure to normalise the resultant image arrays
be-tween 0 and 1. For clarity,◦is the Hadamard product. Section3.2
shows that when participants were exposed to an olfactory
stim-ulus, they focused significantly more often and longer at the con-gruent object among the four different objects being displayed, as compared to a non-odour condition. Determining an appropriate
measure for the weightwis critical to test mapping the observed
findings to a perceptually based system. The weight (w) in
Equa-tion2is set as the ratio of the time spent looking at the smell
con-gruency, versus the total time spent looking at the rest of the image, weighted by their respective screen real estate and saliency
mea-sure,SV, (Equation1). This, when averaged over all participants,
gave a valuew=0.621.
4.2. Modal Map Generation
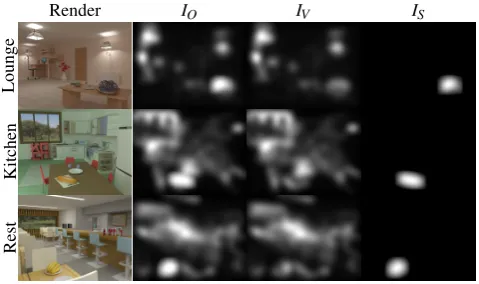
Figure 5shows the rendered image of the VE, olfactory-visual
saliency map, visual saliency map and the smell gaussian blurs for the Lounge, Kitchen and Restaurant scenes. The reweighting
strat-egy adopts the pipeline outlined in Section4.1and Equation2and
can be seen visually in Figure5.
Render IO IV IS
Lounge
Kitchen
Rest
Figure 5: Render (left): Output rendered image of the virtual
scene usingIO as the guide for the selective sampling strategy,
olfactory-visual saliency map:IO(centre-left), visual saliency Map:
IV (centre-right) and smell gaussian blurs:IS(right) for the three
scenes. (top to bottom): Lounge, Kitchen and Restaurant scenes.
5. Experiment 2: Application
This section presents the description of a second psychophysical experiment that aims to compare two frequently used
selective-rendering operators against the algorithm reported in Section4.1.
The purpose of this investigation is to determine which technique appears closest to a reference in terms of the participant comparison judgement.
5.1. Design
The experiment was conducted on 28 participants and as such the
scale of the test was not one that suited rating data [SC88].
Addi-tionally, if participants have not been trained prior to the experi-ment on a series of test images the data becomes unreliable as it is not certain the participant was making informed choices or simply
guessing [Ken75]. Due to the nature of the task proposed, to avoid
methods such as rating or ranking which have problems associated
[image:7.595.314.554.289.431.2]subject with a pair of rendered images, A and B, in addition to a ref-erence image, G. This allows the participant to make a decision as to which image produced with a given selective-rendering strategy is closer to G. Specifically, the participants are not presented with the A or B image concurrently, but subsequently, this is referred to as two-interval forced choice (2IFC) assessment.
Each participant was assigned 9 image sets, 3 for each scene
(shown in Table4), in random order and the A or B image was
[image:8.595.332.536.220.349.2]ran-domised within that image set. Participants were presented slides in
the order A|B→G→A|B with a decision slide that waited for an
in-put as to a decision:“which slide A or B is closest, in your opinion, to slide G?”. The experiment asks the participants to select which image was overall the most like a reference image (overall similar-ity). This technique is known as paired-comparisons. The advan-tage of this approach is not only simplicity, but it allows an evalua-tion of the transitivity, that is, the within-subject consistency of the data, as well as the between-subject consistency. The selection of a range of test scenes is of particular import to this investigation, to eliminate scene dependance.
5.2. Materials
5.2.1. Stimuli
5.2.1.1. Rendered Images The experiment used 9 image sets, 3
for each scene. The conditions tested are highlighted in Table4.
A|B G A|B
Uniform Reference Visual Saliency
Uniform Reference Olfactory-Visual Saliency
Visual Saliency Reference Olfactory-Visual Saliency
Table 4: Smell: Experimental Conditions Tested
In total three selective-rendering algortihms were used:
uni-form(Uni), a naive algorithm that samples each pixel in the scene
equally based on some overridingrendering cost function;visual
saliency(Sal), as first inspired by Yee et al. [YPG01] this method uses a map of visual feature predictions to guide the pixel sampling strategy where the most samples are directed towards the area of
the map deemed to be most visually important; andolfactory-visual
saliency(SmSal), the modulation of visual saliency for when their is a congruent smell present is used to guide the pixel sampling strategy in the rendering pipeline.
The scenes were engineered to contain a variety of conditional heuristics to adhere to: smell congruency and naturally more dom-inant salient features. The scenes are termed Lounge, Kitchen and Restaurant. Presenting participants with visual cues under differ-ent smell conditions, the experimdiffer-ent observes whether or not tra-ditional saliency models of visual feature prediction can be added to for another sensory stimulus (olfactory) in a selective-rendering context.
5.2.1.2. Render Cost Function: In a selective-rendering pipeline given a map as a heuristic to weight the sampling strategy; a cost to
compute an image in terms of the degree of sampling used can be given as:
V= w
∑
x=0h
∑
y=0smin+ ((smax−smin)·sal(x,y)) (3)
whereV is the number of samples required to compute an image,
sminis the minimum number of samples used to calculate radiance
through a pixel,smaxis the most number of samples used to
calcu-late this,sal(x,y)is the weighting coefficient for a specific pixel in
image space, andxandyare pixel coordinates.
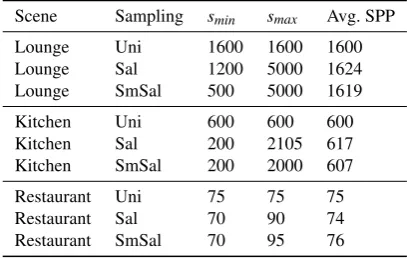
Scene Sampling smin smax Avg. SPP
Lounge Uni 1600 1600 1600
Lounge Sal 1200 5000 1624
Lounge SmSal 500 5000 1619
Kitchen Uni 600 600 600
Kitchen Sal 200 2105 617
Kitchen SmSal 200 2000 607
Restaurant Uni 75 75 75
Restaurant Sal 70 90 74
Restaurant SmSal 70 95 76
Table 5: Render Cost Function Across Scenes. Avg. SPP (Samples per pixel) is the average number of samples used to generate an image, dictating complexity.
To investigate the perceptual difference between two selective-rendering strategies it is necessary to control this render cost func-tion so that, given a number of samples to generate each image,
V, an optimisation process starts to varysminandsmax such that
(S≈V)±fwherefis some user defined control of sufficient
lee-way to compensate for the fact thatsminandsmaxare restricted to
integers in the optimisation process andSis the actual number of
samples used in the generation of the image.
Varying render cost functions were used to investigate if the
tech-nique was applicable generically or not. Table5shows the various
smin,smaxfor the various sampling methods used.
5.2.1.3. Olfactory Stimuli The smells were delivered through the Dale Air Vortex Activ emission system via micro controller. How-ever smells are not standardised or controlled and one smell pur-porting to smell like one thing may not necessarily be the case. Presented olfactory stimuli were analysed using Gas Chromatog-raphy Mass Spectrometry (GCMS), the various synthetic Volatile Organic Compounds (VOCs) used in this experiment were com-pared to a collection of real VOCs to provide similarity data. The method used follows after the ISO standard developed and outlined in [War04]. This was done in the case of the lavender smell; the other smells delivered, bread and banana, also had their makeup analysed but are not presented here for brevity. The setup for
col-lection of VOCs is shown in Figure6.
Figure 6: Real (l) and schematic (r) diagrams highlighting the col-lection mechanism for VOC’s, synthetic and real, through the tenax tubing.
at 10.3 ml/min. This volatile compromised air was drawn through the collection tubes at a controlled rate of 100 ml/min, roughly 12 cm (the average distance in the experiments from the end of the PTFE tubes and a participant’s nostrils) above the delivery tubes. For the real collection instead of the end of the delivery device 12 cm below the collection tubes a cutting of lavender was lo-cated into the clamp and the same procedure was followed of 6 minute exposure to the unsealed tenax tube. Once the collection was completed the tenax tube was sealed air tight with a clamp-ing lock. The tenax tubes were parsed through GCMS. There was a similarity between real and synthetic measurements of all col-lected VOCs. For example, in the case of the lavender real and syn-thetic captures, there existed similar molecular abundance peaks of Toluene-d8 (9.785s), Butanamide (17.434s) and Phthalic acid, butyl isohexyl ester (27.815s).
5.2.2. Equipment
The equipment used in this experiment is the same as that presented
in Section2.2.3minus the use of the eye tracker. The smell delivery
system used was a Vortex Activ produced by Dale Air. This device has four fan emission chambers which are programmable via a mi-cro controller to guide chamber impulse onset, duration and which chamber in the device to fire. PTFE tubes were used to minimise the effect of adsorption of smell molecules onto the surface of the inner tubing which could bias subsequent data collection as partici-pants went through the experiment. Tubes were blown clear before and after each participant, as well as an empty chamber pumping air when a smell chamber was not firing. In addition to this, during experiment down time, room fans and a room neutral deodorant were used in order to minimise discrepancies between subsequent
data sets. The resolution of the LCD panel was 1024×768 at 60
Hz and images were computed at this resolution.
5.2.3. Setup
Experimental setup and placement is shown in Figure 1. The
par-ticipant was sat on a chair, with the backrest of the chair 115cm from the display. One metre long PTFE tubes were drawn from the device chambers and clipped to the top of a participants collar. Setup ensured that each participant’s eyes were aligned with the centre of the screen, which was achieved by adjusting the height of the chair they were sitting on. The experiment was conducted in a dark room to avoid any effects of ambient lighting and participants were allowed time in order to adjust to the environment for 5 min-utes before commencing the actual experiment. Slide presentation
order and location (A or B) were randomised to remove any order-ing bias. The time allowed to make a choice between the rendered images was 5 seconds which was decided after a pilot study to de-termine the time required to make a quality difference judgement accurately. It is important to allow the same amount of time for each participant and it should be long enough for the participant to make an informed choice without being able to over analyse. The partic-ipants were briefed prior to the experiment in order to gain a clear understanding of their task and the experiment did not proceed until this was certain.
5.3. Procedure
Image slides were presented synchronously with the smell cues for a total of five seconds slide exposure. Buffer slides, providing in-formation as to the current slide were present for two seconds in between the image slides and the decision slide was present for a minimum of ten seconds to provide a buffer for nose desensitisa-tion after olfactory stimulus. The experiment lasted an average of 12 minutes per participant. Smells used in this experiment were lavender, crusty bread and banana; the fourth chamber on the emis-sion device was kept clear to provide a means to push through clean air into the nostrils. Smells were delivered to the participant for the
full duration of the relevant slides. Figure7shows the ordering of
the buffer and image slides used in the experiment and indicates
slide timings. Table6highlights the different smells used on a per
[image:9.595.329.546.411.461.2]scene basis.
Figure 7: Experimental Image Slide Ordering.
Scene Smell
Lounge Lavender
Kitchen Crusty Bread
Restaurant Banana
Table 6: Smells used per scene
5.4. Participants
A total of 28 participants took part in this experiment, 21 males and 7 females. Selection criteria, participation and recruitment is
the same as of that in Section2.4. The age range of participants was
between 21 and 42, with an average age of 27. Each participant was
presented with all of the scenes, thus looking at a total oft(t−21)·3=
3(2)
5.5. Analysis
The analysis of the participants’ judgements was performed with a balanced design paired-comparison test[KBS40], where each sub-ject was instructed to evaluate all possible comparison pairs taken from the test set. This enables the evaluation and comparison of the
performance of each test subject.tis given as the number of scenes
rendered with different selective criteria that are to be compared against each other against the reference rendered image. For any
given scene, each participant was presented(t2) =3 pairs t(t−21),
all possible combinations of rendering strategies to be compared.
For each comparison pair, the participant’s choice was recorded. Once all of the pairs have been presented, the results from the
par-ticipant’s choices are recorded in at·tmatrix. An example of this
matrix is shown in Table7. Denotepias the number of preferences
scored by Testiwherei∈1,2. . .t, then the overall score per
con-dition per subject is given as:
t
∑
i=1pi=
t(t−1)
2 =3 (4)
The votes for all s participants conducting the
pairwise-comparisons are combined into a summed preference matrix per rendering condition. If all of the subjects completely agreed in their
paired-comparisons, thent(t−21)matrix entities would have a value
ofsand the remaining entities would have a value of 0. Note that
the central diagonal is never considered since the same image is not pair compared against itself, yielding a value of 0 for the applicable section of the preference table.
Test 1 Test 2 Test 3 Score
Test 1 * 0 0 0
Test 2 1 * 0 1
[image:10.595.352.553.496.553.2]Test 3 1 1 * 2
Table 7: Example preference matrix for one subject when shown three rendered images of a given scene. Each rendered image is presented in a row, Tests in a row are compared with another Test in each column.
The overall similarity results for the 3 scenes are shown in Tables
8,9and10. The paired-comparison data is provided in Table12
and coloured rings highlight the perceptual grouping that exists in between the selective-rendering strategies on a per scene basis.
5.5.1. Statistical Analysis
pi jis the number of times that an imageiis preferred to imagejby
a participant. The sum of this result per participant, excluding the
condition wherei= j, is given asΣ:
Σ=
t(t−1)
∑
i6=jpi j 2
(5)
where,tis the number of selective-rendering strategies to be
con-sidered.Σis the sum of the number of agreements between pairs.
For brevity, the names of the rendering strategies have been ab-breviated in this manuscript. These names are Uniform (Uni), Vi-sual Saliency (Sal) and Olfactory-ViVi-sual Saliency (SmSal).
Performing paired-comparisons requires analysis of participant consistency. When evaluating the three conditions (triad), selective-rendering strategies, Uni, Sal and SmSal in this experiment: the
participant gives a judgement, for example, Uni>Sal, Sal>
Sm-Sal and Uni>SmSal. The judgement given by the participant is
deemed to beconsistent when the results given hold across the
board, Uni> Sal> SmSal. Inconsistent choices such as SmSal
>Uni introduces what is called a circular triad. Although
incon-sistency is not ideal in analytical scenarios, where a typical rank-ing approach is adopted it is necessary to handle participant in-consistencies due to tiredness or levels of perceived difference be-ing small and a choice bebe-ing difficult to make in the given time. In addition, inconsistency does not definitely mean that the data is wrong. It can provide statistical evidence that the images
pre-sented forpi j are highly similar and the judgements being made
are, as a result, inconsistent; whereas blindly ranking the choices wouldn’t consider this conclusion. However, if the inconsistencies are present in only a small proportion of participants, then it can be concluded that they are not capable of making a consistent judge-ment whereas most other participants are, and then there exists a justification to not consider the determinations given by that par-ticular participant. The coefficient of consistency is produced on a
scale of 0· · ·1 with 0 indicating complete inconsistency and 1
indi-cating complete consistence. A coefficient of consistencyζis given
by the equation:
ζ=1− 24c
t3−4t (6)
wherecis the number of circular triads observed per participant per
test condition. Ifζ=1, there are no circular triads. The coefficient
of consistency in this experiment wasζaverage≈0.71 and as such
the participant’s consistency was deemed to be good and can all be included in the paired-comparison study. The number of circular
triads is determined as follows [Dav69]:
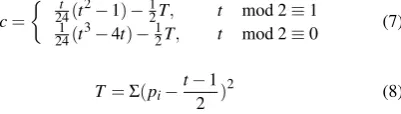
c=
t
24(t
2−
1)−12T, t mod 2≡1
1 24(t
3−4t)−1
2T, t mod 2≡0
(7)
T =Σ(pi−
t−1
2 )
2
(8)
TheΣfor each condition presented which have differences of
less than±Ris deemed to not be significantly different and the
con-ditions can be perceptual grouped into the same categories. How-ever, the conditions with different perceptual groups are declared
to be significantly different whenΣ±Rdoes not fall in range with
other values ofΣand the condition is awarded a separate
percep-tual grouping. The distribution of the range R is asymptotically the
same as the distribution of the variance-normalised range,Wt, of
a set of normal random variables with variance = 1 andt
sam-ples [Dav69]. Therefore, the following relation holds:
P Wt≥
2R−12
√
st
!
(9)
sig-nificance pointa=0.05. The values ofWt,acan be obtained from
statistics books, for example [PH88]. GivenWt,a, it is possible to
findR0:
R0= 1
2Wt,a
√
st+1
4 (10)
The null hypothesis,H00, is that all conditions are equal under
testing (H00 :πi=12). The alternative being that not all the
condi-tionsπiare equal. If the score difference for a given scene between
two rendering conditions is larger thanR+ (the smallest integer
greater thanR0), the conclusion is that there is a statistically
sig-nificant difference between the two conditions presented and this indicates that one is perceptually closer to the ideal reference image than the other. The multiple comparison range test has the property of making it difficult for true differences to show themselves. Yet the method allows comparisons to be performed after the initial in-spection of experimental results and preference matrix generation. In addition, the probability of any incorrect declaration of grouping
differences is controlled at the significance level reported inp. The
preference tables for each scene are presented in Tables8,9and
10.
Uni Sal SmSal Score
Uni * 5 7 12
Sal 23 * 12 35
SmSal 21 16 * 37
Table 8: Preference matrix for the lounge scene presented with ol-factory stimulus (lavender plant) and olol-factory congruency. Ren-dering strategies used for image generation used as row and column headings.
Uni Sal SmSal Score
Uni * 11 11 22
Sal 17 * 12 29
[image:11.595.95.251.599.652.2]SmSal 17 16 * 33
Table 9: Preference matrix for the kitchen scene presented with olfactory stimulus (bread) and olfactory congruency. Rendering strategies used for image generation used as row and column head-ings.
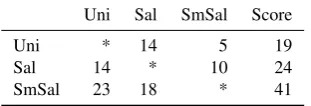
Uni Sal SmSal Score
Uni * 14 5 19
Sal 14 * 10 24
SmSal 23 18 * 41
Table 10: Preference matrix for the restaurant scene presented with olfactory stimulus (banana bunch) and olfactory congruency. Ren-dering strategies used for image generation used as row and column headings.
Uni Sal SmSal Score
Uni * 30 23 53
Sal 54 * 34 88
SmSal 61 50 * 111
Table 11: Preference matrix for all of the scenes combined pre-sented with corresponding olfactory stimulus and olfactory congru-ency. Rendering strategies used for image generation used as row and column headings.
6. Discussion
Table8shows close relationship between the Sal and SmSal
op-erators and the Uni operator was weakest amongst this group in a direct comparison. SmSal was chosen in a paired-comparison over the Sal rendering technique more times, 16 to 12 whilst the Sal con-dition was evaluated higher than Uni than SmSal was with a score
of 23 to 21. Table9shows equal comparisons to Uni in both cases
of Sal and SmSal, however again SmSal is chosen more than Sal in
that pairwise test with a score of 16 to 12. Table10shows a large
discrepancy in results; Uni and Sal are both chosen much less fre-quently than the SmSal image and SmSal is again chosen over Sal,
18 to 10. Table11shows the studies for each scene combined into
one preference matrix.
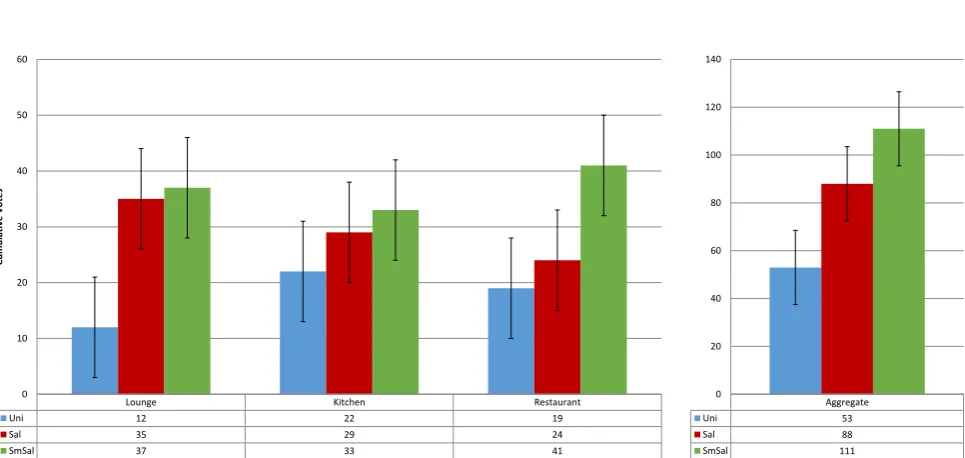
The results provided anR+(the smallest integer greater thanR0)
of 18. This is shown against cumulative votes for each scene and
aggregated in Figure8. This resulted in the following groupings
shown in Table12. As can be seen the results were perceptually
in-distinguishable statistically in the Kitchen scene coupled to which the null hypothesis is not rejected asχ2d f=2,p<0.05=5.99>3.444.
In the case of the Restaurant scene and Lounge scene perceptu-ally identifiable groups emerged. In both scenes where there was ambiguity, the Sal operator has been chosen fewer times over the SmSal condition in a direct pairwise choice, there were fewer cir-cular triads. So in addition to coming at the top of the preference tables the SmSal operator had fewer discrepancies and was percep-tually distinguishable statistically in one scene and in the overall test cases. In order to analyse the data in an aggregated fashion, the scenes have also been collapsed to enable evaluation across the scenes combined. This increased the overall power of the analysis, but ignores the dependency on scene. However, it is clear to see in
Table12that significant groupings appeared for each of the
ren-dering strategies in thisOverallcase. This shows, that in the
gen-eral case, this strategy is beneficial over both Uniform and Saliency metrics for guiding sampling strategy in a VE alongside an olfac-tory stimulus.
7. Conclusions and Future Work
This paper has presented a method which seems to exploits the
Hu-man Visual System’s (HVSs)bottom-up approach. The fact that
the HVS is guided by other modal impulses allows selectively ren-dering the regions attended to in higher quality and the remainder of the image in a lower quality capitalising on inattentional blind-ness. The results extend previous work of smell and graphics, such
Lounge Kitchen Restaurant
Uni 12 22 19
Sal 35 29 24
SmSal 37 33 41
0 10 20 30 40 50 60
Cu
m
u
lativ
e
Vo
te
s
Aggregate
Uni 53
Sal 88
SmSal 111
[image:12.595.64.547.95.324.2]0 20 40 60 80 100 120 140
Figure 8: Method Preference; Error bars indicate the rangeR+.R+is 18 for individual scenes and 31 for the aggregate.
ζ Kendall’s W χ2 P, df=2 Rank 1 Rank 2 Rank 3
Lounge 0.7143 0.300 16.783 <0.05 SmSal* Sal Uni
Kitchen 0.6786 0.062 3.444 =0.179 SmSal* Sal Uni
Restaurant 0.7500 0.226 12.667 <0.05 SmSal Sal Uni
Overall 0.7143 0.336 18.808 <0.05 SmSal Sal Uni
Table 12: Overall similarity study conclusion for the various scenes presented with olfactory stimuli and olfactory congruency’s. *SmSal is ordered first in the ranking from placements in the preference table but it is worth noting the results contain fewer circular triads than the Sal condition.
high-fidelity VEs has for selective-rendering. Smell is a key human sense. Including olfaction into VEs improves perceived realism.
Future work will investigate the variability of the weighting
functionwacross variable smell sets. In evolutionary terms,
cer-tain smells are more prevalent to cercer-tain people, and in fact; some demographs are anosmic or less responsive to some smells. The hedonic tone of a smell is highly subjective as it is related to both genetic and environmental factors. This makes it difficult to cate-gorise smells as positive or negative smells. The effects described here have not been tested for participants with a degree of anos-mia to specific smells. In addition it is necessary to investigate the effect multiple smell impulses have on visual attention. A similar avenue of research is to study the intensity of the smell impulse at which the effect on visual attention comes into play; whilst the human nose can detect odours subliminally in parts per billion, the
threshold to which this effect comes into play must lie between the exposure the experiments presented in this chapter used and a baseline reading. It is important to determine where this thresh-old lies and whether it is variable and quantifiable between various smell types from an odour labelling perspective. Finally, a
regres-sion algorithm will be investigated to find the value ofwthat fits the
olfactory-visual saliency map to the observed gaze tracking data re-trieved during the experiment. This investigation will provide fur-ther insight into the inner workings of olfactory-visual perceptual interactions.
References
[image:12.595.134.474.396.486.2][AMMG16] ADEMOYEO. A., MURRAYN., MUNTEAN G.-M., GH-INEAG.: Audio masking effect on inter-component skews in olfaction-enhanced multimedia presentations. ACM Trans. Multimedia Comput. Commun. Appl. 12, 4 (Aug. 2016), 51:1–51:14.1
[BCB∗09a] BRKICB., CHALMERSA., BOULANGERK., PATTTANAIK
S., COVINGTONJ.: Cross-modal affects of smell on real-time rendering of grass. InIn SCCG’09: Spring Conference on Computer Graphics
(2009), ACM SIGGRAPH Press, pp. 175–179.10
[BCB∗09b] BRKIC B. R., CHALMERS A., BOULANGER K.,
PAT-TANAIKS., COVINGTONJ.: Cross-modal affects of smell on the real-time rendering of grass. InProceedings of the 25th Spring Conference on Computer Graphics(New York, NY, USA, 2009), SCCG ’09, ACM, pp. 161–166.1
[Bla97] BLAUERTJ.: Spatial Hearing : The Psychophysics of Human Sound Localization. M.I.T. Press, Cambridge, MA, 1997.1
[BSVDD10] BONNEEL N., SUIED C., VIAUD-DELMON I.,
DRET-TAKISG.: Bimodal perception of audio-visual material properties for virtual environments.ACM Trans. Appl. Percept. 7, 1 (2010), 1–16.1
[CCL02] CATERK., CHALMERSA., LEDDAP.: Selective quality ren-dering by exploiting human inattentional blindness: looking but not see-ing. InVRST ’02(New York, NY, USA, 2002), ACM, pp. 17–24.1
[CZC∗13] CHENK., ZHOUB., CHENS., HES., ZHOUW.: Olfaction spontaneously highlights visual saliency map.Proceedings of the Royal Society of London B: Biological Sciences 280, 1768 (2013).2
[Dal] DALENBÄCK B.-I.: CATT-Acoustic, Gothenburg, Sweden.
www.netg.se/catt.1
[Dav69] DAVIDH. A.: The Method of Paired Comparisons. Charles Griffin and Company, London, 1969.9
[Deb06] DEBATTISTAK.:Selective Rendering for High Fidelity Graph-ics. PhD in Computer science, University of Bristol, 2006.6
[DM95] DURLACHN., MAVORA.:Virtual Reality Scientific and Tech-nological Challenges. Tech. rep., National Research Council Report, National Academy Press, 1995.1
[GBW∗09] GRELAUDD., BONNEELN., WIMMERM., ASSELOTM.,
DRETTAKISG.: Efficient and practical audio-visual rendering for games using crossmodal perception. InI3D ’09(New York, NY, USA, 2009), ACM, pp. 177–182.1
[GTLG14] GHINEA G., TIMMERER C., LINW., GULLIVER S. R.:
Mulsemedia: State of the art, perspectives, and challenges.ACM Trans. Multimedia Comput. Commun. Appl. 11, 1s (Oct. 2014), 17:1–17:23.1
[HBRDC11] HARVEYC., BASHFORD-ROGERST. E. W., DEBATTISTA
K., CHALMERSA.: Visual Saliency for Smell Impulses and Application to Selective Rendering. InTPCG’11, Theory and Practice of Computer Graphics(2011), Grimstead I., Carr H., (Eds.), Eurographics Associa-tion, pp. 73–80.1,2
[IKN98] ITTIL., KOCH C., NIEBUR E.: A model of saliency-based visual attention for rapid scene analysis, 1998.2
[iLa] ilab neuromorphic vision c++ toolkit:. Available:
http://ilab.usc.edu/toolkit/.3
[Jac07] JACOB T.: A tutorial on the sense of
smell. World Wide Web electronic publication,
http://www.cardiff.ac.uk/biosi/staffinfo/jacob/teaching/sensory/ ol-fact1.html, 2007.1
[Kaj86] KAJIYAJ. T.: The rendering equation. SIGGRAPH Comput. Graph. 20, 4 (Aug. 1986), 143–150.6
[KBS40] KENDALLM., BABINGTON-SMITH B.: On the method of
paired comparisons.Biometrika 31(1940), 324–345.9
[KC14] KATSUKIF., CONSTANTINIDISC.: Bottom-up and top-down
attention.The Neuroscientist 20, 5 (2014), 509–521.2
[Ken75] KENDALLM.:Rank Correlation Methods, 4 ed. Griffin, 1975.
6
[Kna95] KNASKOS. C.: Pleasant odors and congruency: Effects on ap-proach behavior.Chem Senses 20, 5 (1995), 479 – 487.2
[MBM02] MILLOTJ. L., BRANDG., MORANDN.: Effects of ambient odors on reaction time in humans.Neurosci Lett. 322, 2 (Apr 2002), 79 – 82.2
[MBT∗07] MOECK T., BONNEEL N., TSINGOS N., DRETTAKIS G.,
VIAUD-DELMONI., ALLOZAD.: Progressive perceptual audio render-ing of complex scenes. InI3D ’07: Proceedings of the 2007 symposium on Interactive 3D graphics and games(New York, NY, USA, 2007), ACM, pp. 189–196.1
[MDCT05] MASTOROPOULOUG., DEBATTISTAK., CHALMERS A.,
TROSCIANKOT.: Auditory bias of visual attention for perceptually-guided selective rendering of animations. InGRAPHITE ’05(New York, NY, USA, 2005), ACM Press, pp. 363–369.1
[Nay93] NAYLORJ.: ODEON - another Hybrid Room Acoustical Model.
Applied Acoustics 38, 1 (1993), 131–143.1
[PH88] PEARSONE., HARTLEYH.:Biometrika Tables for Statisticians, 3 ed. Cambridge University Press, 1988.10
[RBF08] RAMANARAYANANG., BALAK., FERWERDAJ. A.:
Percep-tion of complex aggregates. InSIGGRAPH ’08: ACM SIGGRAPH 2008 papers(New York, NY, USA, 2008), ACM, pp. 1–10.1
[RCHR07] RAMICB., CHALMERSA., HASICJ., RIZVICS.: Selective rendering in a multi-modal environment: Scent and graphics. In Pro-ceedings of the 23rd Spring Conference on Computer Graphics(New York, NY, USA, 2007), SCCG ’07, ACM, pp. 147–151.1
[RFWB07] RAMANARAYANANG., FERWERDAJ., WALTERB., BALA
K.: Visual equivalence: towards a new standard for image fidelity.ACM Trans. Graph. 26, 3 (2007), 76.1
[RKH∗13] ROJASD., KAPRALOSB., HOGUEA., COLLINSK., NACKE L., CRISTANCHOS., CONATIC., DUBROWSKIA.: The effect of sound on visual fidelity perception in stereoscopic 3-d. IEEE Transactions on Cybernetics 43, 6 (Dec 2013), 1572–1583.1
[RLC∗07] RAGHUVANSHI N., LAUTERBACH C., CHANDAK A.,
MANOCHAD., LINM. C.: Real-time sound synthesis and propagation for games.Commun. ACM 50, 7 (2007), 66–73.1
[SC88] SIEGELS., CASTELLANN.: Nonparametric Statistics for the Behavioral Sciences. McGrall-Hill International, 1988.6
[SDJ∗10] SEIGNEURIC A., DURAND K., JIANG T., BAUDOUIN J.,
SCHAALB.: The nose tells it to the eyes: crossmodal associations be-tween olfaction and vision. Perception 39, 10 (2010), 1541 – 1554. 1,
2
[SIS∗05] SAKAIN., IMADAS., SAITOS., KOBAYAKAWAT., DEGUCHI
Y.: The effect of visual images on perception of odors.Chem Senses 30, 1 (2005), 244 – 245.1
[SRMN10] SEOH.-S., ROIDLE., MÜLLER F., NEGOIASS.: Odors
enhance visual attention to congruent objects.Appetite 54, 3 (Jun 2010), 544 – 549. Epub.2,5
[TGD04] TSINGOS N., GALLOE., DRETTAKIS G.: Perceptual audio
rendering of complex virtual environments. ACM Trans. Graph. 23, 3 (2004), 249–258.1
[War04] WARWICKUNIVERSITYISO STANDARD, BS ISO16200-1:
Workplace air quality: sampling and analysis of volatile organic com-pounds by solvent desorption/gas chromatography, 2004.7
[YPG01] YEEH., PATTANAIKS., GREENBERGD. P.: Spatiotemporal sensitivity and visual attention for efficient rendering of dynamic envi-ronments.ACM Transactions on Graphics 20, 1 (January 2001), 39–65.
7