International Journal of Emerging Technology and Advanced Engineering
Website: www.ijetae.com (ISSN 2250-2459, ISO 9001:2008 Certified Journal, Volume 3, Issue 4, April 2013)
651
A Study of Sociodemographics Effects on E-Learning Adoption
among Lecturers
Abdulhameed Kayode Agboola
Department of Information and Media Technology, Federal University of Technology, Minna, NIGERIA
Abstract— This study has investigated the
sociodemographics effects on e-learning adoption among the IIUM academic staff. Data was collected from 330 respondents using proportional stratified random sampling with response rate of 98%. Overall results showed that the majority 309(95%) of the respondents were skilled in word processor and power-point 280(86%), but were lacking in the rest of the computer software skills. Likewise, the majority 317(97%) of respondents were skillful e-mail users, while another majority 110(34%) claimed internet access of 1-3hr / week. Correlation analyses show that the respondents’ age, year of experience and software skills have significant relationships with e-learning adoption, but software skills is significantly related to e-learning confidence. ANOVA tests show that gender has a strong statistical significant influence on the respondents’ e-learning confidence, while the effects of areas of specialisation on e-learning confidence and e-learning training were not significant, and gender has no significant influence on e-learning consequences, e-learning readiness and e-learning adoption. This paper concluded that sociodemographics, such as, gender and areas of specialization may have significant influence on the respondents’ confidence to use e-learning tools, but they may not significant influence on the respondents’ e-learning adoption.
Keywords— e-learning tools, e-learning adoption, online
learning, internet skills, e-learning confidence.
I. INTRODUCTION
In the past few decade educators with the urge to enhance efficiency in teaching, have turned to electronic delivery of instructions, resulting in new opportunities. The Internet has become a mechanism to facilitate the transfer of many types of information from one computer to another and is rapidly becoming an effective means of communication in schools and colleges, which has manifested in one (e.g., tutor-to-student), one-to-many (e.g., tutor-to-group) and one-to-many-to-one-to-many (e.g., group-to-group). This forms of communication may be synchronous, which occurs in real-time, with all parties communicating within the same time frame; or it may be asynchronous, where there may be a time delay between the communicators when sending, receiving and replying to any given communicative event (Webb et al., 2004).
But importantly, it has been reported that a set of internal variables, such as perceived self-confidence with computer, perceived relevance of computers to teaching, teacher locus of control, innovativeness, and demographic data concerning teachers‟ previous computer experience, affect the levels of teachers‟ computer usages and that computer use relates closely to self-competence and innovativeness (Marcinkiewicz, 1994).
II. LITERATURE REVIEW A. Sociodemographics and New Media Usages
Recently, there have been discussions on the effects of demographics and socioeconomic status (SES) on new media use among researchers. It has been highlighted that there is significant correlation between demographics and socioeconomic status and traditional media use (Stempel and Hargrove, 1996), and a changing standard of pattern in the relationship between internet use and socio-demographics in terms of age, gender, education, and income, and so forth. Also, they reported that only few percent of the respondents regularly used the internet and online services in 1995. The usage increased with education and income and usage was considerably higher amongst 35 years old and above (Stempel et al., 2000).
In an updated survey in 1999, more respondents became regular user of the Internet, and users of online services also increased tremendously. But men used the internet substantially more than women, and the heaviest users were people younger than 35 years old, and there was huge difference between those less than 35 years old and more than 55 years old (Stempel et al., 2000). Income and educations have remarkably positive correlations with the use of Internet and online media. Pew Research Centre‟s (1999) survey on Internet use conducted in the same period reported that 23% of Americans went online in 1996 and 41% of American adults used the Internet in 1998.
International Journal of Emerging Technology and Advanced Engineering
Website: www.ijetae.com (ISSN 2250-2459, ISO 9001:2008 Certified Journal, Volume 3, Issue 4, April 2013)
652
Most recently, surveys revealed that 26% of Americans age 65 and older go online, compared with 67% of those ages 50 to 64, 80% of those ages 30 to 49, and 84% of those ages 18 to 29. Twenty-nine percent of those in sub-secondary education have access to the Internet, compared with 61% of high school graduates and 89% of college graduates. Internet users living in the highest-income households not only have the highest percentage of access to the Internet (93%) but also are most likely to have a fast connection. Survey data showed that 71% of them have a broadband connection at home (cited in Agboola, 2013).
However, the gender gap in Internet use is gradually diminishing. Men, especially young, white, well educated, and fairly affluent men, were the earliest adopters of the Internet. Pew‟s 1995 survey shows that about 58% of the online population was male. Five years later, Internet users were evenly divided between men and women, although the difference was still significant. A decade later, the respective proportions became almost equal. Some 68% of men and 66% of women are now Internet users, with no statistically significant difference between the groups. Younger women are more likely than younger men to be online, whereas older men are more likely than older women to be online (Pew‟s, 2005).
As to specific engagement with the Internet, nevertheless, gender difference is still there. For example, Pew‟s survey of 1998 has reported that heavy online news consumers include more better educated men than women (Pew Research Centre, 1999). But there are no real age differences. Pew Internet Project in 2002 confirmed the persistence of this pattern of online news use, that is online news audience tends to be young, well-educated, and affluent male. Gender gap and education gap remained pronounced. Pew‟s 2005 survey further stressed that, compared with women; men are more likely to use the Internet to get political information. Men communicate more with online special interest groups and are more likely to engage themselves in online charting or discussion groups and are more likely to engage themselves in online chatting or discussion groups than are women.
B. Factors of E-Learning Implementation
As for the factors of e-learning adoption, Agboola (2010) in his book titled: “The dynamics of e-learning tools” proposed five extracted factors of e-learning,
namely: learning readiness, learning adoption, e-learning training, e-learning confidence, e-learning consequences and e-learning sustainability. These factors are further discussed below. E-learning Adoption has been defined as the integration of e-learning technologies into daily routines and changing the ways class lessons are conducted.
“The relative speed with which an innovation (e-learning) is adopted by members of a social system” (Roger, 1993).
III. THEORETICAL FRAMEWORK A. Innovation Diffusion Theory
According to Sugar (2002, p. 12), “past research has detailed numerous incentives and obstacles toward adopting and integrating technology within schools. Some obvious influences include tangible and intangible factors”. Among the tangible factors are additional resources, financial support, staff development, and so on. While the intangible factors that need to be implemented to promote the adoption of new technologies include, among other things, promoting teacher empowerment (Topp et al., 1995), providing a comfortable atmosphere and individualized attention (Schrum and Fitzgerald, 1996), creating a comfort zone (Norum, 1997), and other similar factors.
However, research on the adoption of innovations is concerned with an individual‟s behaviour during the innovation diffusion process, as opposed to diffusion research, which focuses on the social system as a whole. Sequentially, adoption can be regarded as a subset of diffusion process, but with a special reference to the individual in whom the diffusion is manifesting rather than the social group level as initially advocated by innovation diffusion theorists (Jebeile and Reeve, 2003).
According to Rogers (1995, p. 250), innovation is “an idea, practice, or object that is perceived as new by an individual.” He points out that „newness‟ is not an objective measure based on time lapse since its first use or discovery, rather, it is a subjective perception, if the idea, practice, or object seems new to the individual, it is an innovation.
Rogers defines „rate of adoption‟ as “the relative speed with which an innovation is adopted by members of a social system” (Roger, 1993, p. 11). However, there is a set of factors that determine the rate of adoption of an innovation, namely;
1) The individual‟s perception of the attributes of the innovation;
2) The nature of the communication channels diffusing the innovation;
3) The nature of the social system;
4) The extent of change agents‟ efforts in diffusing the innovation.
International Journal of Emerging Technology and Advanced Engineering
Website: www.ijetae.com (ISSN 2250-2459, ISO 9001:2008 Certified Journal, Volume 3, Issue 4, April 2013)
653
This assessment is paramount because a series of surveys have reported that there was a significant correlation between demographics and socioeconomic status and media use (Stempel and Hargrove, 1996), and a changing standard of pattern in the relationship between internet use and socio-demographics in terms of age, gender, education, and income, and that the media usage increased with education and income and usage was considerably higher amongst 35 years old and above (Stempel et al., 2000). This study specifically aimed at surveying the effects of sociodemographics of academic staff of IIUM and their e-learning adoption.
IV. RESEARCH QUESTIONS
This study seeks to answer the following questions: 1) What are the most highlighted computer and internet skills expressed by the academic staff of the IIUM and what is their weekly Internet access?
2) What level of relationships exists between the respondents‟ socio-demographic characteristics and e-learning adoption in this study?
3) To what extent have the two strata groups influenced e-learning adoption in this study?
V. HYPOTHESIS
This null hypothesis was also tested.
Ho1: (a) There is no correlation between the respondents‟ computer skills and e-learning adoption. Ho1:
(b) There is no correlation between the respondents‟ internet skills and e-learning adoption.
Ho2: (a) There is no significant effect of the respondents‟ socio-demographics of gender and areas of specialization and e-learning adoption. Ho2: (b) There is no significant effect of the respondents‟ socio-demographics of gender and areas of specialization and e-learning adoption.
VI. DESIGN,METHOD,AND EXPECTATIONS A.Data collection
The data for the study was collected through a self-developed survey questionnaire, which collected data on socio-demographics and the respondents‟ e-learning adoption. The sample was drawn from 1,421 academic staff of IIUM using stratified random sampling with consideration for two strata: gender and areas of specialisation. Assuming 95% confidence level, Krejcie and Morgan (1970) Determining Sample Size for Research Activities using this formula:
B.Interpretation of Sample Size Formula:
In which, S = required sample size; X² = the table value of chi-square for 1 degree of freedom at the desired confidence level (3.841); N = the population size; P = the population proportion (assumed to be .50 since this would provide the maximum sample size); d = the degree of accuracy expressed as a proportion (.05).
S = 3.841 (1421 x 0.50) (1- 0.50) .05²(1421-1) +3.841(0.50) (1-0.50)
nsamples = 330 lecturers
C.Instrument Reliability
The Cronbach‟s alpha reliability is 0.8. 330 questionnaires was administered, but 324 were returned, representing 98% response rate. The focus of this study was on the influences of socio-demographics of gender and areas of specialization on e-learning adoption. The analyses did not cover the rest of the extracted factors of e-learning. The sample was stratified into gender (males and females) and areas of specialization (Arts and Sciences). First, correlation analysis was applied to examine the relationships among the variables. Also, ANOVA was applied to determine the effects of IVs on DVs and to compare the mean differences among the highlighted variables.
VII. MEASURES AND FINDINGS A.Independent variables
Demographics: The first control block includes three demographic variables, which scholars have associated with e-learning adoption: gender (55% males and 45% females); age (M= 1.29, SD= .47); Specialisation (Humanities = 55%, Science= 45%).
B.Criterion / Dependent variables
E-learning adoption: This was measured with an index of three items Likert scale. E-learning readiness: This was measured with an index of three items Likert scale.
International Journal of Emerging Technology and Advanced Engineering
Website: www.ijetae.com (ISSN 2250-2459, ISO 9001:2008 Certified Journal, Volume 3, Issue 4, April 2013)
654 Table 1
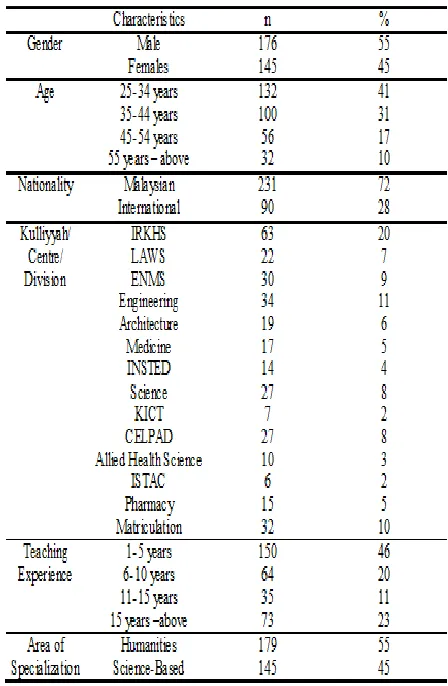
Frequency Distribution of the Respondents’ Demographic Background
n=324
According to the Table 1, respondents were categories into four age ranges. The majority 25-34 years (41%), were young people, while 55 year olds (10%) were the least. For the respondents‟ nationality, the majority 231(72%) were Malaysians, while foreigners were 90(28%). For their teaching experience, the majority 150(47%) have 1-5 years, while the least experienced were 35(11%) have 11-15 years. As for the respondents‟ areas of specialization, the majority 179(55%) humanities, while 145(45%) Science-based
Research question 1: What are the most highlighted computer and internet skills expressed by the academic staff of the IIUM and what is their weekly Internet access per week?
[image:4.612.72.296.152.495.2] [image:4.612.329.565.226.343.2]Table 2 presents the distribution of the respondents‟ computer skills. For skills in word processor, the majority 309(95%) possessed the skill, for spreadsheets or Excel, 228(70%) possessed the skills, for databases, only 87(27%) were skilled in it. In terms of statistical packages (e.g., SPSS), only 107(33%) claimed having the skill.
Table 2
Distribution of Respondents According to their Computer Software Skills
n=324
[image:4.612.330.565.462.596.2]In terms of presentation software skill (e.g., power-point), the majority 280(86%) were skilled in using it, while the majority 272(84%) can copy and transfer files skillfully. As for using scanners, the majority 190(59%) were skilled in it, but for skills in creating acrobat PDF files, only 104(32%) claimed skilled in it.
Table 3
Distribution of Respondents According to their Internet Skills
International Journal of Emerging Technology and Advanced Engineering
Website: www.ijetae.com (ISSN 2250-2459, ISO 9001:2008 Certified Journal, Volume 3, Issue 4, April 2013)
655 Table 4
Internet Accessibility per Week
HOURS PER WEEK
FREQUENCY PERCENT
(Approx.)
1-3 HOURS 78 24
4-6 HOURS 77 24
7-9 HOURS 57 18
10 HOURS
& ABOVE 110 34
TOTAL 324 100
n=324
[image:5.612.64.270.142.242.2] [image:5.612.327.592.153.319.2]Table 4 (above) the majority 110(34%) claimed 10 hours access and above per week, followed by 78(24%) with 1-3 hour access per week, 77(24%) with 4-6 hours, and the least range of accessibility were 57(18%) with 7-9 hours per week.
Table 5
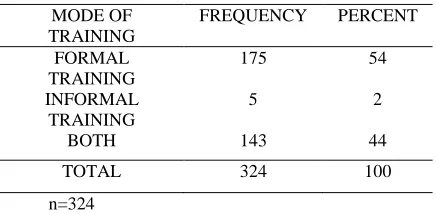
Distribution of Sources of Acquired Computer and Internet Training
MODE OF TRAINING
FREQUENCY PERCENT FORMAL
TRAINING
175 54
INFORMAL TRAINING
5 2
BOTH 143 44
TOTAL 324 100
n=324
Table 5 (above) the majority of the respondents 175(54%) had formal training, while 143(44%) mentioned having both formal and informal trainings.
Research question 3: What level of relationships exists between the respondents‟ socio-demographic characteristics and the established factors of e-learning tools in this study?
According to the correlation analyses (Table 5), three of the respondents‟ socio-demographic characteristics were significantly correlated with two out of the five extracted factors: Age (e-learning adoption = -0.169, p = 0.01), experience (e-learning adoption = -0.160, p = 0.01), software skills (learning confidence = 0.333, p = 0.01); e-learning adoption = -0.153, p = 0.01).
Table 6
Inter-Variable Correlations between the Respondents’ Demographic Characteristics and the Extracted Factors
n=324
** Pearson Correlation is significant at the 0.01 level (2-tailed). (Note. Key: M=Mean; SD=Standard Deviation. Alpha is sig at p ≤ 0.01)
[image:5.612.60.278.330.437.2]International Journal of Emerging Technology and Advanced Engineering
Website: www.ijetae.com (ISSN 2250-2459, ISO 9001:2008 Certified Journal, Volume 3, Issue 4, April 2013)
656
Table 6 highlighted that there were no positive linear relationships between the respondents‟ faculty and the five extracted factors. The correlation test was not found to be significant for the respondents‟ faculty and the extracted factors.
Table 6 showed that there were linear relationships between the respondents‟ software skills and e-learning adoption (r = 0.153, p = 0.01). The results of this test indicated that as the respondents‟ software skills increases, their perception of e-learning adoption will also increase consecutively.
Finally, Table 6 revealed that there were linear relationships between the respondents‟ Internet skills and e-learning adoption (r =0.184, p = 0.01). These results show that as the respondents‟ Internet skills increases, their perceptions of e-learning adoption will also increase significantly.
C.Test of Hypotheses
Ho1: (a) There is no correlation between the respondents‟ computer skills and e-learning adoption.
Ho1: (b) There is no correlation between the respondents‟ internet skills and e-learning adoption.
E-Learning adoption was defined as the integration of e-learning technologies into daily routines and changing the ways class lessons are conducted. “The relative speed with which an innovation (e-learning) is adopted by members of a social system” (Roger, 1993).
Therefore, correlations test of hypothesis Ho 1 (a) at the 0.01 level (2-tailed) and significant at p ≤ 0.01 shows that the null hypothesis was rejected. There were linear correlations between the respondents‟ software skills and e-learning adoption (r = 0.153, p = 0.01). This finding indicates that the respondents‟ software skills will influence e-learning adoption in the University, IIUM.
With the same token, correlations test of hypothesis Ho 1 (b) at the 0.01 level (2-tailed) and significant at p ≤ 0.01 shows that the null hypothesis was rejected. There were linear correlations between the respondents‟ Internet skills and e-learning adoption (r =0.184, p = 0.01). Also, this finding has indicated that the respondents‟ Internet skills will influence e-learning adoption in the University, IIUM.
Research question 3: To what extent have the two strata groups (gender and area of specialization) influenced e-learning adoption in the study?
D. Gender and Area of Specialization on E-Learning Confidence
Respondents‟ socio-demographic characteristics had been reported in some of the previous studies as having impacts on the respondents' ICT usage.
Congruously, Murphy and Greenwood (1998) reported that respondents‟ gender, though controversial and their areas of specicalisation may influence the implementation and integrative use of ICT for teaching and learning process.
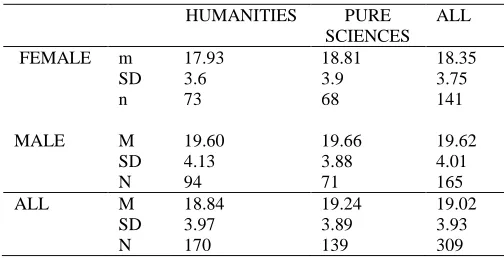
[image:6.612.317.569.449.578.2]In Table 7 (below), the means and standard deviations of the scores on gender and areas of specialisation on e-learning confidence were presented. The Levene‟s tests revealed that the homogeneity of variance assumption was not significant, therefore, there is no violation of assumption; F(4, 304) = .825, p = .510. The overall F-test for the combined effects of the strata group were not statistically significant; F(4, 304) =2.677, p=0.032, MSE = 15.144. Though, it appeared that the variability of e-learning confidence was larger among the male subjects (SD =19.62). The main effects of gender on e-learning confidence was statistically significant, F(2, 304) = 4.266, p = 0.015, MSE = 15.114. The result revealed that gender has a significant influence on the respondents‟ perceptions of e-learning confidence. The effects of gender on users‟ perceptions of ICT use was reported by Van Braak (2001, p. 43) relating from Kirkpatrick and Cuban (1998), Shashaani (1997), Whitley (1998) that "males seem to be more involved in computing, are more experienced and have more favourable attitudes towards computers than females."
Table 7
Mean Percentage E-learning Confidence
HUMANITIES PURE SCIENCES
ALL
FEMALE m 17.93 18.81 18.35
SD 3.6 3.9 3.75
n 73 68 141
MALE M 19.60 19.66 19.62
SD 4.13 3.88 4.01
N 94 71 165
ALL M 18.84 19.24 19.02
SD 3.97 3.89 3.93
N 170 139 309
International Journal of Emerging Technology and Advanced Engineering
Website: www.ijetae.com (ISSN 2250-2459, ISO 9001:2008 Certified Journal, Volume 3, Issue 4, April 2013)
657
But with regard to the interactive effects of gender and areas of specialisation on e-learning confidence, the results revealed that there is no statistically significant effects between the groups and e-learning confidence, F(1, 304) = 0.818, p = 0.367, MSE = 15.144. This means that gender and areas of specialisation have no interactive influence on the respondents‟ e-learning confidence.
The researcher conducted an analysis of simple effects (POST-HOC analysis) to reveal the direction of the effect of one factor at one level of the other factor. That is, to see if the larger variability among male subjects and the significant effect that was obtained from the main effect can be confirmed as genuine. Therefore, a simple One-Way ANOVA was conducted. The Levene results showed that there was a significant interaction between gender and e-learning confidence, F(2, 307) = .973, p = 0.379, MSE = 15.107. The Newman-Keuls test further showed that the mean for the male respondents (19.62%), p < 0.05 was higher compared to the mean of the female respondents (18.37%), p >0.05.
Additionally, the results of this test indicated that the mean difference between the male and female subjects was significant. This pattern of effects is consistent with the reports of Murphy (Murphy & Greenwood, 1998) that female teachers were significantly less confident than male teachers about using computers in teaching. This data provided evidence that male subjects were likely to be more confident in using e-learning tool as compared to their female counterpart. Also, Marcinkiewicz (cited in Fabry & Higgs, 1997, p. 385) found that "teachers' computer use was found to be related to self-confidence, self-competence and innovativeness."
E. Gender and Area of Specialization on E-Learning Training
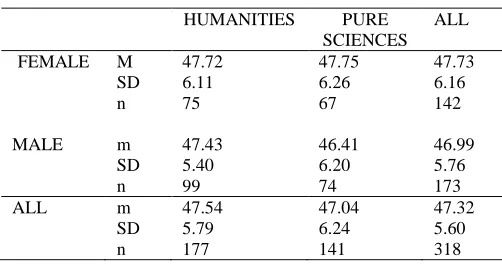
[image:7.612.318.569.142.274.2]In Table 8, the means and standard deviations of the scores on the effects of gender and areas of specialisation on e-learning training were presented. As revealed by the Levene‟s tests, the homogeneity of variance assumption was significant, thus a violation of the assumption resultant from sample representativeness between males and females: F(4, 313)=2.738, p=0.029, MSE = 36.066. This means that population variances for each group are not equal.
Table 8
Mean Percentage E-learning Training
HUMANITIES PURE SCIENCES
ALL
FEMALE M 47.72 47.75 47.73
SD 6.11 6.26 6.16
n 75 67 142
MALE m 47.43 46.41 46.99
SD 5.40 6.20 5.76
n 99 74 173
ALL m 47.54 47.04 47.32
SD 5.79 6.24 5.60
n 177 141 318
The overall F-test for the combined effects of the groups were statistically significant; F(4, 313) = .614, p=0.653, MSE = 36.066. There is larger variability among female subjects for e-learning training (SD =47.73). The main effects of gender on e-learning training was not statistically significant, F(2, 313) = 0.737, p = 0.479, MSE = 36.066. This means that gender has no influence on e-learning training.
The effects of areas of specialisation on e-learning training is not statistically significant, F(1, 313) = 0.537, p = 0.464, MSE = 36.066. The result tells us that areas of specialisation has no influence on the respondents‟ e-learning training. Also, the interactive effects of gender and areas of specialisation on e-learning training was not statistically significant, F(1, 313) = 0.595, p = 0.441, MSE = 36.066. This means that gender and areas of specialisation have no influence on the respondents‟ e-learning training.
F. Gender and Areas of Specialization on E-Learning Consequences
International Journal of Emerging Technology and Advanced Engineering
Website: www.ijetae.com (ISSN 2250-2459, ISO 9001:2008 Certified Journal, Volume 3, Issue 4, April 2013)
[image:8.612.319.570.143.275.2]658 Table 9
Mean Percentage E-learning Consequences
HUMANITIES PURE SCIENCES
ALL
FEMALE m 13.76 13.55 13.66
SD 2.58 3.19 2.9
n 75 69 144
MALE m 13.39 13.53 13.56
SD 2.63 3.15 2.86
n 99 73 172
ALL m 13.73 13.54 13.65
SD 2.68 3.16 2.90
n 177 142 319
There are no equal variances among the group population. This violation was as a result of little differences in the number of males 176(55%) and females 145(45%). The overall F-test for the combined effects of the groups were not statistically significant; F(4, 314) = 1.535, p=0.192, MSE = 8.368. The result revealed that gender has no significant influence on the respondents‟ perceptions of e-learning consequences.
By looking at the interaction between areas of specialisation and e-learning consequences, the result showed that the effects of areas of specialisation on e-learning consequences were not statistically significant, F(1, 314)=0.158, p = 0.692, MSE = 8.368. This result indicates that areas of specialisation have no influence on the respondents‟ e-learning consequences. Also, the interactive effects of gender and areas of specialisation on e-learning consequences were not statistically significant, F(1, 314)=0.058, p = 0.811, MSE = 8.368. Therefore, gender and areas of specialisation had no influence on the respondents‟ e-learning consequences.
G. Gender and Areas of Specialization on E-learning Readiness.
Table 10 shows the means and standard deviations of the effects of gender and areas of specialization on e-learning readiness. These result reveals that among male subjects, the variability was larger for e-learning readiness (SD =16.02). The Levene‟s test has highlighted to us that the homogeneity of variance assumption has been violated, because it was significant, F(4, 312) = 4.456, p = .002. The overall F-test for the combined effects of the two independent variables were not statistically significant; F(4, 312) = .945, p = 0.438, MSE = 9.336.
Table 10
Mean Percentage E-learning Readiness
HUMANITIES PURE SCIENCES
ALL
FEMALE m 15.86 16.21 16.02
SD 2.70 2.51 2.61
n 76 67 143
MALE m 15.58 15.27 15.45
SD 2.61 2.86 3.35
n 98 73 171
ALL m 15.69 15.72 15.72
SD 2.82 3.34 3.05
n 177 140 317
The main effects of gender on e-learning readiness was not statistically significant, F(2, 312) = 1.579, p = 0.208, MSE = 9.336. This means that gender has no significant influence on the respondents‟ perceptions of e-learning readiness. And the interaction between areas of specialisation and e-learning readiness was not statistically significant too, F(1, 312) = 0.004, p = 0.947, MSE = 9.336. This explains that areas of specialisation have no influence on the respondents‟ e-learning readiness. In terms of the interactive effects of gender and areas of specialisation on e-learning readiness, there were no statistically significant effects among the groups, F(1, 312) = 0.901, p = 0.343, MSE = 9.336. These results show that gender and areas of specialisation had no influence on the respondents‟ e-learning readiness.
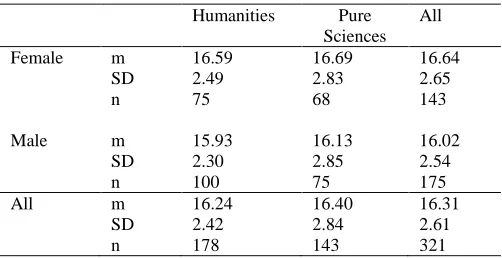
H. Gender and Areas of Specialization on E-learning Adoption.
[image:8.612.44.299.143.288.2]International Journal of Emerging Technology and Advanced Engineering
Website: www.ijetae.com (ISSN 2250-2459, ISO 9001:2008 Certified Journal, Volume 3, Issue 4, April 2013)
[image:9.612.43.294.144.273.2]659 Table 11
Mean Percentage E-learning Adoption
Humanities Pure Sciences
All
Female m 16.59 16.69 16.64
SD 2.49 2.83 2.65
n 75 68 143
Male m 15.93 16.13 16.02
SD 2.30 2.85 2.54
n 100 75 175
All m 16.24 16.40 16.31
SD 2.42 2.84 2.61
n 178 143 321
According to the results, gender has no significant influence on the respondents‟ perceptions of e-learning adoption. These results contradicted the report that male have higher tendencies for using ICT tools as compared to females (Summers, 1990; McMahon and Gardner, 1995). Although, the means and standard deviation in this result showed that female subjects had larger variability for e-learning adoption as compared to male subject. Gender influence on ICT usage was reported as controversial by Murphy and Greenwood (1998).
As for areas of specialisation and e-learning adoption, there were no statistically significant effects among the groups, F(1, 316) = 0.272, p = 0.602, MSE = 6.784. As shown in these results, areas of specialisation had no influence on the respondents‟ e-learning adoption. Finally, the interactive effects of gender and areas of specialisation on e-learning adoption was not statistically significant too, F(1, 316) = 0.028, p = 0.867, MSE = 6.784. Thus, gender and areas of specialisation had no influence on the respondents‟ e-learning adoption. Although, Summers and Easdown (1990) mentioned that subject specialism of respondents may influence the extent of ICT use. Murphy and Greenwood (1998) related that subjects who specialized in geography tended to use computers more in their teaching when compared with students who had chosen history as their main subject.
I. Test of Hypotheses
Ho2: (a) There is no significant effect of the respondents‟ socio-demographics of gender and areas of specialization and e-learning adoption. Ho2: (b) There is no significant effect of the respondents‟ socio-demographics of gender and areas of specialization and e-learning adoption.
E-Learning adoption was defined as the integration of e-learning technologies into daily routines and changing the ways class lessons are conducted.
Therefore, analysis of the variance test of hypothesis Ho2: (a) at the 0.01 level (2-tailed) and significant at p ≤ 0.01 shows that female subjects had larger variability for e-learning adoption (SD =16.64) as compared to males. The main effects of gender on e-learning adoption was not statistically significant, F(2, 316) = 2.805, p = 0.062, MSE = 6.784. The null hypothesis was not rejected. Gender will not have significant effects on the respondents‟ e-learning adoption.
With regard to analysis of the variance test for hypothesis Ho2: (b) at the 0.01 level (2-tailed) and significant at p ≤ 0.01 shows that there were no statistically significant effects of areas of specialisation on e-learning adoption, F(1, 316) = 0.272, p = 0.602, MSE = 6.784. As shown in these results, areas of specialisation had no influence on the respondents‟ e-learning adoption. The null hypothesis was therefore not rejected. This finding has indicated that the respondents‟ areas of specialization will not have any significant influence on the respondents‟ e-learning adoption.
VIII. CONCLUSION
The ICT and internet adoption is rapidly growing in Nigeria, thus strategy and confidence is growing that it will be an important element of future of our educational system and curricula activities, but academic users should not view it as the last resort in solving problems related to efficient and effective teaching in Nigeria.
Some of the most common obstacles to e-learning adoption for teaching are the lack of confidence on the part of the academic users, the lack of provision of adequate skills and training programme, the inadequate technology infrastructure, planning and program deficiencies, the lack of human capacity and expertise, inadequate economic resources, the lack of recognition of knowledge or educational equivalence, and the neglect of learning conditions and cultural aspects to some extent.
Finally, the theoretical framework utilised in this study provides a rich and potentially fruitful area for further research and has practical implications for users, such as, teachers, lecturers, and administrators of faculty activities, and vendors, who are concerned with the diffusion of ICT, internet and e-learning adoption in various academic institutions in Nigeria.
IX. RECOMMENDATIONS
International Journal of Emerging Technology and Advanced Engineering
Website: www.ijetae.com (ISSN 2250-2459, ISO 9001:2008 Certified Journal, Volume 3, Issue 4, April 2013)
660 A. General overhaul of e-learning adoption studies
Future studies should include more variables that touch on the issue of e-learning adoption by faculty staff, professional development programmes, competencies that are required for implementation and sustainability of e-learning.
B. Assessment of the respondents’ computer and internet skills
The areas mentioned for deficiencies in the study should be evident of where to focus efforts for professional development, while, the levels of skillfulness of those respondents who claimed to be skilled in some of the software should be evaluated before embarking on any e-learning adoption plans.
C. Longitudinal study of lecturer perceptions of e-learning adoption
Finally, lecturer perceptions towards the introduction of e-learning can best be understood if longitudinal studies are conducted over an extended period of time. For example, lecturers‟ perceptions towards e-learning can be assessed right from the take-off moment for an extended period of utilisation in the University (IIUM), and further assessments can be made as they progress further in the University. A longitudinal study of lecturers‟ perceptions on e-learning could be more informative and enlightened to future researchers.
REFERENCES
[1] Agboola, A.K. 2010. Dynamics of E-Learning Tools: Readiness, Adoption, Training, Implementation, Change Management and Sustainability. Germany: Lambert Academic Publishing.
[2] Agboola, A.K. 2013. The Effects of Internet Usage on Political Information Efficacy among the 18-24-year-old Students at Ilorin. International Journal of Emerging Technology and Advanced Engineering. 3(3), 717-727. Retrieved April 1, 2013 from www.ijetae.com
[3] Bryman, A., and Cramer, D. 1997. Quantitative Data Analysis. London: Routledge.
[4] Chamberlin, B.A. and Scot, T.P. 2002. Creating Sustainable Technology Integration with Teachers: One One-Hour Workshop at a Time. Special Feature. Journal of Computing in Teacher Education, 19(1), 23-27.
[5] Fabry, D.L. and Higgs, J.R. 1997. Barriers to the effective use of technology in education: Current status. Journal of Educational computing Research, 17(4), 385-395.
[6] Galagan, P. 2002. The Learning Revolution. In Woods, J.A. & Cortada, J. W.(2002). The 2002 ASTD Training and Performance Yearbook (Eds.), (pp.75-82).New York: McGraw-Hill
[7] Jebeile, S., and Reeve, R. 2003. The Diffusion of E-Learning Innovations in an Australian Secondary College: Strategies and Tactics for Educational Leaders. The Innovation Journal 8(4). [8] Jonassen, D. 1996. Computers in the classroom: Mindtools for
critical thinking. Englewood Cliffs, New York: Prentice Hall.
[9] Katz, R.N., and Oblinger, D.G. 2000. The “E” Is for Everything (Eds.) EDUCAUSE. Leadership Strategies. 2, 21-52. San Francisco: Jossey-Bass. A Wiley Company,.
[10] Kirkpatrick, H., and Cuban, L. 1998. Should we be worried what the research says about gender differences in access, use, attitudes and achievement with computers? Educational Technology, 38(4), 56-61.
[11] Kortecamp, K., and Croninger, W.R. 1996. Addressing Barriers to Technology Diffusion. Journal of Information Technology for Teaching, 5(1&2), 71-82.
[12] Kosicki, G.M. and Yuan, Y. 2001. Measuring Audience Behaviour in the new Communication Landscape: Implications for Political Participation. Paper presented at the Midwest Association for Public Opinion Research, Chicago, November 2001.
[13] Krejcie, R.V., and Morgan, D.W. 1970. Determining Sample Size for Research Activities. Educational and Psychological Measurement, 1970, 30, 607-610.
[14] Marcinkiewicz, H.R. 1994. Differences in Computer Use of Practicing versus Pre-service Teachers. Journal of Research on Computing in Education, 27(2), 184-197.
[15] McLeod, J.M., and Becker, L.B. 1974. Testing the Validity of Gratification Measures Through Political Effects Analysis. In Blumber, J.G. and Katz, E. (eds). The Uses of Mass Communication, pp. 137-164.SAGE Publications Inc.: Beverly Hills.
[16] McMahon, J., and Gardner, J. 1995. Facilitating and inhibiting factors in student computer usage. In Hagen, C.O. (Eds.), Empowering teachers and learners through Technology. Birmingham: Staff and Educational Development Association. [17] Moore, G.C., and Benbasat, I. 1991. Development of an Instrument
to Measure Perceptions of Adopting an Information Technology Innovation. Information Systems Research, 2(3), 192-222. [18] Murphy, C., and Greenwood, L. 1998. Effective Integration of
Information and Communications Technology in Teacher Education. Journal of Information and Technology for Teacher Education, 7(3), 413-429.
[19] Murray, P.J. 2003. E-learning and its benefits for developing nursing practice. Peer reviewed research paper. ITIN 15(2), June 2003. Retrieved October 25, 2004, from www.bcsnsg.org.uk/itin15/VOL15-res.pdf
[20] Norum, K. 1997. Lights, camera, action! The trials and triumphs of using technology in the classroom. Journal of Technology and Teacher Education, 5(1), 3-18.
[21] Pew Internet and American Life Project. 2005. Reports: Demographics. Washington, DC: Author. Retrieved March 5, 2009, from http://www..pewinternet.org/PPF/r/171/report_display.asp [22] Pew Research Centre. 1999. The Internet News Audience Goes
Ordinary. Washington, DC: The Pew Research Centre for the People and the Press. Retrieved July 1, 2009, from http”//peoplepress.org/reports/display.php3?ReportID=72
[23] Rogers, E.M. 1993. Diffusion of Innovations (3rd ed.) New York: Free Press.
[24] Rogers, E.M. 1995. Diffusion of Innovations (4th ed.) New York: Free Press.
[25] Rosenberg, M.J. 2001. E-learning: Strategies for Building Online Learning in the Digital Age. New York: McGraw-Hill
International Journal of Emerging Technology and Advanced Engineering
Website: www.ijetae.com (ISSN 2250-2459, ISO 9001:2008 Certified Journal, Volume 3, Issue 4, April 2013)
661 [27] Schrum, L. and Fitzgerald, M. 1996. A challenge for the
information age: Educators and the Internet. International Journal of Educational Telecommunications, 2(2/3), 107-120.
[28] Shashaani, L. 1997. Gender differences in computer attitudes and use among college students, Journal of Educational Computing Research, 16, 37-51.
[29] Spencer, K. 1999. Educational Technology-An Unstoppable Force: A Selective Review of Research into the Effectiveness of Educational Media. Educational Technology and Society, 2(4), 1-16. [30] Stempel, G.H. III, and Hargrove, T. 1996. Mass Media Audiences in Changing Media Environment. Journalism and Mass Communication Quarterly, 77, 71-79.
[31] Stempel, G.H. III, Hargrove, T., and Bent, J.P. 2000. Relation of Growth of Use of the Internet to Changes in Media use from 1995 to 1999. Journalism and Mass Communication Quarterly, Vol. 77, pp. 71-79.
[32] Sugar, W. 2002. Applying human-centered design to technology integration: Three alternative technology perspectives. Journal of Computing in Teacher Education, 19(1), 12-17.
[33] Summers, M. 1990. Starting Teacher Training- new PGCE students and courses, British Education an Research Journal, 16, 79-87. [34] Topp et al., 1995. Building a technology-using faculty to facilitate
technology-using teachers. Journal of Computing in Teacher Education, 11(3), 11-14.
[35] Topp, N., Mortenson, R., and Grangenett, N. 1995. Building a technology-using faculty to facilitate technology-using teachers. Journal of Computing in Teacher Education, 11(3), 11-14.
[36] Van Braak, J. 2001. Factors Influencing the use of Computer Mediated Communication by Teachers in Secondary Schools. Computers & Education, 36, 41-57
[37] Webb, E., Jones, A., Barker, P., and Schaik, P. 2004. Using e-learning dialogues in higher education. Innovations in Education and Teaching International, 41(1), 93-103).