Journal of Chemical and Pharmaceutical Research, 2017, 9(4):238-243
Review Article
CODEN(USA) : JCPRC5
ISSN : 0975-7384
238
Optical Properties of Biodegradable Polylactic Acid/Silver Nanocomposites: A
Study
Nadia Abbas Ali*
University of Baghdad, College of Science, Department of Physics, Baghdad, Iraq _____________________________________________________________________________
ABSTRACT
In this work nano silver added to the biodegradable polylactic acid can be prepared by casting method at room temperature and thickness (120 μm) at different concentration of nano silver powder. Optical properties have been measured in the range of (300-800) nm. The electronic transition in pure polylactic acid (PLA) and PLA/Ag nanocomposites indicated direct allowed transition. Also, it is found that the energy gap of polylactic acid is 3.3 ev and this value decreased within range of (3.3-2.7) eV when the concentration of nano silver powder increased from (2, 4, and 6%) respectively. The optical constants which include the refractive index (n), real (ε1) and imagenerary
(ε2) part of dielectric constant calculated at λ=550 nm and find it decreased with increasing of nano silver.
Keywords: Biodegradable; Polylactic acid; Nano silver; Optical properties; Energy gap
_____________________________________________________________________________
INTRODUCTION
239
transparency of food packaging films is around 95% [10,11]. Refractive index is a fundamental physical property of a substance that is often used for its identification, to confirm its purity or to measure its concentration. By definition, the refractive index of a medium is a measure of how much the speed of light is reduced inside the medium. It is a fundamental optical property of polymers that is directly related to other optical, electrical, and magnetic properties. Knowledge about this property is valuable due to its application in the design of new optical polymeric materials. The addition of nanosized inorganic or organic dopants to polymers allows the modification of the polymers’ physical properties enabling the realization of functionalized polymers with new application fields, for example, in microoptics [12].
Optical Energy Gap
The experimental results on optical absorption in glassy materials have been reported by Mott and Davis [13,14]. One important difference between amorphous and crystalline solids is that; in the crystalline nonmetallic solids, there is a sharp well defined lattice absorption edge and energy gap ( Eg) given by the relation:
Eg=hc/λ ………(1) Where: Eg=energy gap, h= Planks constant, c=velocity of light, λ=wavelength.
The absorption coefficient (α )which is defined as the decrement ratio of incident radiation relative to unit length in the direction of wave propagation inside the medium is relating with the absorbance (A) through the relation:
t A 303 . 2
……….(2)Where: (t) is the thickness of sample.
Many researchers put the empirical equation between the optical energy gap(Eg) and energy of the incident photon which is:
(α hν) = B( hν -Eg)r………(3)
Where B is proportion with the inverse of amorphousity, (hν) is the energy of incident photon, which can be calculated using the equation:
) ( 1240 nm h
………….……(4)r is the order of the optical transition depending on the nature of electronic transition. The transition is called direct if the extremities of V.B and C.B lie at the same K-space, while the transition is called indirect if the transition possible only with phonon assisted (∆k≠0). Thus the value of r may be 1/2,2,3/2, and 3 corresponding to the allowed direct, allowed indirect, forbidden direct and forbidden indirect transition respectively. The extinction coefficient (K) (imaginary part of the refractive index) can be calculated by the relation:
k=λα/4K ……….. (5)
The refractive index (n) can be measured (when the reflectance (R) and (k) are known) by using the equation (6), Where (n) is the refractive index given by:
R R R
R
k
n
2
1/2
11 ) 1 ( ) 1 ()]
1
(
[
2 2 ……….. (6)R is the reflectance and given by equation:
R=(n-1)2+k2 /(n+1)2+k2……(7) The dielectric (ε) is the complex dielectric constant can be introduced by:
ε=ε1-i ε2 ……….……(8)
The parameter ε1 is the real part of dielectric constant, ε2 is the imaginary part of dielectric constant, from equations (7) and (8) one can obtained:
ε1=n2 –k2….(9) ε2=2nk…….(10)
EXPERIMENTAL SECTION
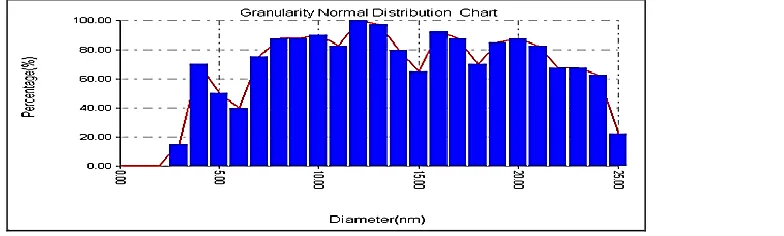
Lactic acid (99.9%), Tin chloride dehydrated (SnCl2.2H2O) P-toluene sulfonic acid (TSA). Methylene Chloride, Nano silver with particle size (13.69 nm) is shown in Figure 1 measured of nano Ag.
Preparation of Pure PLA and PLA/Sliver Nanocomposites
240
[image:3.612.143.535.136.254.2]the refluxing temperature of the solvent under mild stirring with the help of magnetic stirring bar. The temperature gradually increased to 160°C in 3 hrs, and the reaction mixture was stirred continuously. Polymerizations are done at 120-160°C for 5 hrs. At the end of the reaction, the flask was cooled, and the product was dissolved in chloroform and subsequently precipitated in methanol. The resulting solid was filtered and dried Under vacuum at 60°C under vacuum for 24 hrs.
Figure 1: Granularity normal distribution chart for nano Ag
Powder PLA weighted grade (1 wt%) dissolved in chloroform to obtain 20 wt% solution of PLA by slowly in 60°C for 2 hours and cast on glass plates.PLA/ nano silver composite films were prepared by different weight percentages (2, 4 and 6%) nano silver and swollen in chloroform by mixing for 2 hours while polylactic acid dissolved in chloroform then nano solution were mixed by shearing mixer at 800 rpm for one hour to have good distribution and less agglomeration. Then cast on the glass plates and then kept at 60°C in the vacuum oven for 24 hour to ensure complete solvent removal. The thickness of PLA/ silver nanocomposite thickness of 120 µm.
UV-Vis Spectrophotometer
The UV- visible spectra recorded with the help of SHIMADZU UV- in range (300–800) nm. UV spectra gave information about transmission of pure PLA, and PLA/Ag nanocomposites.
RESULTS AND DISCUSSION
Transmission of Pure PLA and PLA/Ag Nanocomposites
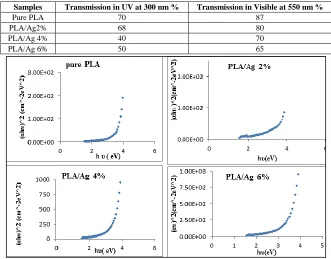
Figure 2 shows the variation of transmition as a function of wavelength of pure PLA at UV region is 70% and 87% at visible region. It can be observed from this figures that the transmition increase with increasing of (λ) for all Ag contact this revealed to the smooth reflecting surfaces of the samples and there was not much scattering loss at the surface. In PLA/Ag nanocomposites transparency is an effective index for providing information on the size of dispersed particles in the polymer matrix, typically observing aggregate domains larger than visible wavelength could obstruct light, leading to translucent or opaque films while highly dispersed nanoparticles in a transparent polymer matrix result in optically clear nanocomposites in visible light given that the size of particles is smaller than the wavelength. As shown in Table 1 the transmission at UV and visible spectra (300–800) nm wavelength.
In the visible range (400-700 nm), each wavelength causes a particular sensation of color as the eye is not equally sensitive to light emitted at all wavelength, the transparency of plastic sheeting is defined as the transmission of visible light in the short range of 540-560 nm. The measurement of the transmission percentage at 550 nm reveals that all substrates are transparent with around 87% for the pure PLA that show the highest transmittance, around 80% transmittance for the PLA/Ag at 2% samples and around 70% transmittance for PLA/Ag at 4% and 65% for PLA/Ag at 6% (Table 1).
Optical Energy Gap
Figure 3 represent the optical energy gap for pure PLA and PLA/Ag nanocomposites, for the pure PLA the band was (3.3) eV and decreased from (3.3-2.7) eV this indicated that allowed direct transition is involved which is due to Π – Π* transition. The experimental results to calculate the energy gap according to Tauce relation, indicate that the electronic transition for these polymer equal to (r=1/2).
Optical Constant
241
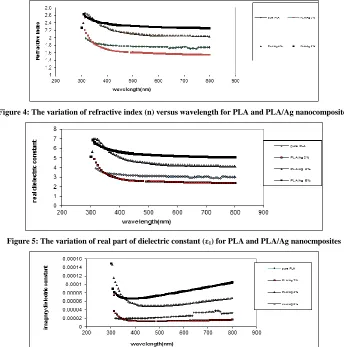
[image:4.612.164.451.107.408.2]that the values of refractive index decreasing slightly with increasing (λ) from (2.65-2.1) this behavior can be explained on the basic of that increasing silver (lowering the packing density) which in turn increase propagation velocity of light through them (Figures 5 and 6).
[image:4.612.140.471.441.700.2]Figure 2: Transmittance as function to wavelength for PLA, PLA/Ag nanocomposites
Table 1: UV-VIS transmission at selected wavelength (300 and 550) nm of pure PLA and PLA/Ag nanocomposites
Samples Transmission in UV at 300 nm % Transmission in Visible at 550 nm %
Pure PLA 70 87
PLA/Ag2% 68 80
PLA/Ag 4% 40 70
PLA/Ag 6% 50 65
242
[image:5.612.132.476.72.419.2]Figure 4: The variation of refractive index (n) versus wavelength for PLA and PLA/Ag nanocomposites
Figure 5: The variation of real part of dielectric constant (ε1) for PLA and PLA/Ag nanocmposites
Figure 6: The variation of imaginary part (ε2) versus wavelength for PLA and PLA/Ag nanocomposites
CONCLUSION
The dielectric constant of real part (ε1) and imaginary part (ε2) which depend on the frequency of the electromagnetic waves, the variation of (ε1) (ε2) with the wavelength of the incident radiation is due to the change of reflectance and absorbance. It can observe that the variation of ε has similar trend to the variation of (n) because of smaller values of k2 in comparison with n2 , where ε1=n2-k2 while the variation of ε2 mainly depends on the variation of k values which are related to the variation of α , where ε2=2nk.
REFERENCES
[1] MK Sangale; M Shahnawaz; B Ade. J Bioremediation Biodegradation. 2012, 3, 164.
[2] Y Tokiwa; P Buenaventurada; Calabia; U Charles; Ugwu; A Seiichi. Int J Mol Sci. 2009, 10, 3722-3742. [3] M Sharma; P Sharma; A Sharma; S Chandra. J Microbiol. 2015, 4(1).
[4] R Kavitha; KM Anju; V Bhuvaneswari.Int J Plant Animal Environ Sci.2014. [5] AP Mathew; K Oksman; M Sain. J Appl Poly Sci. 2005, 97, 2014-2025.
[6] S Sandeep; Laxmeshwar; S Viveka; MDJ Kumar; GK Nagaraja. Der Pharma Chemica. 2012, 4(1):159-168.
[7] L Suryanegara; AN Nakagaito; H Yano. Composites Sci Technol. 2009, 69(7-8), 1187-1192.
[8] S Sandeep; Laxmeshwar; S Viveka; MDJ Kumar; GK Nagaraja. Der Pharma Chemica. 2012, 4(1):159-168.
243
[11] F Fina; A Geobaldo; G Venturello; Camino; Fukushima. Express Polym Lett. 2012,6(11), 914-926.
[12] N Nakayama; CJ Grande; FG Torres; CM Gomez; OP Troncoso; JC Ferrer; JP Martinez; H Toyoharu.
Polym Degrad Stability Compos. 2008, 16, 181.