Patient Process Flow Improvement:
Value Stream Mapping
Siti Haizatul Aishah Haron (Corresponding author)
Faculty of Technology Management and Business
University of Tun Hussein Onn Malaysia, Batu Pahat, Johor, Malaysia
E-mail: [email protected]
Rohaizan Ramlan
Faculty of Technology Management and Business,
University of Tun Hussein Onn Malaysia, Batu Pahat, Johor, Malaysia
E-mail: [email protected]
Received: August 14, 2014 Accepted: November 28, 2014 Published: February 1, 2015
doi:10.5296/jmr.v7i2.6988 URL: http://dx.doi.org/10.5296/jmr.v7i2.6988
Abstract
Value stream mapping (VSM) is one of a lean technique and a preferred tool to visualize and understand a process flow that involves process mapping technique. VSM is drawn as pictures of processes with the purpose of identifying the flow of work, information, as well as understanding the structure of departments. It helps to reduce waste and lead time in delivery service and even support the administration and management. The application of VSM in Malaysia healthcare is still in early stage. The crucial issue concerned is the long waiting time faced by patient. Therefore, the objective of this study is to improve the process flow of patient by reducing lead time and waste. This study focuses on applying VSM in clinic which involve quantitative data collection. The result provides clear evidence in reducing the lead time and waste by using VSM which has been proposed in the future state map.
1. Introduction
Lean had been successfully employed in manufacturing industries. Lean is one of the best techniques used in the search of process improvement where it has been defined as elimination of wastes. There are wastes that can be avoided and also unavoidable waste (Erfan, 2010). In other words, lean adopt a large set of concepts and tools to reduce waiting time, and quicken the response in all process of delivery (Wan & Chen, 2008). Generally, there are seven types of wastes. The wastes that have been described are defects, transport, motion, inventory, processing, over-production, and waiting. Stone (2012) defined lean as the continuous identification and waste removal from an organization’s processes, leaving only value added activities in the value stream. The tools listed in lean were aimed to identify and remove waste or non-value added activities from the system continuously.
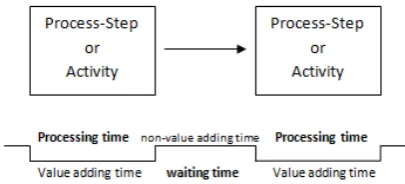
[image:2.595.190.403.530.732.2]VSM is one of a preferred tool to visualize and understand a process flow in industry through process mapping technique (Nash & Poling, 2008). VSM use icons and notations as shown in Figure 1 and Figure 2 to demonstrate the process flow. Value Stream Maps are drawn as pictures including icons of the process that is simple, but logical and powerful representations of the process which comprise the document of both the current state (reality) and the future state (goal) (Nash & Poling, 2008). Value Stream Mapping (VSM) allows the identification of the process steps that do not add quality or value to the customers. It is possible for an organization to increase efficiency, consistency and customer satisfaction. VSM was proven as an ideal tool to eliminate waste and reducing lead time in healthcare emergency departments (Erfan, 2010; Koelling et al, 2005). However, the application of VSM in Malaysia healthcare is still in early stage. The crucial issue concerned is the long waiting time faced by patient. Therefore, this study attempts to improve the process flow of patient by reducing lead time and waste using VSM. The background of this study and conceptual framework are reviewed in next section. After that, current map and future map are explained. Then, data analysis details and result are recorded. Towards the end, the result obtained from this study is concluded with some recommendations for further research.
Figure 2. Value Stream Mapping Notations
1.1 Lean in Healthcare
The emergence of lean in healthcare or also known as lean healthcare was discovered reaching the healthcare around the year of 2000 as mentioned by McClean et al. (2008). The discussion on lean applied in healthcare had been done in previous studies since a couple decades ago. A study on application of lean in healthcare by Womack and Jones (2008) about the medical system was pointing out the steps that should be taken by healthcare when implementing lean. Ongoing need for improved quality and efficiency in healthcare had demand an arising number of lean utilization in this sector. According to Burgess and Radnor (2013) the lean application in healthcare had been obvious as a medium to eliminate waiting time, repeat visits, errors and inappropriate procedures. Lummus et al. (2006) had supported this statement by mentioning that lean eliminate those that fail to add value as well as enhances the process steps that are valuable and crucial for patient care in his study.
Implementing lean technique in healthcare organization, will reduce errors, eliminate non-value added activities, standardize the patient flow and simultaneously making the healthcare facilities more competitive (Kamma, 2010). This statement is supported by Lummus et.al (2006) that mentioned in their study, lean approach work perfectly in lower patient wait time and lead time. Therefore, total lead time in healthcare can be improved by changing the layout using Promodel (Ramlan, et al., 2010), redesign the patient flow (Matthews, 2013), modify the system using VSM (Lummus, et al., 2006) and many more.
McClean et al (2008) stated that applying lean healthcare will make the value streams be more noticeable, and when the value streams are fully understood, it can remove redundancy, delay, unnecessary travel on the part of the patient, unnecessary consultations or other appointments, and the need for remedial clinical intervention. Value Stream Mapping technique has been applied numerously in healthcare industry especially emergency departments (Nash & Poling, 2008; Koelling et al., 2005; Gill, 2012).
1.2 Healthcare in Malaysia
1.2.1 Clinic
Clinic is one of healthcare facilities which play an important role in delivering service to patient. Clinics can be either, privately run or publicly managed by the government. It is in charge of providing care for simple and minor injuries to a small number of patients compared with hospitals and other healthcare. In this study, the clinic operates twice a week, which is on Monday and Wednesday from 7.30am to 4.30pm and split into 2 shifts; morning and afternoon shift. Since that this clinic operates twice a week only, the number of patients are quite a lot. Long waiting time brings uneasiness and uncomfortable for the patient.
1.2.2 Process Flow of Patient
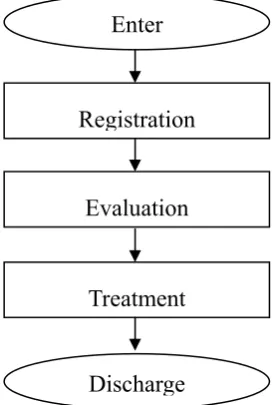
[image:4.595.239.377.406.609.2]According to the procedures in the clinic, when the patients arrive at the clinic, they have to register themselves at the registration counter and wait to be called for the evaluation process. The procedure during the registration process is the nurse/officer will find the patient’s card to check the past record and the registration numbers will be given to the patient. Evaluation process in this clinic involved the process of measuring body weight, taking blood pressure, urine test, blood test, and checking the growth of foetus. After finish the evaluation process, patient have to wait again before undergoes treatment process. The waiting time before the treatment process is much longer to be compared to the waiting before the evaluation process. Figure 3 shows the service delivery process flowchart of patient at the clinic.
Figure 3. Process flowchart of patient.
1.3 Methodology
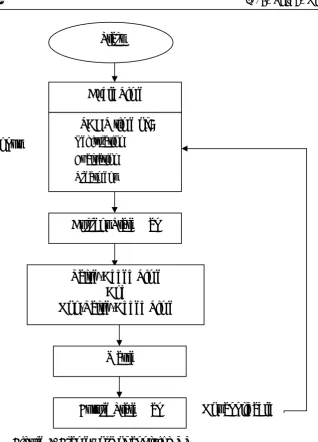
The data for this study was collected quantitatively from a clinic in Johor, Malaysia during the morning shift which is from 7.30 am to 1.00 pm where it has the most patient attend compared to evening shift. The principle of waiting used in this study is first in, first out (FIFO) where the first patient arrives will be served first. Figure 4 shows the framework used as a method to conduct this study.
Enter
Registration
Discharge Evaluation
Figure 4. Framework of applying VSM
2. Data Analysis and Result
According to Erfan (2010), takt time is an important tool for the assessment of the current system where it is used to eliminate over-servicing. It is better to calculate the takt time as it will provide insight of patient expectations and allows better observations during the initial mapping process (Nash & Poling, 2008). According to the data collected, the average of total patient visits are 22 visits per day for morning shift. So the takt time for each process of the service is the same as stated in Table 1.
Takt Time = Net available time for identified time period Number of demand for the same time period
Start
Input
Not applicable Cycle Time
TAKT time of: • Registration
• Evaluation
• Treatment
Current State Map
Value-Added Time And
Non-Value-Added Time
Waste
Table 1. Takt time for each operation
Operation Takt time
registration 900 sec
evaluation 900 sec
treatment 900 sec
[image:6.595.71.523.287.383.2]Based on the takt times that have been calculated, 900 seconds are available for each patient to be served by the staff. The average time is based on the number of patient visit to the clinic for each day.
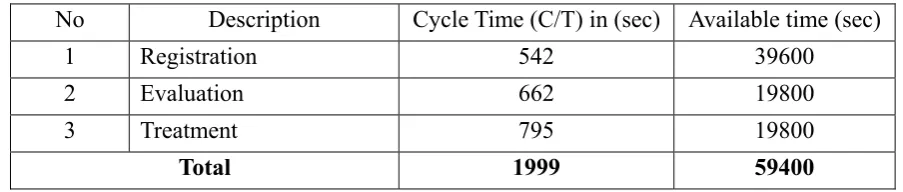
Table 2. Data collection of maternity clinic operations
No Description Cycle Time (C/T) in (sec) Available time (sec)
1 Registration 542 39600
2 Evaluation 662 19800
3 Treatment 795 19800
Total 1999 59400
Table 2 shows data collection of the clinic operations where the cycle time for each process is calculated. From the data, it shows that the registration process has the longest available time which is 39600 seconds because the process was done by 2 staff. Meanwhile, evaluation process has 662 seconds cycle time with 19800 seconds available time. The process of treatment is the most time consuming with the cycle time 795 seconds where it is the longest time compared to the other operations. When the cycle time for the operation is longer, the capacity to serve the patient will decrease.
2.1 Current Process Flow of Patient
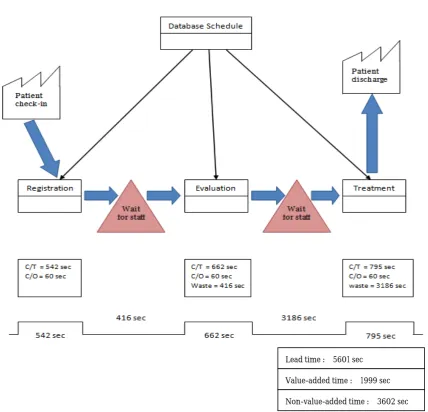
Figure 5. Current State Map
2.1.1 Value-Added Time vs. Non-Value-Added Time
Value-added time can be defined as time for any activity that the customer is willing to pay or the only time on VSM that lean practitioners want to see. Non-value-added time is any time (activity) that the customer is not willing to pay, or waste and need the focus of Lean improvement (Nash & Poling, 2008). By identifying the non-value-added time, it will make the waste visible. Even though not all wastes that have been listed can be eliminating by identifying the non-value-added time, it will provide an insight of improvement in the process flow. As shown in figure 5, value-added time and non-value-added time for the current state are 1999 seconds and 3602 seconds. In this study, value added time is equal to the total of cycle time for each operation, while non-value-added time is equal to the total waiting time for patient before being attend by the staff. Since non-value-added time consumes much longer time than the value-added time, waste occurred. Thus, this study attempt to reduce the non-value added time in order to gain better result.
Lead time : 5601 sec
Value-added time : 1999 sec
2.1.2 Identification of Waste and Data Requirement
[image:8.595.55.547.571.733.2]From the current state map in Figure 5, it had revealed that there are wastes during the evaluation and treatment process which is the waiting time for the patient to be attended. The total lead time for 1 patient is 5601 seconds (including value-added time and non-value added time). In this study, available time of the staff, capacity of patient per day, number of utilized time and idle time is calculated as part of data requirement.
Table 3. Data of the current state
No. Operation
Cycle Time (C/T) in sec No. of Staff Available Time of Staff (sec)
No. of patient per Day Utilized Time = 24 x C/T Idle Time
1 Registration 542 2
19800 x 2 =
39600 73 13008 26592
2 Evaluation 662 1 19800 29 15888 3912
3 Treatment 795 1 19800 24 19080 720
Total 1999 4 79200 47976 31224
Data from Table 3 shows that the process of registration has the highest idle time among the three processes which is 26592 seconds and the lowest utilized time because the number of staff in charge is 2 person. The process of treatment has the lowest number of patients which is only 24 patients for each day. This is due to the long cycle time for the operation which is 795 seconds and it is conducted by 1 staff only. It has the highest number of utilized time and the lowest number of idle time. Besides, the treatment process also has the lowest capacity to attend the patient due to the limited number of staff but long cycle time to complete the process. This study combined the operation and reschedules the staff in order to minimize the total lead time and reduce waste.
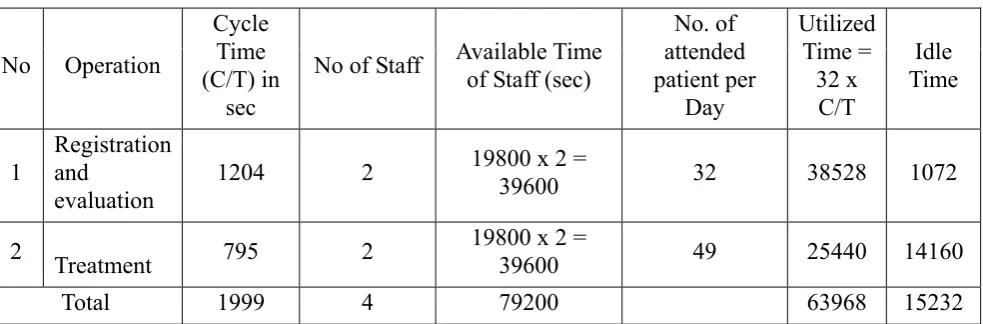
2.2 Proposed Plan for Future Process Flow of Patient
Table 4. Proposed data for the future state
No Operation
Cycle Time (C/T) in
sec
No of Staff Available Time of Staff (sec)
No. of attended patient per Day Utilized Time = 32 x C/T Idle Time
1 Registration and evaluation
1204 2 19800 x 2 =
39600 32 38528 1072
2 Treatment 795 2 19800 x 2 = 39600 49 25440 14160
Total 1999 4 79200 63968 15232
increase the number of attended patient for each day, increase the number of utilization time and also reduce the number of idle time. For improvement, a few changes have been made. The registration and evaluation process are combine so that the 2 processes will be done by the same staff. The remaining staff from the earlier process is assigned to the treatment process, so that the process will be done by 2 staff. Earlier, the treatment process was done by 1 staff only and the clinic manages to attend 24 patients. If the treatment process is done by 2 staff, the capacity of patient serve will increase to 32 patients. As the operation of registration and evaluation combined, the number of utilization time is increased to 38528 seconds while the idle time is reduced to 1072 seconds.
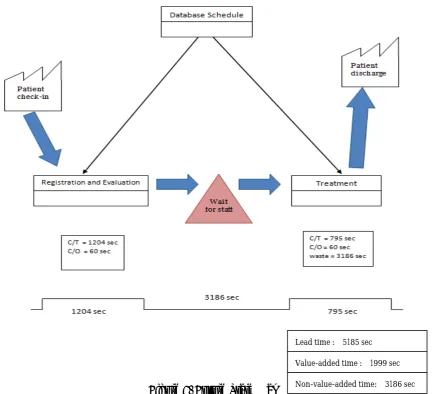
[image:9.595.95.530.351.745.2]The proposed improvement will affect the result by increasing the utilization time, reducing the idle time as well as increasing the number of attended patient each day by maintaining the number of staff in the clinic. Besides, the number of waiting time for the patient also decrease compared to the current process flow. Figure 6 shows that the total lead time for the future state map is reduced to 5185 seconds compared to the total lead time during the current state map, 5601 seconds. The improvement that have been proposed for the future state map shows a better result to the clinic and help the clinic to perform and deliver better service to patient.
Figure 6. Future State Map
Lead time : 5185 sec
Value-added time : 1999 sec
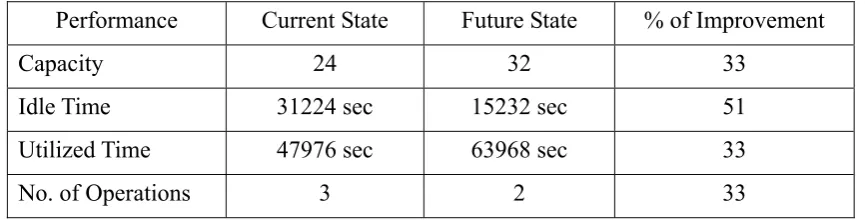
Table 5. The comparison in performance of Current State and Future State
Performance Current State Future State % of Improvement
Capacity 24 32 33
Idle Time 31224 sec 15232 sec 51
Utilized Time 47976 sec 63968 sec 33
No. of Operations 3 2 33
Table 5 shows the comparison in performance of Current State and Future State. From the table, the capacity of the patient is increased by 33% from 24 to 32 patients. The number of idle time is also improved by 51% which is from 31224 seconds reduced to 15232 seconds only. In fact, the number of utilized time also increased from only 47976 seconds during the current state, to 63968 seconds in the future state.
3. Conclusion
In nutshell, Value Stream Mapping has been proven as a useful technique when implementing change for improvement. In this study, VSM had succeeded in reducing the total lead time and waste in process flow of patient. Regarding to the performance, the capacity of patient, total utilized time and the idle time have been improved through the same technique. In future, for continuous improvement in patient process flow can be done by adding the number of staff, removing unnecessary motion, improving the task and service performance.
Acknowledgement
This research was supported by Malaysian Ministry of Higher Education (MOHE) under Exploratory Research Grant Scheme (ERGS) to the Office of Research, Innovation, Commercialization and Consultancy (ORRIC) at the Universiti Tun Hussein Onn Malaysia (vot:E045).
References
Burgess, N., & Radnor, Z. (2013). Evaluating Lean in healthcare. International journal of health care quality assurance, 26(3), 220-235. http://dx.doi.org/10.1108/09526861311311418
Erfan, O. M. (2010). Application of lean manufacturing to improve the performance of health care sector in Libya. International Journal of Engineering & Technology IJET-IJENS, 10(6),
117-128.
Gill, P. S., (2012). Application of Value Stream Mapping to Eliminate Waste in an Emergency Room. Global Journal of Medical Research, 12(6), 51-56.
Kamma, T. K. (2010). Framework for lean thinking approach to healthcare organizations: Value stream mapping to reduce patient waiting time. Southern Illinois University,
Carbondale.
mapping the emergency department. Grado Department of Industrial and Systems
Engineering, Virginia Tech. Blacksburg, VA.
Lummus, R. R., Vokurka, R. J., & Rodeghiero, B. (2006). Improving quality through value stream mapping: a case study of a physician's clinic. Total Quality Management, 17(8),
1063-1075. http://dx.doi.org/10.1080/14783360600748091
Matthews, L. (2013). Process mining to facilitate process improvement in a healthcare environment: An emergency department case study (Doctoral dissertation, STATE UNIVERSITY OF NEW YORK AT BINGHAMTON).
McClean, S., Young, T., Bustard, D., Millard, P., & Barton, M. (2008). Discovery of value streams for Lean Healthcare. In Intelligent Systems, 2008. IS'08. 4th International IEEE
Conference, (Vol. 1, pp. 3-2-3-8). IEEE.
MOH. (2010). Country health plan 2011-2015. Retrieved 05 January 2014 from www.moh.gov.my/images/gallery/Report/Country_health.pdf
Nash, M. A., & Poling, S. R. (2011). Mapping the total value stream: A comprehensive guide for production and transactional processes. CRC Press.
Ramlan, R., Ismail, S. N., Kassim, N. A., (2010). Aplikasi Promodel Dalam Mengkaji Masa Menunggu Rawatan Di Klinik. Prosiding Seminar Kebangsaan Aplikasi Sains dan Matematik 2010. Johor Bahru, Malaysia
Stone, K. B. (2012). Four decades of lean: a systematic literature review. International Journal of Lean Six Sigma, 3(2), 112-132. http://dx.doi.org/10.1108/20401461211243702
Wan, H. D., & Frank Chen, F. (2008). A leanness measure of manufacturing systems for quantifying impacts of lean initiatives. International Journal of Production Research, 46(23),
6567-6584. http://dx.doi.org/10.1080/00207540802230058
Womack, J. P., Jones, D. T., & Roos, D. (2008). The machine that changed the world. Simon
and Schuster.
Copyright Disclaimer
Copyright for this article is retained by the author(s), with first publication rights granted to the journal.