Available online on www.ijpsr.com 289 IJPSR (2011), Vol. 2, Issue 2 (Research Article)
Received on 19 September, 2010; received in revised form 12 December, 2010; accepted 11 January, 2010
FORMULATION AND IN-VITRO EVALUATION OF ZIDOVUDINE LOADED ETHYL CELLULOSE MICROCAPSULES
Amitava Ghosh 1, Abhradeep Saha 1,Sujit Das 1 andTanmoy Ghosh*2
Department of Pharmaceutics, Himalayan Pharmacy Institute 1,Majhitar, Rangpo, Sikkim, India
Himachal Institute of Pharmacy 2, Rampur Ghat Road, Ponta Sahib, Distt. Sirmour Himachal Pradesh, India
ABSTRACT
Microencapsulation is a well-known method that is used to modify and retard drug release. In this study, the preparation of Zidovudine loaded microcapsule was accomplished in order to assess the suitability of them for production of oral/vaginal sustained release multiparticulate dosage form of Zidovudine. Microcapsules were prepared using the solvent evaporation method. The effect of formulation variable like polymer: drug ratio was investigated on shape and surface characteristics of microcapsules (by scanning electron microscopy), percentage yield and drug entrapment efficiency, mean particle size and drug release profiles (dissolution test). Microscopic examination of microcapsules revealed that microcapsules were well-shaped and nearly spherical. FTIR studies revealed that no interactions were found between the drug and the polymer. The particle size of all the formulations were found to be satisfactory and within the range of 60.06 to 85.28 μm The percentage yield of all the formulation was found to be satisfactory except MC5. The percentage yield varied from 60.16 to 92.52% suggesting that the processing parameters did not affect the yield from the solvent evaporation method. Dissolution studies were carried out and zero order, first order and higuchi kinetics were implemented to predict the release kinetics. To justify the result Korsmeyer and Peppas model was applied and data shows that all formulations released the drug by diffusion following Fickian (n<0.5) transport mechanism.
Keywords:
Zidovudine, Microparticles, Kinetic studies, Sustained release
Correspondence to Author:
Tanmoy Ghosh
Himachal Institute of Pharmacy, Rampur Ghat Road, Ponta Sahib, Distt. Sirmour Himachal Pradesh, India
Available online on www.ijpsr.com 290
INTRODUCTION: Zidovudine is active against
human immunodeficiency virus (HIV-1&2) which is a retrovirus. Zidovudine is a first antiretroviral drug was developed in 1987. It is useful in prolonging life and postponing complications of acquired immunodeficiency syndrome (AIDS) or AIDS related complex (ARC), but does not cures the infection. The clinical efficacy of antiretroviral drug is monitored primarily by plasma HIV-RNA assays and CD4 lymphocyte count carried out at regular intervals 1, 2.
The main objective of any drug therapy is to achieve desired concentration of drug in blood or tissue which is therapeutically effective and nontoxic for extended period of time. This goal can be achieved by proper design of sustained release dosage regimen 3, 4. Microencapsulation is a common technique used in the production of sustained release dosage forms. Microcapsule based drug delivery system has received considerable attention in recent years. Numbers of methods have been devised to prepare microcapsules of desired size, shape and surface properties 5. Ethyl cellulose microcapsules have been extensively studied for controlled release 6, 7,
8
. Ethyl cellulose being insoluble in water serves as good candidate for sustained release of drug. The aim of this study was to prepare ethyl cellulose microcapsules containing Zidovudine to achieve a controlled drug release profile suitable for oral or vaginal administration.
MATERIALS: Zidovudine (Pure grade) was received
as a gift sample from Apl Research center (A division of Aurobindo pharma Ltd) A.P, India, Ethyl cellulose (analytical grade) was purchased from Sd-Fine chemicals, Mumbai; All other chemicals used are analytical.
METHODS:
Preparation of Microcapsules:
Solvent Evaporation Method 9, 10: Zidovudine
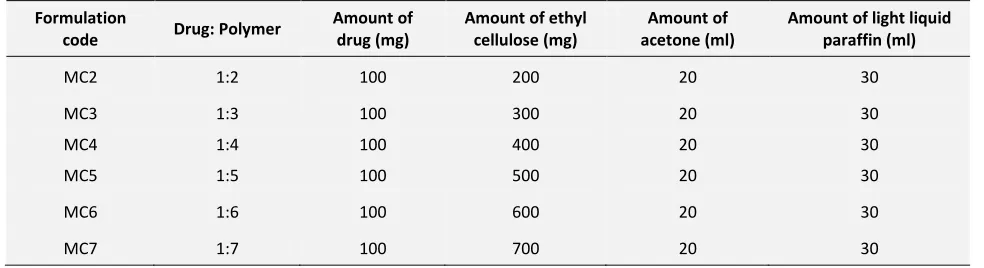
[image:2.612.62.554.561.695.2]microcapsules were prepared by the solvent evaporation method. This process was carried out in a liquid manufacturing vehicle. In this process the coating material Ethyl Cellulose polymer in different ratio; (1:2 to 1:7) is dissolved in a volatile solvent (20 ml acetone), which is immiscible with the liquid manufacturing vehicle phase (Light liquid paraffin). A core material (100 mg Zidovudine) to be microencapsulated is dissolved or dispersed in the coating polymer solution. With continuous stirring, the core coating material mixture is dispersed in the liquid manufacturing vehicle phase (30 ml Light liquid paraffin). Stirring is continuing for 3 hr to evaporate the volatile solvent and to obtain the appropriate size of microcapsule. Microcapsules were recovered by treating with petroleum ether or n-hexane. The code of the microcapsule is given as MC2 (1:2), MC3 (1:3), MC4 (1:4), MC5 (1:5), MC6 (1:6), and MC7 (1:7). The microcapsules prepared along with their individual composition are listed in table 1.
TABLE 1: FORMULATION DESIGN OF ZIDOVUDINE LOADED MICROCAPSULE PREPARED BY SOLVENT EVAPORATION METHOD Formulation
code Drug: Polymer
Amount of drug (mg)
Amount of ethyl cellulose (mg)
Amount of acetone (ml)
Amount of light liquid paraffin (ml)
MC2 1:2 100 200 20 30
MC3 1:3 100 300 20 30
MC4 1:4 100 400 20 30
MC5 1:5 100 500 20 30
MC6 1:6 100 600 20 30
Available online on www.ijpsr.com 291
Evaluation of Microcapsules:
Drug Polymer Interaction Study:
Fourier Transform Infrared Radiation
measurement (FTIR) 11: The FTIR spectral
measurements were taken at ambient temperature using IR spectrophotometer (Shimadzu, model 840, Japan). Two mg of pure drug, empty microcapsules, drug loaded microcapsules, were selected separately and measured in the range of 4000-400 cm-1 for 100 scans.
Particle Size Measurement 12: The microcapsule
size distribution was determined by the optical microscopy method using a calibrated stage micrometer (μm) was calculated by using following equation;
Where n= no of particles in each size range, d= mean of size range (µm) and D= Average particle diameter (µm).
Percentage Yield 13: The yield was calculated as the
weight of the microcapsules recovered from each batch divided by total weight of drug and polymer used to prepare that batch multiplied by 100. All the experimental units were analyzed in triplicate (n=3).
Drug Content Estimation 14: Drug loaded
microcapsules (100 mg) were dissolved in acetone (2 ml) and suspended in 100 ml of acetate buffer pH 4.7 solution. The resultant dispersion was kept for 20 min for complete mixing with continuous agitation and filtered through a 0.45 μm membrane filter. The drug content was determined spectrophotometrically (UV-1700, Shimadzu, Japan) at 267 nm using a regression equation derived from the standard graph (r2=0.999). All the experimental units were analyzed in triplicate (n=3).
Drug Entrapment Study 13: The drug entrapment
efficiency (DEE) was calculated by the equation DEE (%) = (Pc / Tc) X 100
Pc is practical drug content; Tc is the theoretical drug content. All the experimental units were analyzed in triplicate (n=3).
Loose Surface Crystals Study 15: The Zidovudine
loaded microcapsules were evaluated by loose surface crystal study to observe the excess drug present on the surface of microcapsules. From each batch, 100 mg of microcapsules was shaken in 20 ml of acetate buffer pH 4.7 for 5 minute and then filtered through Whatman filter paper 41. The amount of drug lost in filtrate was determined spectroscopically and calculated as a percentage of total drug content.
Bulk Density 16: A simple test has been developed
to evaluate the flowability of a powder by comparing the poured density (ρBmin) and tapped
density (ρBmax) of a powder and the rate at which it
packed down. The product was tapped using bulk density apparatus for 1000 taps in a cylinder and the change in volume was measured.
The Carr’s index and Hausner ratio were calculated by using following formula;
Carr’s index (%) = Tapped density – Poured density X 100 Tapped density
Hausner’s ratio = Tapped density X 100 Poured density
Available online on www.ijpsr.com 292
Poured density (or porosity) 14: True densities of
microcapsules and drug were determined psychometrically by employing n-hexane as a displacement fluid. Porosity (%) was calculated by the following formula
Porosity (e) = [1- (ρt / ρg)] X 100
Where, ρt= tap density and ρg= true density
Scanning Electron Microscopy (SEM) 17: Scanning
electron microscopy was carried out to study the morphological characteristics of Zidovudine microcapsules. The dried microcapsules were coated with gold (100A°) under an argon atmosphere in a gold coating unit and Scanning electron micrographs of both higher and lower resolutions were observed.
In-Vitro Drug Release Study 18: In-vitro Zidovudine release rate was carried out using USP XXI basket type dissolution test apparatus using acetate buffer pH 4.7 as dissolution medium. Volume of dissolution medium was 900 ml and bath temperature was maintained at 37 ± 0.5°C throughout study period. The rotating rate of the basket was adjusted to 50 rpm. At different
intervals, 5 ml of sample was withdrawn and the equivalent volume of the medium with the same temperature was added to the dissolution vessel. The absorbance values of the sample were measured by UV-Visible spectrophotometer at the wavelength of 267 nm.
In Vitro Drug Release Kinetic Study 19: The kinetic of drug release from microcapsule, was analyzed according to different kinetic equations viz. zero order, First order, and Higuchi model.
RESULTS AND DISCUSSIONS: The Zidovudine
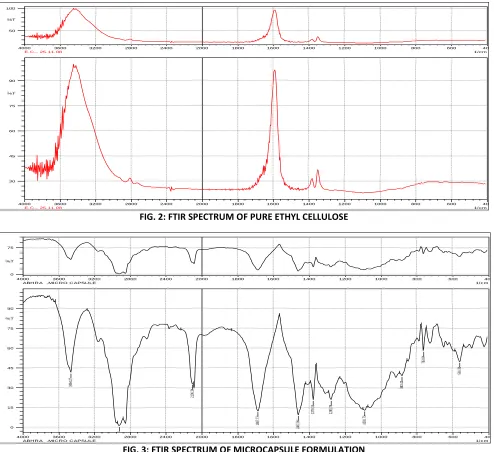
loaded ethyl cellulose microcapsules were prepared by solvent evaporation method which is abridged in table 1. The spectrums of microcapsules were compared with the spectrum of original Zidovudine. The drug-polymer interaction study were performed using FT-IR spectrophotometer and six band appeared in Zidovudine spectrum at 3405, 3343, 1093, 1668, 1697, 2911 and 2957 cm-1due to the formation of N-H, O-H, C=O, C-H linkage respectively, identified in the formulation spectrum, confirming no interaction between the drug and the polymers as shown in fig. 1-3.
400 600 800 1000 1200 1400 1600 1800 2000 2400 2800 3200 3600 4000 1/cm 0 75 %T ZIDOVUDINE-- 25.11.08 400 600 800 1000 1200 1400 1600 1800 2000 2400 2800 3200 3600 4000 1/c m 0 15 30 45 60 75 90 %T 34 00 .6 2 33 69 .7 5 31 59 .5 1 29 62 .7 6 29 26 .1 1 28 52 .8 1 24 80 .5 4 21 21 .7 7 20 87 .0 5 16 97 .4 1 16 62 .6 9 14 85 .2 4 14 33 .1 6 12 78 .8
5 1253
.7
7 1228
.7 0 10 97 .5 3 98 5. 66 88 5. 36 76 1. 91 56 1. 30 50 1. 51 43 0. 14
[image:4.612.64.549.439.675.2]Z IDOVU DINE-- 25.11.08
FIG. 1: FTIR SPECTRA OF PURE DRUG (ZIDOVUDINE)
Available online on www.ijpsr.com 293 400 600 800 1000 1200 1400 1600 1800 2000 2400 2800 3200 3600 4000 1/c m 50 100 %T E.C-- 25.11.08 400 600 800 1000 1200 1400 1600 1800 2000 2400 2800 3200 3600 4000
1/ c m 30 45 60 75 90 %T
[image:5.612.62.556.70.522.2]E. C -- 25. 11. 08
FIG. 2: FTIR SPECTRUM OF PURE ETHYL CELLULOSE
400 600 800 1000 1200 1400 1600 1800 2000 2400 2800 3200 3600 4000 1/c m 0 75 %T
ABHRA -MICRO CAPSULE
400 600 800 1000 1200 1400 1600 1800 2000 2400 2800 3200 3600 4000
1/ c m 0 15 30 45 60 75 90 %T 34 64 .2 7 29 24 .1 8 21 06 .3 4 16 87 .7 7 14 62 .0 9 13 79 .1 5 12 80 .7 8 10 91 .7 5 88 3. 43 76 3. 84 56 1. 30
ABH R A -MI C R O C APSU LE
FIG. 3: FTIR SPECTRUM OF MICROCAPSULE FORMULATION
[N-H Stretching = 3405, 3343, O-H bending = 1093, C=O Stretching = 1668, 1697, C-H Stretching = 2911, 2957] Particle size range of the microcapsules was
determined by using optical microscope in 10x optical zoom. Particle size measurements of microcapsules were summarized in table 2. The particle size of all the formulations were found to be satisfactory and within the range of 60.06 to 85.28 μm The percentage yield of all the formulation was found to be satisfactory except MC5 as shown in table 3.
TABLE 2: PARTICLE SIZE MEASUREMENT OF MICROCAPSULES
Formulation code Average particle diameter (µm)
MC2 60.06±0.14
MC3 62.73±0.99
MC4 75.68±0.55
MC5 77.24±0.38
MC6 81.10±0.75
MC7 85.28±0.75
Available online on www.ijpsr.com 294 TABLE 3: EVALUATION OF YIELD VALUE, % OF YIELD, DRUG CONTENT, AND ENCAPSULATION EFFICIENCY OF ZIDOVUDINE LOADED MICROCAPSULES
Formulation code Yield (mg) % of yield Drug content (mg) Encapsulation efficiency (%)
MC2 237.33±1.20 79.10±0.39 19.31±0.73 45.83±1.62
MC3 305.33±0.88 76.33±0.21 18.27±0.28 55.78±0.97
MC4 421.33±0.88 84.26±0.17 23.35±0.19 98.34±0.93
MC5 361±1.15 60.16±0.19 14.14±0.52 51.07±1.91
MC6 647.66±0.88 92.52±0.12 8.10±0.04 52.48±0.34
MC7 702±2.08 87.74±0.25 13.17±0.15 92.48±1.24 *All the results are expressed Mean ± SEM (n=3)
The percentage yield varied from 60.16 to 92.52% suggesting that the processing parameters did not affect the yield from the solvent evaporation method. The drug content found in formulation MC4 is higher and lower drug content was found in formulation MC6 and formulation MC2, MC3, MC5, MC7 drug content was found in less than 20 mg, as shown in table 3. Drug entrapment efficiency (DEE) of MC4 and MC7 formulation was found to be high because, the drug solubility in external phase was very less and the drug is fully dispersed in the polymer phase by continuous stirring for a longer period. The loose surface crystal study helps to
estimate the excess amount of drug attached on the surface of microcapsules after a successful drug entrapment. The least value obtained indicates the proper encapsulation and minimum drug loss. The results are tabulated in table 4.
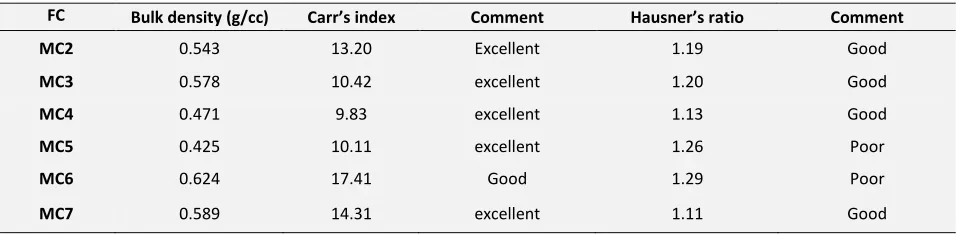
The bulk density was found to be in the range of 0.425 to 0.624. The microcapsule of all formulation had Carr’s index in range of 9.83 to 17.41. The Hausner’s ratio was found in between 1.11 to 1.29. Therefore, MC2, MC3, MC4 and MC7 formulations usually give excellent flow properties
[image:6.612.60.554.97.228.2](table 5).
TABLE 4: LOOSE SURFACE CRYSTALS STUDY OF ZIDOVUDINE LOADED MICROCAPSULES
Formulation code Drug content in filtrate (mg) Loaded drug content % total drug content
MC2 2.28 19.31 11.85
MC3 0.73 18.27 4.03
MC4 0.92 23.35 3.94
MC5 2.00 13.17 14.14
MC6 1.07 8.10 13.32
MC7 1.21 14.14 9.19
TABLE 5: MICROMERITICS ANALYSIS OF DIFFERENT MICROCAPSULES FORMULATION
FC Bulk density (g/cc) Carr’s index Comment Hausner’s ratio Comment
MC2 0.543 13.20 Excellent 1.19 Good
MC3 0.578 10.42 excellent 1.20 Good
MC4 0.471 9.83 excellent 1.13 Good
MC5 0.425 10.11 excellent 1.26 Poor
MC6 0.624 17.41 Good 1.29 Poor
[image:6.612.68.547.450.557.2] [image:6.612.68.550.580.697.2]Available online on www.ijpsr.com 295
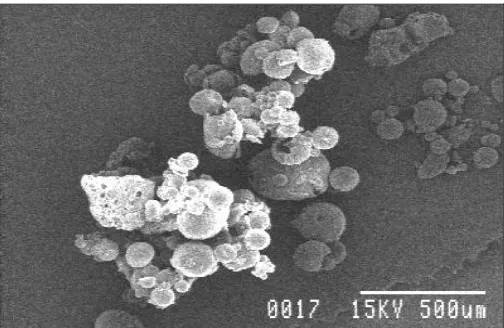
To determine the surface morphology of the microcapsules, SEM of the microcapsules were performed. Scanning electron micrographs of Zidovudine loaded microcapsules shows (fig. 4 and
fig. 5) that microcapsules obtained were discrete,
spherical and uniform in size.
FIG. 4: SCANNING ELECTRON MICROGRAPH OF MICROCAPSULES (MC4) UNDER LOWER RESOLUTION OF X 30
FIG. 5: SCANNING ELECTRON MICROGRAPH OF MICROCAPSULES (MC4) UNDER HIGHER RESOLUTION OF X 300
All the formulations were found to be release Zidovudine in a sustained manner for a prolonged period over 24 hour and it can be seen that the MC4 shows only 63.36% cumulative drug release over the period of 24th hr where all other formulations give more than 70% drug release in the same period of time. To describe the kinetic of drug release from microcapsule, release data was analyzed according to different kinetic equations.
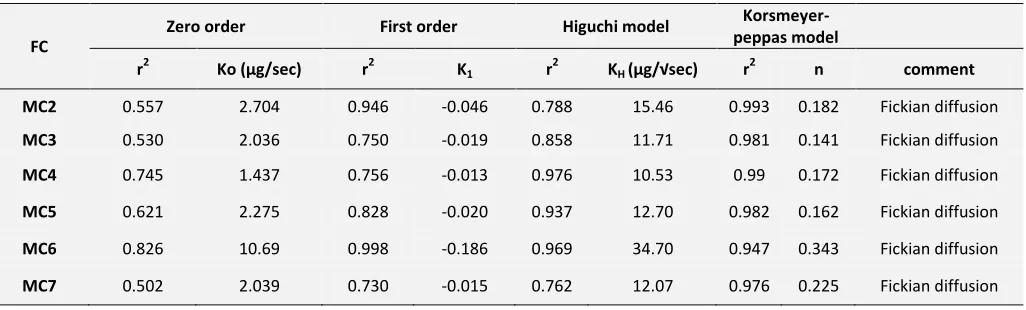
The zero order, First order, and Higuchi model kinetic are described in all microcapsule formulations and abridged in fig. 6- 8, and table 6. The formulations MC2 and MC6 obey first order kinetic and has dependent on formulation variations. The formulations MC3, MC4, MC5 and MC7 followed Higuchi square root kinetic and have diffusion controlled release rate which is dependent on concentration of release retarding polymer with process variables. To justify the result Korsmeyer and Peppas model was applied and data shows that all formulations released the drug by diffusion following Fickian (n<0.5) transport mechanism.
FIG. 6: IN VITRO ZERO ORDER RELEASE PROFILE OF ZIDOVUDINE LOADED MICROENCAPSULATED FORMULATIONS
[image:7.612.46.298.170.334.2] [image:7.612.316.569.289.451.2] [image:7.612.47.299.369.527.2] [image:7.612.314.569.489.657.2]Available online on www.ijpsr.com 296
FIG. 8: HIGUCHI RELEASE KINETICS OF THE ZIDOVUDINE LOADED MICROENCAPSULATED FORMULATIONS
CONCLUSION: The solvent evaporation method
[image:8.612.47.297.72.229.2]was successful in production of Zidovudine loaded ethyl cellulose microcapsules. The yields of preparation and drug entrapment efficiencies were good for all microcapsules obtained. However MC4 shows the more sustained drug release characteristic (63.36%) over 24 hr of time as compare to the other formulations so may be suitable for preparation of sustained release oral or vaginal tablets.
TABLE 6: IN VITRO DRUG RELEASE KINETIC STUDIES OF ZIDOVUDINE LOADED MICROCAPSULE FORMULATIONS
FC
Zero order First order Higuchi model
Korsmeyer-peppas model
r2 Ko (µg/sec) r2 K1 r
2
KH (µg/√sec) r 2
n comment
MC2 0.557 2.704 0.946 -0.046 0.788 15.46 0.993 0.182 Fickian diffusion
MC3 0.530 2.036 0.750 -0.019 0.858 11.71 0.981 0.141 Fickian diffusion
MC4 0.745 1.437 0.756 -0.013 0.976 10.53 0.99 0.172 Fickian diffusion
MC5 0.621 2.275 0.828 -0.020 0.937 12.70 0.982 0.162 Fickian diffusion
MC6 0.826 10.69 0.998 -0.186 0.969 34.70 0.947 0.343 Fickian diffusion
MC7 0.502 2.039 0.730 -0.015 0.762 12.07 0.976 0.225 Fickian diffusion
REFERENCE:
1. Tripathi KD: Essentials of Medical Pharmacology. Jaypee brothers New Delhi. 5th eds. 2004.
2. Laurence LB, Johns L and Keith LP, Goodman and Gillman’s: The pharmacological basis of therapeutics, 11, 2007: 1273-1310.
3. Lordi N. G: Theory and practice of industrial pharmacy. Vargheese Mumbai. 3rd eds. 1991: 412-429.
4. Torrado J.J., IIIum L. and Devis S.S., Partical size and size distribution of albumin microsphere, Int. J. Pharm 1989; 51; 85-93
5. Jain N.K., Controlled and Novel Drug Delivery. New Delhi: CBS Publishers and Distributors, 1st ed. 1997: 526- 555. 6. Benita S. and Donbrow M., Release kinetics of sparingly
soluble drugs from ethyl cellulose-walled microcapsules: theophylline microcapsules, J. Pharm Pharmacol 1982; 34 (2); 77-82.
7. Benita S. and Donbrow M., Release kinetics of sparingly soluble drugs from ethyl cellulose-walled microcapsules: salicylamide microcapsules, J. Pharm Pharmacol. 1982; 34 (9); 547-51.
8. Raghubanshi R.S., Jayaswal S.B. and Singh J., Controlled-release tablets of ethyl cellulose coated salbutamol sulphate microcapsules, Pharmazie 1991; 46; 144-45. 9. Bakan JA. Microencapsulation. In Lachman L, Liberman
HA, Kanig JL. The theory and practice of Industrial Pharmacy. Varghese publishing house Bombay. 3rd ed 1991: 412-429 .
10. Prakash K, Raju PN, Shanta KK and Lakshmi MN. Preparation and characterization of lamivudine microcapsules using various cellulose polymers. Tropical. J. Pharma. Research. 2007; 6(4); 841-47
11. Bhumkar DR, Patil VB and Pokharkar VB, Studies on effect of variabilities by response surface methodology for Naproxane microspheres, Indian drugs 2003; 40 (8); 455-61.
12. Martin’s physical pharmacy and pharmaceutical sciences. 5th ed. Lippincott. williams and wilkins, 2006: 536-537. 13. Shovarani KN and Goundalkar AG. Preparation and
[image:8.612.53.566.276.431.2]Available online on www.ijpsr.com 297
14. Morkhade DM, Nande VS and Phapal SM. A new technique to prepare ethyl cellulose microcapsules containing diclofenac sodium. J. Pharm. Res. 2007; 6(2); 82-88 15. Abu-Izza K, Garcia LC and Robert D. Preparation and
evaluation of Zidovudine loaded sustain release microspheres: optimization of multiple response variables. J. Pharm. Sci. 1996; 85(6); 572-74.
16. Wells J. Pharmaceutical preformulation: Physiochemical Properties of drug substances. In Pharmaceutics the science of dosage form design .Edited by Aulton ME. Elsevier Limited. 2002: 2nd ed: pp. 113-138.
17. Swamy PV, Hada A and Shirsand SB. Preparation and In Vitro evaluation of mucoadhesive microcapsules of Atenolol. Ind. J. Pharm. Res 2007; 41(4); 358-64.
18. Liu Z, Weiyue L, Pengyun P and Jun P. In vitro and In vivo
studies on mucoadhesive microspheres of amoxicillin. J. Control. Release 2005; 102(2); 135-44.
19. Shenoy V and Agrawal S. Optimizing fast dissolving dosage form of diclofenac sodium by rapidly disintegrating agent Ind. J. Pharm. Sci; 2003; 3; 197-07.