7330
WEATHER INDEX FOR CONSTRUCTION INJURY
HYUN-JIN, YEO
Assistant Professor, Dongseo University, Division of Digital Contents, South Korea E-mail: [email protected]
ABSTRACT
The Korea has definite four seasons each having different temperature, humidity, and other weather factors. In that, the KMA(Korea Meteorological Administration) has been released diverse weather indexes from life style to industry weather indexes. However, indexes released by the KMA has rough numbers(indicators) which are not from data of industry when it comes to construction and other occupational injury related indexes. By the way, an occupational injury has been world widely studied to protect employees’ life and labor power since an injury may cause death or partial disable. Especially, in construct area, an occupational injury is the most important concerns of construction companies. In this research, I merged weather data from KMA and occupational injury data from the KOSHA(Korea Occupational Safety and Health Agency) to make safety weather index with optimal scaling methodology. As a result, I made seven grade safety weather index which divided by injury type in construction industry. Keywords: Occupational injury, Construction injury, Weather index, Safety weather
1. INTRODUCTION
1.1 Weather analysis
The Korea Meteorological Administration has been developed and released diverse weather related information not only common information such as temperature and humidity but also life indexes such as ultraviolet for outside activity, food poisoning, sensory temperature, laundry washing index, and other life related indexes [1]. Although those have not specific grades, 5 grades including low, normal, high, very high and danger, Koreans utilize those indexes as parameter of their lifestyle. Especially, today, the concentration of fine dust index becomes core index for outdoor activities such as running, picnic, and others.
Since the Korea Meteorological Administration (KMA) has released diverse and life practical indexes, diverse life familiar indexes have been continuously developed including convergence indexes meaning indexes for special purpose such as pollution index for factories and fine dust indexes for users who concerns air they breath and those who are mostly living in populated city such as the Seoul. Table 1 below shows life-style weather indexes those KMA release by website and smartphone application. Those index service supports open API that could facilitate diverse applicable services by not only government organizations but also weather information user
companies such as building construction companies and airline companies
TABLE 1:KMALIFE WEATHER INDEX SERVICE
Segment Index
Life Weather
Index
Ultra Violet rays Index Food Poisoning Index
Heat Index Rotten Index Discomfort Index Wind Chill Index Freeze and Burst Index Frostbite Possibility Index Atmospheric Diffusion Index
7331 1.2 Occupational Injury and Construction
In 2016, an occupational injury and illnesses rate of the Korea is 0.49% and death rate is 0.96% when accidental death is 0.53% of them, meaning one of a hundred of employee is dead when he or she works [3]. In numbers, dead by accident employee is 969 which is 1.5% increase than prior year when number of accidental injury employee is 82,780 which is 0.7% increase [3]. The number looks not much for countries having more population then the Korea. However, the Korea has about 45million population and is aging society meaning work force is decreasing year by year. In that the Korea government efforts to decrease occupational injury and illness especially injuries those are much easier to manage than illness because illness is hard to control with system.
An occupational injury and illnesses are one of major concerns of government not only the Korean but also other major countries [4]. The United States has been managed nonfatal injuries and illnesses since 2003 and now, has 40 percent decreased TRC(Total Recordable Cases) [3][4]. Although the dramatic decrease happens on non-fatal injuries and illnesses area where healthcare and manufacturing industry causes most cases, the decreasing rate and speed is worthy of close attention when it comes to the England’s high non-fatal and non-fatal injury and illness rate [5]. Whether it’s fatal or non-fatal, an occupational injury and illnesses are hardly managed and monitored by government agency in each countries.
Although each country has own different economic and environmental condition which causes unique occupational injury management system, industries those causes injuries are similar: healthcare, construction and manufacturing. Figure 1 shows number of non-fatal occupational injury and illness employee in the Korea. In the graph except ‘other industry’ which means service industries such as health care, social welfare, cooking, and hotel, a manufacturing and construction injury and illness victims are dramatically higher than other industries even it’s non-fatal. Unlike to the Korean, in the United States, construction industry has relatively lower than other industries [2][3].
Figure 2 shows a fatal occupational injury and illnesses in the Korea. Unlike to non-fatal, a construction, mining, and manufacturing industry is much more higher than others even than service industry (other industry in figure 2) [2][3].
[image:2.612.308.521.171.299.2]Although the Korea has diverse industries, it still has labor oriented industry such as building construction as a major industry which causes frequent accident as one can see figure 2 because there are more manual labor workers in the industry [6].
Figure 1: Korean Non-Fatal Occupational Injury & Illness
Figure 2: Fatal Occupational Injury & Illness in the Korea
Because of the higher accident case of construction, mining, and manufacturing industry, the Korean research for occupational injury and illness focuses on those industries [7]. Figure 3 shows reasons of fatal occupational injury in the Korea that the most high rate in ‘fall’. The figure illustrates purpose of this research because falling death happens barely in manufacturing or mining industry. In manufacturing and mining industry, they have less high attitude work environment than construction such as building.
[image:2.612.314.510.333.440.2]7332
Figure 3: Reasons of Fatal Occupational Injury
2. RELATED RESEARCHES
2.1 Weather Information for Industries
The Korea Meteorological Administration continuously release industrial weather indexes for five industries: agriculture, construction, energy, logistics and hightway at table 2 [2]. There are four indexes for construction area having the most many indexes with logistics area because those two industries’ work safety relates to weather condition that lead detail indexes for them. Although those are developed by huge data of the administartion, those indexes are not from convergence way, meaning it’s from data of the administration itself but not joinning other administration or facilities’ database such as the Ministry of employment and labor that we used for this research.
TABLE 2:KMAINDUSTRIAL WEATHER INDEX
Industry Index Name
Agriculture Agriculture Facility Pesticide Spray
Construction
Foundation Construction
Frame Construction
Stone Construction
Finishing Construction
Energy Heating Energy
Cooling Energy
Logistics
Fruits, Vegetables
Sea Foods
Ice cream
Transport
Highway Highway
In that, especially for construction area, there are very rough grades as one can see at table 3. There are only three grades: bad, normal, and good for constrauction indexes. Below table 3 shows frame construction weather indexes and description. As one can see, each grade looks have specific numbers of guide, however, those are very similar to other outside activity index guide numbers such as indexes for outside leisure activities and also deales with only amount of rain and temperature.
Besides the weather indicators issue above paragraph, the KMA construction index has other limitation: type of injury. The index comes from type of construction such as frame, stone, finishing and foundation but not from types of injuries. That means, it is activity recommendation index rather than ‘safety weather index’. As one can see at Figure 1 to 3, an occupational injury rate is differenciate by types of reason of injuries even it is fatal or non-fatal. Those graphs shows injuries should be analyzed by each, and also, wetather factor should be located on each injury type data rather than type of construction.
Types of construction in FMA indexes would not directly be related to occupational injuries because all types of injuries could be happened in every types of construction. For example, the injury cause ‘fall’ in construction industry, may happened all four: foundation, stone, finishing, and frame construction environments. The cause ‘fall’ does not depends on a type of construction but a type of work on injury day. Not only finising contruction has high height position work, but also other three could have. Furthermore, cause ‘fall’ may be happened in low height.
TABLE 3:FRAME CONSTRUCTION WEATHER INDEX
Grade Condition Weather Description
Bad
Over 5mm rain per day or minimum temperature under 0℃ or maximum is over 30℃
Safe and process effectiveness is very low. Better to not work.
Normal
Day rain amount under 5mm or daily average temperature over 5℃ or
under 17℃
[image:3.612.90.526.440.722.2]7333 Good
No rain and minimum temperature over 5℃ and
maximum is under 25℃
Good for construction
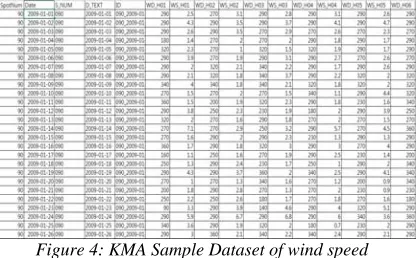
[image:4.612.90.300.356.485.2]Although indexes of KMA about construction is not suitable to prevent occupational injuries, KMA released open API(Application Program Interface) for weather raw data and open there weather data via website. The Korea Open Data Council(ODC) that supports and make regulations for opening public data released related law in 2013 [11]. The weather dataset which opened with open API is contactable to download with text format to put into any types of database that user utilize. Figure 4 shows sample dataset of KMA for wind speed. As one can see, it has observation spot number and wind speed data recored by every one hour. In this research, I utilize KMA past 5 years raw data about temperature, humidity, amount of rain, wind speed, and amout of snow.
Figure 4: KMA Sample Dataset of wind speed
2.2 Optimal Scaling
Gifi (1990) offers a comprehensive collection of nonlinear multivariate methods based on optimal scaling [12]. . The start point of underlying analysis is a 0/1 dummy matrix which is based on the data considered as categorical. As a result, a loss function which involving the unknown object and category scores is established. During the iterations analyzer squeeze the variables and calculates category scores that they are optimal in the sense of a minimal loss function. These procedures are referred to as optimal scaling full range of parameters either [13]. There are two types of aspect for optimal scaling: Correlational and Non-Correlational aspect.
In correlational aspect and optimization, simple example is correaltion matrix meaning there are only two variables. The variation of the correlation coefficient by choise of category
quatification [14]. In general case, there are multi variables not only two those lead diverse analysis forms: sum of correlations, sum of absolute correlations, eigenvalue aspect, determinal aspect, squared multiple correlations, and sum of squared multiple correlations [13]. In Non-correlational aspect, meaning linearizing regressions, the bilinearizability is core issue. Bilinearizability means that we can find transformations of the variables such that all bivariate regressions are exactly linear [13].
3. RESEARCH METHODOLOGY
3.1 Data Join and Cleansing
This study uses three years weather data since 2010 by the Korea Meteorological Administration (KMA) an hour diced and the same period occupational injury dataset from the Korea Occupational Safety and Health Agency (KOSHA). In order to join two different types of dataset setting primary key for database is core. The common and only factor of two different source dataset is region: the weather observation spot coordinates, and occupational injury accident spot in occupational injury report.
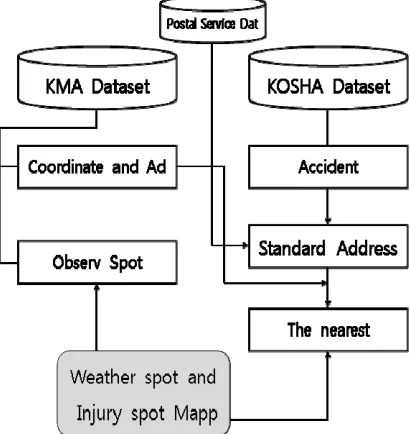
Before join two dataset, modification of regional data was necessary because the region data of KMA’s is coordinate and KOSHA’s is administrational address where the address regulation has been changed twice. Therefore, modifying regional data to match each of dataset is essential. In this research, I modified and matched them by four steps. First, I modified all old fashioned KOSHA’s address data to new address regulation by text divide work with the Korean postal service address history data. Second, transform administrational address data at first step to coordinate data via weather spot address dataset of KMA. Third, calculate the nearest weather observation spot coordinate from occupational injury report address. Last, marked unique number according to coordinate data at each dataset. Figure 5 shows the process of primary key generation.
7334 between weather factors and occupational injury, we choose the closer spot to downtown or lower height. Those kind of works could not avoid manual works because observation spot has own characteristic and purpose.
[image:5.612.312.522.182.448.2]Figure 5 shows the brief process of primary key generation without manual several works. The process basically includes data format related works such as transforming character field to numeric for matching.
Figure 5: Dataset Join Primary Key Generation Process
After mapping regional spot, time mapping is performed. The KMA weather dataset has separate date format field and text based hour term time field ‘hour(numeric)+h(character)’ and KOSHA dataset has one field having date and specific time. In that, the KOSHA time field should be divided to date and time that transformed to KMA format. Firstly, date and time is divided by simple database function ‘left’ and time is transformed by below rule. In the notation, t(m) stands for minutes of KMA format time while t(h) is hour. The final primary key made for this research is combination of spotnumber in figure 5 and h in below notation and final dataset consist of 197,382 records.
IF t(m) > 30 THEN h=t(h)+1 ELSE h=t(h) (1)
Although KMA weather data and KOSHA occupational injury dataset is joined, there are massive cleansing works remains especially for KOSHA dataset because KOSHA injury reporting system input interface has lots of informal factors meaning those are not standardized or have been changed. For example, some of injury cause has
multi-choice such as falling and slip, and some of them are not formal select input, but free text form.
Figure 6 shows informal dataset of injury data, and to standardize the dataset, decision of analysis purpose field is necessary. Since the purpose of this research is to make ‘safety weather index’, I clarify necessary fields such as time and type of injury.
↓ ↓ ↓
Figure 6: Informal Dataset is cleaned and joined to formal
Since the weather measurement spot is not directly accurate to regional section of Korea, transfer measurement instrument spot to regional data is firstly performed. In this study we transfer spot number to minimum legal region size ‘Dong’ and mark post code for them.
There are also multiple spots in same region because of height of instrument and other factors. Since purpose of this study is find out relation between weather factors and industrial injury, we choose the closer spot to downtown or lower height. Final dataset consist of 518,208 records.
3.2 Correlation and Optimal Scaling
[image:5.612.91.296.211.428.2]7335 For correlation analysis with five weather factors and injury accident, target injury accident type is chosen by their frequency. In this research I choose three major accident: drop(15.1%), stuck(17.1%), and trip(18.7%). These three injury accidents are over 50% of occupational injury reason in construction industry and supposed to related to weather condition.
4. ANALYSIS RESULT 4.1 Basic data analysis
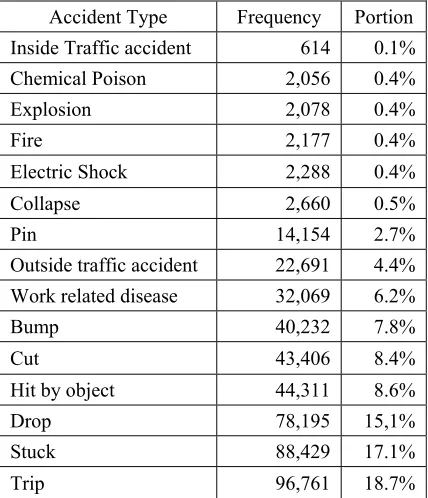
Table 4 show major frequency of accident from dataset I utilize for this research. Although there are diverse accident factors not listed on table 4 such as drawn, animal attack, violence, and suffocation, those are not analyzed because of their small sample size. In this research, I utilize top three portion accident type.
However, there are still diverse factors to be analyzed such as hit by object, cut, and bump. In occupational injury research, in fact, every accident type is important because those are directly or indirectly related to employee’s life: life not only in terms of live or dead but also their remaining life because those kind of injury usually lead physical body disable.
TABLE 4:FREQUENCY OF MAJOR ACCIDENT TYPE IN CONSTRUCTION INDUSTRY
Accident Type Frequency Portion
Inside Traffic accident 614 0.1%
Chemical Poison 2,056 0.4%
Explosion 2,078 0.4%
Fire 2,177 0.4%
Electric Shock 2,288 0.4%
Collapse 2,660 0.5%
Pin 14,154 2.7%
Outside traffic accident 22,691 4.4%
Work related disease 32,069 6.2%
Bump 40,232 7.8%
Cut 43,406 8.4%
Hit by object 44,311 8.6%
Drop 78,195 15,1%
Stuck 88,429 17.1%
Trip 96,761 18.7%
When it comes to monthly data, almost all months have trip as the highest rank except April,
May, and July. In those months, stuck accident type get the highest frequency rank those phenomenon could be told that there are weather factors. However, one can find in this research, there are not simple causality between weather factors and occupational injury meaning not there are no’ causality but not ‘simple’ causality that I found in this research. There could be causality for further research such as pattern analysis and so on. Simple causality test shows at logistic regressions below.
4.2 Logistic Regression
In order to analyse causality, several logistic regression is performed. As a result there are not considerable direct causality between weather factors and occupational injury, but it is just simple analysis result for further studies not a purpose of this research. Table 5 shows binomial logistic regression result. In binomial logistic, dependent variable is accident happened or not.
TABLE 5:BINOMIAL LOGISTIC REGRESSION
` likelihood -2log Cox and snell R square
Nagelkerke R Square
Temp 3285968 .005 .011
Hmd 3285968 .005 .011
W.S 3290624 .005 .009
Rain 3313045 .000 .000
Snow 3313043 .000 .000
Besides the binomial logistic regression, multi logistic and other regression test shows there are not direct causal relationship between weather and accident. Table 6 shows R-square of multi logistic regression which also has very weak causality between weather and occupational accident. Above all negative result about casual relationships, however, it does only means weather factors directly causes occupational accident not means there are not any relationship between them. Related research also shows there are not simple direct causal relationship between them [17]. It does mean there are complex causal relation between weather and accident.
TABLE 6:MULTI LOGISTIC REGRESSION
Pseudo R-Square
[image:6.612.88.302.442.691.2]7336
Nagelkerke .069
McFadden .051
4.3 Optimal Scaling
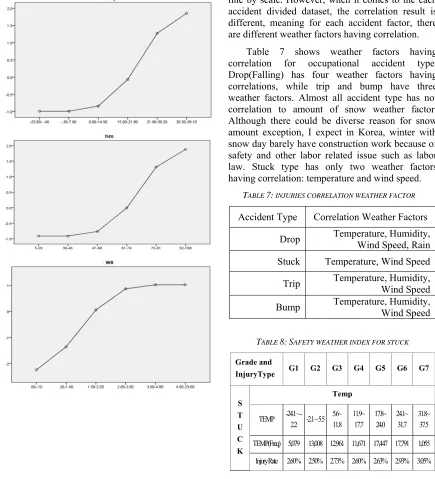
Figure 7 shows result of optimal scaling for with seven degree for temperature, humidity, and wind speed those have enough observation numbers. Rain and snow amount has not seven degree because of observation frequency meaning in rainy and snow day, construction is usually stopped.
Figure 7: Optimal Scaling Result
As one can see at figure 7, for each weather factors, it has significant linear or non-linear trend line by scale. However, when it comes to the each accident divided dataset, the correlation result is different, meaning for each accident factor, there are different weather factors having correlation.
Table 7 shows weather factors having correlation for occupational accident type. Drop(Falling) has four weather factors having correlations, while trip and bump have three weather factors. Almost all accident type has not correlation to amount of snow weather factor. Although there could be diverse reason for snow amount exception, I expect in Korea, winter with snow day barely have construction work because of safety and other labor related issue such as labor law. Stuck type has only two weather factors having correlation: temperature and wind speed.
TABLE 7: INJURIES CORRELATION WEATHER FACTOR Accident Type Correlation Weather Factors
Drop Temperature, Humidity, Wind Speed, Rain
Stuck Temperature, Wind Speed
Trip Temperature, Humidity, Wind Speed
Bump Temperature, Humidity, Wind Speed
TABLE 8:SAFETY WEATHER INDEX FOR STUCK
Grade and
InjuryType G1 G2 G3 G4 G5 G6 G7
S T U C K
Temp
TEMP 24.1 ~ -2.2 -2.1 ~ 5.5
5.6~ 11.8
11.9~ 17.7
17.8~ 24.0
24.1~ 31.7
31.8~ 37.5
TEMP(Freq) 5,079 13,008 12,961 11,671 17,447 17,791 1,055
[image:7.612.106.525.61.229.2] [image:7.612.85.520.257.736.2]7337
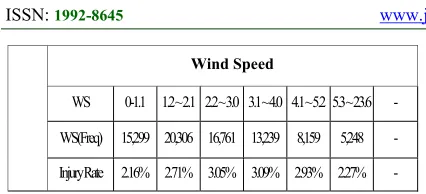
Wind Speed
WS 0-1.1 1.2 ~ 2.1 2.2 ~ 3.0 3.1 ~ 4.0 4.1 ~ 5.2 5.3 ~ 23.6 -
WS(Freq) 15,299 20,306 16,761 13,239 8,159 5,248 -
[image:8.612.88.301.71.168.2]Injury Rate 2.16% 2.71% 3.05% 3.09% 2.93% 2.27% -
Table 8 shows sample safety weather index for stuck injury accident. For comfort, grades are named G1 to G7, but numbers on grade does not mean it’s injury rate is higher or lower. In stuck case, temperate G3, G6, and G7 has high accident rate then others while wind speed G3,4 and 5 has. However, when it comes to the frequency, temperate grade 2, 5, and 6 has the highest injury frequency. This index reflect construction work frequency on those temperature. In Korea, those temperatures are spring or autumn those season have very high density of construction. In that, application of index should be consider both frequency and accident rate.
5. CONCLUSION
In this research, whole three years weather dataset and occupational injury dataset is merged to analyze by coordinate of weather observation point and hour unit time. Five weather factors are utilized for analysis and representative three injury factors are also analyzed. Data cleaning and merging methodologies are complicate because of different data source and standard they have.
In causal relation analysis, there are not simple significant causality found in this research. However, causal relation analysis is not for main purpose of this research and simply analyzed for future research. Through correlation analysis and optimal scaling, I found significant correlation between weather factors and injury accident reason, and through the optimal scaling for each injury type, this research suggests safety weather index for construction industry. Grades number in the index does not mean degree of injury warning rate and both frequency and injury rate for each grade should be considered for safety.
6. LIMITATION AND FUTURE RESEARCH Although this research suggests methodology to make database based safety weather index, there are limitations and need further research. Firstly, the dataset in this research could not distinguish that there was a construction or not. That means injury
rate is affected. Secondly, causal relation analysis is simply performed because of this research main purpose: safety index. In that, in further research, more detail causality research could make significant result to prevent occupational injuries. On third, optimal scaling grade is targeted to seven, for detail and those specific target grade could lead different index result.
REFRENCES:
[1] Korea Meteorological Administration,
http://web.kma.go.kr/eng/
[2] Korea Meteorological Institute, “Fusion method research weather information and other industries in the point of big data”, 2013 [3] Korea Ministry of Employment and Labor,
“Statistics of occupational injury 2016”, 2017. [4] U.S Bureau of Labor Statistics, Department of
Labor, “2016 Survey of Occupational Injuries & Illness Chart Package”, Nov. 2017.
[5] U.S. Bureau of Labor Statistics, “Employer-Reported Workplace Injuries and Ilnesses-12016”, Nov.201.
[6] Health and Safety Executive, “Kinds of accident in Great Britain, 2017”, 2017
[7] H.J. Yoon, J.H. Kim, and P. Kim, “Research for Early Warning System Information Strategy”, Korea Occupational Safety and Health Agency, 2009.
[8] Korea Occupational Safety & Health Agency, “Research for Strategy Planning of Early Warning System Information”, 2009.
[9] Y.S. Lee, K.S. Son, and J.M. Han, “Development of Warning Program for the Occurrence of Industrial Accident”, 2006 [10] J.H. Kim, Y.S. Lee, and H.S. Yoon, “Research
for occupational injury prevent total DW”, Korea Occupational Safety & Health Agency, 2012
[11] Open data strategy council, “Public Data Provide and usage law”, 2013.
[12] A. Gifi, “Nonlinear Multivariate Analysis”, John Wiley & Sons, Chichester, England. [13] P. Mair, and J.D. Leeuw, “A General
Framework for Multivariate Analysis with Optimal Scaling: The R Package aspect”, Journal of Statistical Software, Vol.32, No.9, 2010.
[14] De Leeuw J, “Models and Methods for the Analysis of Correlation Coefficients”, Journal of Econometrics, Vol. 22, pp.113–137, 1983. [15] B.C. Catherine, and A.R, Daniel, “Assessing
7338 Research and Public Health, Vol.6, pp.2639-2654, 2009.
[16] N.A. Kartam, I. Flood, and P. Koushki, “Construction safety in Kuwait: issues, procedures, problems, and recommendations", Safety Science, Vol.36, pp.163-184, 2000. [17] Y.S. Kim, “Industrial Injury Prediction via